KUO, ERIC WEILIN. The Development and Validation of the Team Information Network Scale (TINS). (Under the direction of Dr. Lori Foster).
by Eric Weilin Kuo
A dissertation submitted to the Graduate Faculty of North Carolina State University
in partial fulfillment of the requirements for the degree of
Doctor of Philosophy Psychology
Raleigh, North Carolina 2017
APPROVED BY:
_________________________ _________________________ Dr. Lori Foster Dr. Adam Meade
Committee Chair
BIOGRAPHY
Eric Weilin Kuo graduated from the University of Maryland at College Park in 2009 with a B.A. in Psychology and Sociology. In Fall 2009, he entered the doctoral program in
Industrial/Organizational (I/O) Psychology at North Carolina State University, and obtained his M.S. in I/O Psychology in Spring 2013. He currently works at a not-for-profit research
Table of Contents
List of Tables ... v
The Development and Validation of the Team Information Network Scale (TINS) ... 1
Theoretical Foundations ... 2
The Need for Validated Social Network Measures ... 5
Information and Social Network Types ... 8
Advice Networks. ... 8
Normative Networks... 9
Referent Networks. ... 10
Phase 1 – Item Generation and Content Validation ... 12
Item Generation ... 12
Methods ... 13
Results ... 13
Phase 2 – Factor Analysis ... 14
Methods ... 14
Results ... 15
Phase 3 – Convergent and Discriminant Analysis ... 17
Methods ... 20
Measures... 22
Advice Network. ... 22
Normative Network. ... 22
Referent Network. ... 23
Task Objective Agreement. ... 23
Role Clarity... 23
Process Conflict. ... 24
Results ... 24
Discussion ... 27
References ... 32
Appendix A. SAMPLE SOCIAL NETWORK MEASURE ... 61
Appendix B. CONSTRUCT DEFINITIONS ... 62
Appendix C. CONVERGENT VALIDITY: H2 – H4 ... 63
Appendix D. DISCRIMINANT VALIDITY: RQ1 - RQ3 ... 64
Appendix E. CRITERION VALIDITY: H5 – H7 ... 65
Appendix F. INCREMENTAL VALIDITY: H8 - H10 ... 66
List of Tables
Table 1. Example of Social Network Study on Teams that Use Mismatched Measures ... 41
Table 2. Types of Social Networks and Corresponding Type of Information Exchanged ... 42
Table 3 TINS – Advice Initial Items and Content Validity Ratio (CVR) ... 43
Table 4 TINS – Normative Initial Items and Content Validity Ratio (CVR) ... 44
Table 5 TINS – Referent Initial Items and Content Validity Ratio (CVR) ... 45
Table 6 Initial CFA Results Prior to Scale Refinement ... 46
Table 7 Factor Loading for TINS – Advice ... 47
Table 8 Factor Loading for TINS – Normative ... 48
Table 9 Factor Loading for TINS – Referent ... 49
Table 10 TINS – Final Scale ... 50
Table 11 Descriptive Statistics – Phase 3 Measures ... 51
Table 12 Time 1 - Correlations among Predictor and Outcome Variables ... 52
Table 13 Time 2 - Correlations among Predictor and Outcome Variables ... 53
Table 14 Time 3 - Correlations among Predictor and Outcome Variables ... 54
Table 15 Convergent Validity - Multilevel Modeling Results for Hypotheses 2 to 4 ... 55
Table 16 Discriminant Validity - MLM Results for Research Questions 1 to 3 ... 56
Table 17 Criterion Validity - MLM Results for Hypotheses 2 to 4 ... 57
The Development and Validation of the Team Information Network Scale (TINS)
Organizations use teams to manage a flexible, global, workforce (Gibson & Gibbs, 2006; Tannenbaum, Mathieu, Salas, & Cohen, 2012). Teams are complex dynamic systems wherein two or more interdependent individuals engage in coordinated actions to pursue a common goal (Guzzo & Dickson, 1996; Katzenbach & Smith, 1993; McGrath, Arrow, & Berdahl, 2000; Salas, Bowers, & Cannon-Bowers, 1995). In order for teams to function, members need to interact (formally or informally) to leverage skills and resources (Campion, Medsker, & Higgs, 1993; Henttonen, 2010; McGrath et al., 2000). This exchange of resources is an inherent assumption behind the use of teams, and researchers often examine social networks to study these dynamics (Balkundi & Harrison, 2006).
A social network is a group of actors (i.e., individuals) and the relationships (i.e., ties) among them (Brass, Galaskiewicz, Greve, & Tsai, 2004; Wasserman & Faust, 1994). In the context of teams, researchers often look at social networks to study the dissemination of
To date, no teams research studying social networks has used validated social network measures. Furthermore, existing research studying social networks in teams often use imprecise conceptualization and measures of social networks, which can hinder the accuracy of the conclusions drawn from teams research. The current study sought to develop and validate a social network measure, the Team Information Network Scale (TINS). Specifically, the TINS measures the exchange of three types of information amongst team members – task, normative, and team-member information.
Theoretical Foundations
When studying social networks in research, investigators need to figure out how to measure the network itself. Social networks can be measured using a variety of different methods, requiring researchers to select from multiple approaches. The correct approach is contingent upon the theory being tested (Krackhardt, 1987). Appendix A shows an example of a social network measure that a researcher may use when studying frequency of communication between team members (Reagans & Zuckerman, 2001). In this measure, a roster method was adopted where participants are provided the names of their teammates and asked to rate how frequently they communicate with each individual. Another researcher studying friendships among team-members may use the same roster method and procedure, but instead ask
In selecting the most suitable approach, four key points need to be considered. The first point of consideration when selecting social network measures in research is the need to specify the relational content of a social network. In a social network, social ties connect individuals to one another. Relational contents describe the type of ties that connect individuals in a social network (Wasserman & Faust, 1994). For example, a researcher using social networks to study the transfer of information among employees in a department may ask employees to evaluate the degree to which they exchange task-related (i.e., advice), policy-related (i.e., normative), or role-related (i.e., referent) information with other coworkers. Other examples of relational content include exchange of social support (e.g., friendship) and transfer of material resources
(Wasserman & Faust, 1994). Specification of relational content is important as it determines which measures are appropriate.
The third point of consideration is the need for researchers to select measures that not only tap into the proper relational content and network constructs, but also possess desirable psychometric properties. To address these considerations, social-network researchers have emphasized the importance of using theory to drive the selection of social network measures (Krackhardt, 1987; Wasserman & Faust, 1994). Fourth and finally, it is important to determine which individuals will be included in the social network (Wasserman & Faust, 1994). Because social networks measure individuals within a given system, researchers need to define the system and establish the boundaries in which the social network exists.
The Need for Validated Social Network Measures
As noted, social network measures vary in relational content, and researchers need to select the relational content that best captures the social network being studied. Teams research often focuses on the exchange of information and its importance in facilitating a shared
understanding of the task and the team dynamics (Balkundi & Harrison, 2006; Marks, Mathieu, & Zaccaro, 2001). Different types of information contribute to either the understanding of the task itself or how team members interact with one another (Cannon-Bowers, Salas, & Converse, 1993; Mathieu, Heffner, Goodwin, Salas, & Cannon-Bowers, 2000). This suggests that when studying information exchange among team members, identifying, defining, and measuring the relational content of information type is essential. Because the current study focuses on
information type as the relational content of interest, the term “information type” will be used in lieu of “relational content” for the remainder of the study.
The type of information measured by researchers often does not match that of the social network of interest. Table 1 provides examples of social network studies where the measure in use does not capture the type of network under investigation. For instance, Table 1 shows that it is common for researchers to study information flow using social network measures that broadly encompass multiple types of information. At the broadest level, researchers may study
not valid because of the inability to parse out the effects exchanging different information types or other resources such as emotional support.
A review by Phelps, Heidl, and Wadhwa (2012) found a copious amount of empirical research studying the exchange of "knowledge" (i.e., knowledge networks) among individuals both in the context of teams and organizations as a whole. In teams research, the distinction between "knowledge" and "information" is seldom made, often leading to the two terms being used interchangeably (see Table 1). While the distinction is subtle, research has suggested that knowledge is the product of associative linkages made between pieces of information (Anderson, 1982). In other words, evaluating knowledge exchange between team members is similar to if not the same as studying the transfer of entire bodies of information. While knowledge networks are more specific in content than communication networks, knowledge networks do not
distinguish between the exchange of different types of information (Phelps et al., 2012). This is important to realize because like communication networks, studies using knowledge networks are not able to separate the effects of specific information types.
The problems associated with a lack of distinction between knowledge and information become more apparent when researchers attempt to study transfer of specific information types. For instance, advice networks are often defined as relationships where “job-relevant”
definition commonly used in studies blurs this conceptual boundary leading advice and
knowledge networks to occupy the same construct domain. When assessing information flow in a social network, information type needs to be specifically identified and defined especially if the transfer of information is being linked to specific outcomes.
Existing research in teams and organizational psychology (e.g., Miller & Jablin, 1991) has identified three types of information commonly transferred in social networks: task,
normative, and team-member. With the exception of advice networks, no social network measure has been designed to capture the exchange of different information types. Furthermore, the social network measures currently in use often only contain a single-item (e.g., “whom do you go to for work related advice?”). In addition to inadequately measuring complex constructs (Hinkin, 1998), single-item measures are susceptible to a variety of measurement-related problems leading to a lack of statistical validity (Tourangeau, Rips, & Rasinski, 2000). As seen in the following sections, the interactions that occur within social networks encompass many specific behaviors, and existing social network measures do not capture these specific behaviors. Thus, there is a need for a social network measure that not only distinguishes among different
information types, but also possesses desirable psychometric properties.
Information and Social Network Types
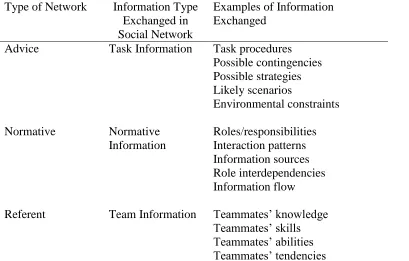
Members of a team exchange a lot of information with each other, and the current study posits that information is exchanged via one of three types of social networks: advice, normative, and referent. Furthermore, each of these types of social networks corresponds to the exchange of a specific type of information (task, team-related, and normative respectively). Table 2 provides a summary of the different social networks and their corresponding information type. Each type of information exchange contributes to different aspects of a team’s wellbeing and performance (e.g., Cannon-Bowers et al., 1993; Henttonen, 2010). To be valid, the TINS must differentiate between the three different types of networks discussed below.
Advice Networks. While multiple definitions of advice networks exist, the current study uses the definition accepted in organizational psychology, which defines advice networks in teams as social networks that represent team members and their exchange of task information (e.g., Morrison, 2002; Sparrowe, Liden, Wayne, & Kraimer, 2001; Wong 2008). Task
information pertains to information about the task/project and how it must be accomplished in addition to information about the influences of potential environmental factors (Cannon-Bowers et al., 1993). For example, teams with geographically dispersed members not only need to know how to complete a project, but also need to take into account factors that can influence the completion of the project (e.g., time differences among team members, potential breakdowns in communication technology).
measure of a team advice network needs to capture behaviors such as solution seeking where the task information is used to solve a problem and problem reformulation where team members re-evaluate the situation, and a new strategy for completing a task is created (Cross et al., 2001).
Advice networks can be used to study initial team formation when the discussion of task, assignment, or mission is crucial. This active discussion of the task and dissemination of task information leads to the formation of group goals. However, not all teams engage in discussions about the task when they are newly formed. A lack of task discussion among team members leads to a situation where members hold different perspectives of the task as a whole, the task demands, and perceived task difficulty (Marks et al., 2001; Turel & Zhang, 2010). Advice networks have the ability to capture the degree to which these types of discussions occur, and provide a new means of studying the degree to which active discussion contributes to outcomes such as agreement in task objectives and group goals.
roles/responsibilities, patterns of interactions, sources of information, and appropriate communication channels (Cannon-Bowers et al., 1993; Mathieu et al., 2000). Measures of normative networks need to capture behaviors such as seeking approval for specific actions, ideas, and legitimacy of sources (Cross et al., 2001).
A normative network measure would provide researchers a means of studying norm formation in teams. Newly formed teams lack established norms, and norm formation is facilitated by active discussion among team members (Graham, 2003). For team processes, actively discussing norms helps teams agree on what constitutes acceptable and unacceptable behavior. These shared values allow team members to view themselves as a member of a
collective group with a high level of role clarity and expectations (Graham, 2003; Mathieu et al., 2000). Normative networks can capture this exchange of normative information that is crucial in the discussion of formal rules and guidelines, and would allow researchers to investigate the degree to which the team develops as a cohesive group.
trusting and collaborative environment (Cannon-Bowers et al., 1993; Mathieu et al., 2000; Salas Sims, & Burke, 2005). Furthermore, active exchange of team member information in
conjunction with clarification of work roles is associated with effective workload sharing improving group performance (Campion et al., 1993; Salas et al., 2005). To accurately measure referent networks, a scale needs to capture behavior pertaining to team members seeking out information about who within the team is the most credible source or who possesses the necessary body of knowledge in question (Cross et al., 2001).
In teams research, managing team member workload is essential in mitigating the detrimental effects of process conflict, which is defined as controversies over how a task is accomplished (Jehn & Mannix, 2001; Salas et al., 2005). The creation of a measure of referent networks allows researchers to study how the degree of information exchange among team members directly influences relationships and/or conflict in teams.
Phase 1 – Item Generation and Content Validation
Item Generation
Using a deductive approach based on Hinkin’s (1998) scale development process, phase
1 seeks to obtain a pool of content-valid items that measure team advice, normative, and referent networks. An initial pool of 120 items (40 advice network, 40 normative network, 40 referent network) was generated based on construct definitions (Appendix B) from existing literature on team formation (Sparrow et al., 2001), information seeking in teams (Cross et al., 2001), and team-mental-model development (Cannon-Bowers et al., 1993; Mathieu et al., 2000). Items were written based on the criteria set by Hinkin (1998): short, written in easily comprehensible
language, and consistently behavioral in nature (Hinkin, 1998).
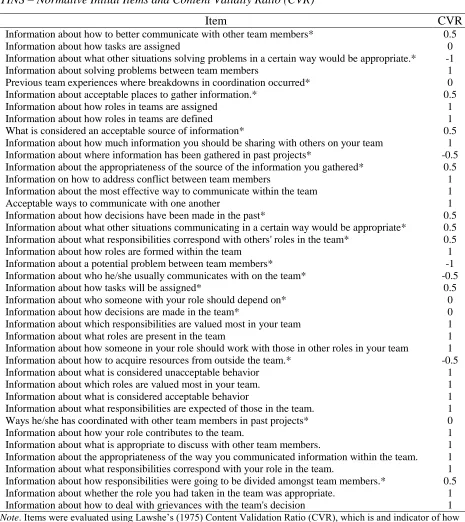
Instructions for the scale presented participants with the name of a team member they previously provided, and asked them to rate the frequency with which they received specific types of information from that team member. A sample item measuring advice networks is “Information about new ways to go about tasks for this project” (see Table 3 for full scale). For
normative networks, an example item is “Information about how roles in teams are assigned” (see Table 4 for full scale). Finally, a sample item from the referent network measure is
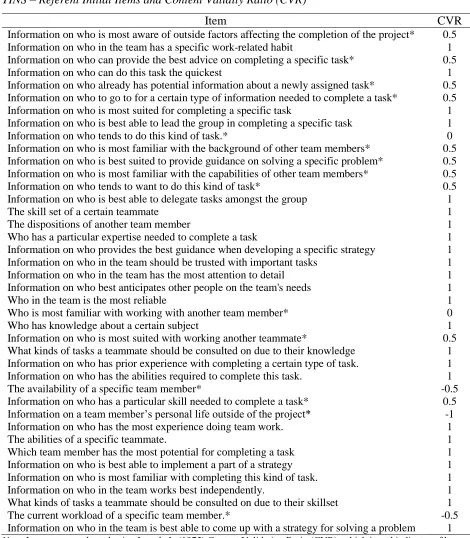
“Information on who has the abilities required to complete this task” (see Table 5 for full scale).
Items used a five-point Likert-type frequency scale (1= Never, 2 = Rarely, 3 = Occasionally, 4 =
Moderately, 5 = Frequently). A frequency-based Likert-type scale allows for the distinction
between strong and weak social ties, which is not as readily captured by an agreement scale (1 =
Strongly Disagree, 5 = Strongly Agree). Each team member gets a dimension score by taking the
Methods
Sample and Design. The generated items were subject to an assessment of content validity where subject matter experts (SMEs) rated the degree to which items matched their predetermined construct definition (Haynes, Richard, & Kubany, 1995). A total of 10 SMEs with psychometric experience (e.g., coursework, professional experience) participated in the study, 6 of whom possessed advanced degrees (e.g., M.S. or Ph.D.).
To address the issue of respondent fatigue from prolonged surveys, the original 120 items were randomly divided into two lists of 60 items each. Using a web-based survey tool, the lists were randomly sorted for each SME so items were presented in a different order to ensure the same item was not presented first or last each time. The SMEs were then provided a survey link which forwarded them to one of the two lists. Five of the 10 SMEs were randomly assigned to each of the lists per the minimum requirements recommended by Haynes et al. (1995).
Procedure. After providing informed consent, SMEs reviewed the construct definitions as well as one of the two randomized lists of items. They then used a Likert-type scale (1 = not at
all consistent, 4=completely consistent) to rate the degree to which the item’s content represents
the construct definitions presented. Each item was rated three times, once against each of the three social network types (i.e., advice, normative, referent). Upon completion of the ratings, participants were debriefed. Participants were given a $5.00 gift card for their responses. Results
CVR1 = Ne-(N/2) (N/2)
Because five SMEs rated each item, a CVR greater than .99 is needed to ensure item consistency to their corresponding definition is not due to chance per Lawshe’s (1975) recommendation. As such, items with a CVR below .99 were removed. Of the initial item bank, 10 advice network items, 19 normative network items, and 15 referent network items were removed. See Tables 3-5 for the full list of items that were removed and retained.
Phase 2 – Factor Analysis
Following assessment of content validation, Hinkin (1998) recommends conducting an exploratory factor analysis (EFA) for further item refinement and scaling. However, because existing theory strongly supports the notion of three distinct types of information (e.g., Cannon-Bowers et al., 1993), phase 2 of the current study followed a modified Hinkin (1998) approach where confirmatory factor analyses (CFAs) were used in conjunction with EFAs to test the hypothesis that the advice, normative, and team-information subscales will follow a three-factor model. Hypothesis 1 is stated as follows:
H1: CFAs will support a three-factor model with items loading onto their pre-assigned
constructs.
Methods
For this phase, 472 participants (273 male, 198 female, 1 other) currently residing in the United States were recruited using Amazon’s MTurk marketplace. The mean age of participants was 34 years of age (SD = 10.18) with 77.1% identifying themselves as Caucasian, 7.4% as
1N
Asian and/or Asian American, 7% as Hispanic, 6.6% as African and/or African American, and 1.6% as other. In order to be eligible for this study, participants needed to be currently 1) employed and 2) completing a team project. Participants held a variety of different types of positions with 87.5% holding full time positions, 9.7% holding a part time position, 1.1% working as a contingent worker, and 1.7% as a student.
Like study 1, an online survey software tool was used for data collection. Upon providing consent, participants completed a survey containing basic demographic measures assessing current employment status and how long they have worked with the current team. Participants were asked to describe the team they work in (e.g., size, nature of the project). Those who did not meet the criteria for inclusion were allowed to continue, but their data were excluded from the study. Afterwards, participants were asked to think about one of their current teammates, and rate that team member using the remaining 76 items from the TINS. Participants were then compensated $3.00 for study completion.
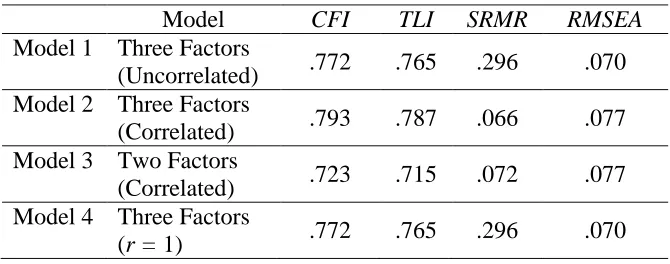
Results
to one. Initial results yielded inadequate fit for all four models (see Table 6) indicating that additional scale refinement was necessary.
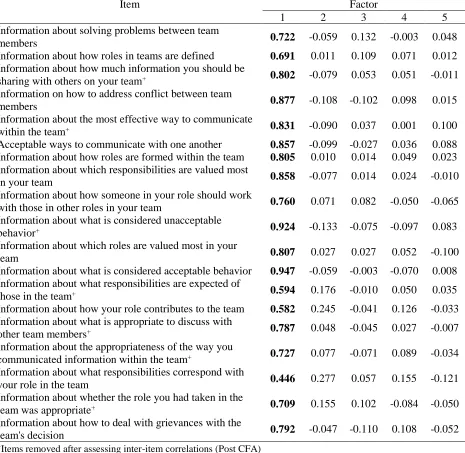
Because factor loadings for all items were above .40, a follow-up EFA using parallel analysis was conducted to further prune the scale. Parallel analysis is a factor extraction process where random data sets are generated, and the scree plot of the random data sets are compared with the scree plots of the real data matrix. The point at which the two plots intersect provides a heuristic for the number of factors retained (Reise, 2000). Results (see Figure 1) indicated that four factors should be retained, and follow-up review yielded three clear factors corresponding to the advice, normative, and referent network dimensions. The fourth factor was difficult to
interpret thus items loading onto the factor were dropped. Of the remaining 76 items, 21 items were dropped leaving 14 advice network, 19 normative network, and 19 referent network items (see Tables 7 - 9).
To further refine the scale and address potential issues of survey fatigue, item correlations were evaluated, and items that were strongly correlated were flagged for additional review. After these items were identified, those that strongly correlated with multiple items were removed, and those that shared similar wording were compared for clarity with the item of lesser clarity being subsequently removed. This process yielded a final scale (see Table 10) consisting of 8 advice network (α = .877), 12 normative network (α = .946), and 12 referent network (α = .943) items.
Follow-up CFAs were then conducted on the unused holdout sample (N = 228). Results supported hypothesis 1 with the correlated, three-factor model χ2 (df = 461, N =228) = 802.40, p
< .01 yielding a significantly better fit (CFI =.916, TLI = .909, SRMR = .058, and RMSEA
two-factor model Δ χ2 (Δ df = 2, N =228) = 369.614, p <.01, and the three-factor model with factor correlations constrained to one Δ χ2 (Δ df = 3, N =228) = 758.208, p <.01. In addition, the three factors were strongly interrelated with the advice factor significantly being significantly
correlated with both the normative (r = .53, p < .01) and referent factor (r = .50, p < .01), and the normative factor being significantly correlated with the referent factor (r = .78, p < .01).
Phase 3 – Convergent and Discriminant Analysis
With the psychometric properties of the scale evaluated, the final step is to assess the nomological network of the scale (Hinkin, 1998). This was accomplished by testing the TINS for 1) convergent validity evidence, 2) discriminant validity evidence, 3) criterion validity evidence, and 4) incremental validity evidence (Hinkin, 1998). The present study assessed the validity of the TINS by studying its network density, a commonly used network construct in teams research (Carpenter et al., 2012). Density is the degree of saturation of a social network and refers to the average strength of ties in a given social network (Brass, 2012; Carpenter et al., 2012; Kilduff & Brass, 2010; Wasserman & Faust, 1994). Network density is calculated by adding the values of the ties (i.e., relationships) and dividing this number by the possible number of ties where the possible number of ties represents the total number of paired comparisons possible in the network as seen below:
Network Density2 = ∑(Tie Values) N(N-1)/2
In the context of the TINS, high density represents a high degree of information exchange amongst team members.
Convergent Validity Evidence. Because they theoretically capture the same construct, the network constructs of the TINS should correlate with existing social network measures. The current study focuses on the degree of information exchange between team members, known as network density. In this context, a dense social network implies that team members are actively sharing information whereas a social network lacking density is indicative of a team where little or no information is being shared. For the current study, the density indicated by the TINS should correlate with the density indicated by existing social network measures. Hypotheses 2-4 are as follows:
H2: The TINS-determined advice network density is positively associated with density as
indicated by a single-item measure of advice networks.
H3: The TINS-determined normative network density is positively associated with density as
indicated by a single-item measure of normative networks.
H4: The TINS-determined referent network density is positively associated with density as
indicated by a single-item measure of referent networks.
Discriminant Validity Evidence. In establishing discriminant validity, the density of each social network should demonstrate low correlations with dissimilar measures (Hinkin, 1998). For instance, the TINS-determined advice network density should relate to the density score calculated from a single-item advice network measure more than the network density from a single-item normative or referent network measure. Given the inappropriateness of
RQ1: Do single-item measures of (RQ1a) normative networks and (RQ1b) referent networks
predict a TINS-determined advice network density score?
RQ2: Do single-item measure of (RQ2a) advice networks and (RQ2b) referent networks predict
a TINS-determined normative network density score?
RQ3: Do single-item measures of (RQ3a) advice networks and (RQ3b) normative networks
predict a TINS-determined referent network density score?
Criterion Validity Evidence. In evaluating the criterion validity of the TINS, the density of
the social networks indicated by the TINS should predict specific outcome variables as suggested by existing theory. Dense advice networks are indicative of a high degree of task information exchange leading to a shared perception of the task as a whole (Marks et al., 2001). Thus, teams with dense advice networks are more likely to agree on task objectives. Dense normative
networks indicate team members are actively discussing norm boundaries, which increase one’s understanding of expected behaviors thus leading to higher role clarity (Whitaker, Dahling, & Levy, 2007). Finally, dense referent networks suggest that team-member information is being exchanged, allowing each team member to better understand the capabilities of one another (Salas et al., 2005). In the initial stages of team formation, shared knowledge of team member capabilities can lead to lower levels of process conflict, or conflict pertaining to how a task is completed (Jehn & Mannix, 2001; Salas et al., 2005). Hypotheses 5 through 7 are as follows:
H5: A TINS-determined advice network density is positively associated with task objective
agreement.
H6: A TINS-determined normative network density is positively associated with role clarity in
H7: A TINS-determined referent network density is negatively associated with process conflict in
teams.
Incremental Validity. One criticism the current study makes of existing single-item measures of social networks is their potential inability to adequately capture complex constructs. The TINS attempts to improve upon existing measures by addressing this issue, creating a more accurate measure. To assess this, the study tested whether the TINS explains variance in
conceptually relevant outcomes above and beyond that which is explained by previously-established single-item, social network measures. Hypotheses 8 through 10 are as follows:
H8: TINS-determined advice network density scores will explain significant additional variance
in task objective agreement beyond that explained by a single-item advice network density score.
H9: TINS-determined normative network density scores will explain significant additional
variance in role clarity beyond that explained by a single-item normative network density score.
H10: TINS-determined referent network density scores will explain significant additional
variance in procedural conflict beyond that explained by a single-item referent network density
score,
Methods
Sample and Design. The present study consisted of 39 teams with each team comprised of three to five students, totaling 147 subjects. Participants were undergraduate students from multiple psychology classes across two large, Southern U.S. universities who were completing a semester-long, group project. For the 111 participants (22 male, 89 female) who provided demographic data3, the mean age was 20.72 years of age (SD = 2.68) with 75% identifying
themselves as Caucasian, 11.6% as Asian and/or Asian American, 3.6% as Hispanic, 2.7% as African and/or African American, 1.8% as Native American and/or Alaskan Native, and 5.4% as other. Data were collected during three time points spread over the course of the semester.
Like the previous phases, the measures for phase 3 were completed online through a web-based survey software. Because of the importance of time in establishing causality between team interactions and team outcomes (Mathieu & Gilson, 2012), data were collected at three time points, all of which occurred during the team’s planning phase and coincided with an explicit deadline or milestone in the planning phase. The first wave of data collection took place two to three weeks into the planning phase. The second took place between one and a half to three weeks after time 1, and the final time point took place at the end of the planning phase (one and a half to three weeks after time 2). Existing research has suggested that establishing phases during teamwork forces specific team interactions to occur (Gersick, 1988). In the current study, setting deadlines for the planning phase forced teams to engage in planning-related behaviors within the allotted time (Gersick, 1988).
Participants were then informed that a follow-up survey would be administered at the next deadline in the planning phase.
At time 2, participants were reminded of the purpose of the study, and asked again to complete the social network measures, and measures of task objective prioritization, role clarity, and procedural conflict. Participants were then informed that the final survey will be
administered when the next deadline arrives. Time 3 was similar to time 2 in that participants were reminded of the purpose of the study, and asked to complete the social network measures, and the task objective prioritization, role clarity, and procedural conflict measures. Upon completion of the time 3 survey, participants were debriefed. Between the three time points, a total of 384 participants completed the survey for at least one time point. Participants’ responses
were included in the final analysis if 80% or more of their team completed the survey for at least two time points. A total of 147 participants (39 teams) were included in the final analysis for Phase 3.
Measures
Advice Network. Advice networks were assessed using two measures. The first is a single-item measure adapted from Balkundi and Harrison (2006): “How frequently do you go to this team member for project-related advice?” The second measure is the TINS advice network subscale developed in this study. Both measures presented participants with a list of their team members’ names and ask them to provide ratings for each team member using a five-point Likert scale (1= Never, 2 = Rarely, 3 = Occasionally, 4 = Moderately, 5 = A Great Deal).
your team values and expects, how frequently, in general, have you gone to this team member?” Normative networks were also measured using the TINS normative network subscale developed in this study. Both measures required participants to use a five-point Likert scale (1= Never, 2 =
Rarely, 3 = Occasionally, 4 = Moderately, 5 = A Great Deal) to rate each of their teammates.
Referent Network. As with the advice and normative networks, referent networks were assessed using a single item measure and the TINS. The single item scale was adapted from Morrison’s (1993): “To determine what is expected of you in this project, how frequently, in
general, have you gone to this team member?” Both measures required participant to use a five-point Likert scale (1= Never, 2 = Rarely, 3 = Occasionally, 4 = Moderately, 5 = A Great Deal) to rate each of their teammates.
Task Objective Agreement. Task objective agreement is a team level variable that was calculated using a measure similar to the one utilized by Resick et al. (2010). Participants were presented a randomized list of steps that need to take place in order to complete their team project. Using a five-point Likert-type scale (1=Not a priority, 5 = High priority), participants rated each step on the list. Agreement in the prioritization of task objectives was calculated using rwg.
Role Clarity. Role clarity in teams was measured using five items developed by Rizzo, House, and Lirtzman (1970), which used a five-point Likert-type scale (1 = Strongly Disagree, 5
= Strongly Agree). A sample item is “I know what my responsibilities are.” A scale score was
equal to .70 indicating sufficient agreement to aggregate to the group level (LeBreton & Santer, 2008). Group-level scores were calculated by averaging individual scale scores.
Process Conflict. Team level process conflict was assessed using three items from Jehn and Mannix’s (2001) group conflict scale. A sample item is “How often are there disagreements about who should do what in your work group?” Participants rated each item using a 1 (Not at
All) to 5 (Frequently) Likert-type scale. As with role clarity, appropriateness of aggregation was gauged by calculating the level of agreement (rwg ) in process conflict with values of .70 or greater indicating sufficient agreement to aggregate to the group level. Individual scale scores were averaged to create a group-level score.
Results
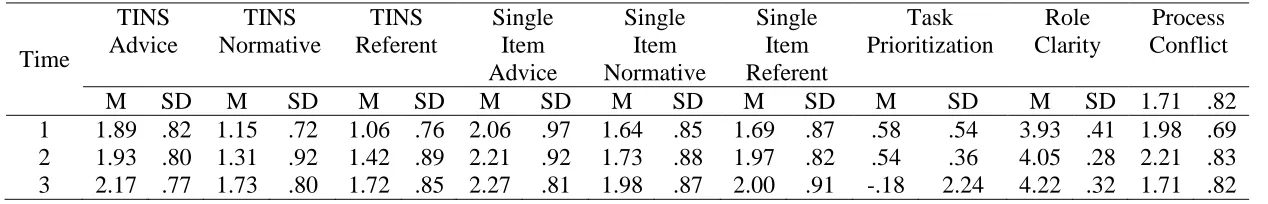
All hypotheses in phase 3 were conceptualized and tested at the team level of analysis. Using SPSS 24, ratings on the TINS were first averaged across items within dimension for each team member such that each team member received three scores (one for each type of social network) from each team member. UCInet/NetDraw, a program used to analyze social networks, was then used to determine the density of each social network (ranging from 0 to 4) by
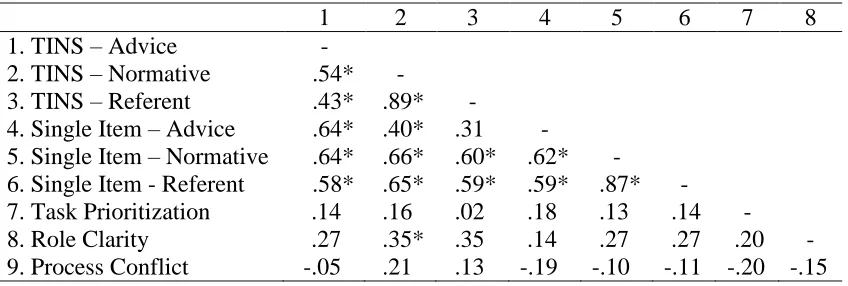
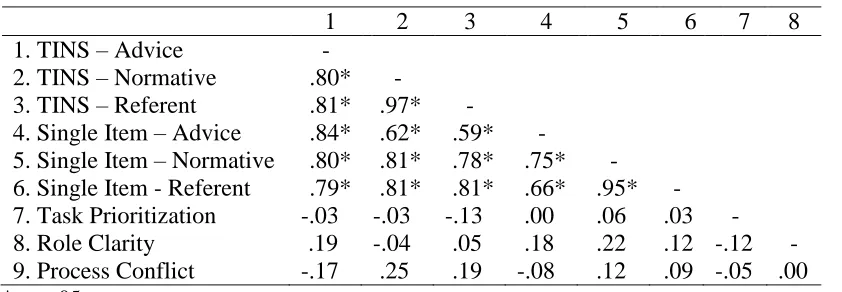
calculating the average strength of ties within the network (Borgatti, Everett, & Freeman, 2002). Hypothesis testing was conducted with multilevel modeling using SPSS 24 software. Descriptive statistics and correlations for the social network measures and outcome variables can be found in Tables 10 through 14.
TINS-determined advice, normative, and referent network density (Raudenbush & Bryk, 2002). This was necessary to establish whether a sufficient portion of the variability in the outcome variable is found between teams to detect cross-level interactions, and justify follow-up analyses. Results indicated that there are significant between-team differences in all three TINS-determined network densities with 53% of TINS-determined advice network density (τ00 = .35, z = 3.06, p = .002), 57% of variability in normative network density (τ00 = .42, z = 3.27, p = .001), and 55% of variability in referent network density (τ00 = .42, z = 3.24, p = .001) being between groups.
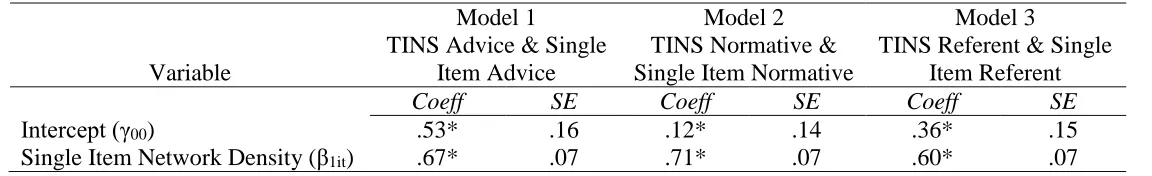
A series of one-way ANCOVAs with random effects (Appendix C) were conducted to test hypotheses 2 through 4. This was accomplished by adding the single-item network density scale as a predictor (i.e., covariate) to their corresponding fully unconditional models. Results (see Table 16) from these analyses indicate that there is a significant, positive relationship between the TINS-determined advice network density (γ10 = .67, t = 9.97, p < .001), normative network density (γ10 = .71, t = 10.75, p < .001), and referent network density (γ10 = .60, t = 8.27,
p < .001) with their respective measures of single-item network density. Taken together, these results provide support for hypotheses 2 through 4, indicating that convergent validity was established for all three TINS measures.
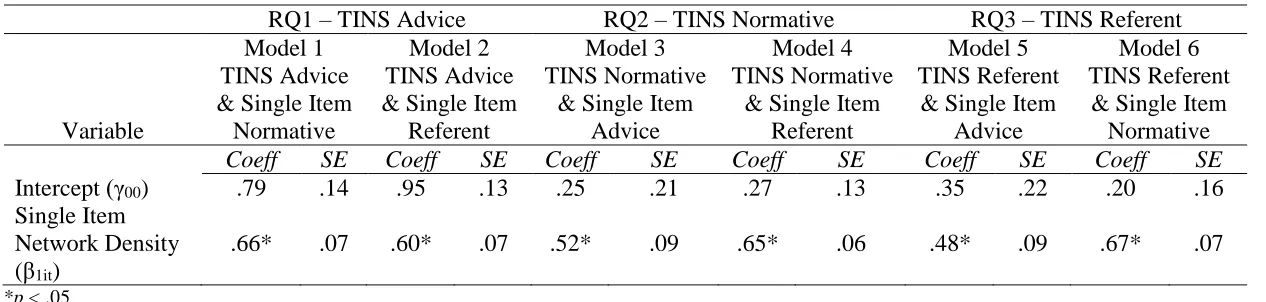
significant, positive relationship between the TINS-determined normative network density score and both the single-item referent network density score (γ10 = .65, t = 7.03, p < .001) and advice network density score (γ10 = .52, t = 6.06, p < .001). Finally, the results also indicated that the
TINS-determined referent network density score is positively linked to both the single-item advice network (γ10 = .48, t = 5.25, p < .001) and normative network density score (γ10 = .67, t = 8.98, p < .001). Overall, the results suggest that the different TINS-determined network density scores are related to dissimilar network density scores suggesting a lack of discriminant validity evidence (i.e., RQ’s 1 through 3).
Criterion Validity. Before testing hypotheses 5 through 7, a series of preliminary analyses were conducted to determine whether significant variability within/between groups exists in task objective agreement, role clarity, and process conflict (Raudenbush & Bryk, 2002). Results from these fully unconditional models yielded significant variability between teams. Of the total variance in role clarity, 47% (τ00 = .06, z = 2.92, p = .004) was between teams. For process conflict, 46% of variance (τ00 = .29, z = 2.92, p = .003) was between teams. However, results indicated insufficient variability between teams in task objective agreement (τ00 = .24, z = .263, p = .263) where only 13% of the variance was between teams. This means that there is not enough variability between teams to detect cross-level effects. To demonstrate task
prioritization’s pattern of findings, this variable was included in subsequent analyses. However,
these analyses should be viewed with caution due to the lack of between-team variability. Results from a series of one-way ANCOVAs with random effects (Appendix E)
Hypothesis 5 and 7 were unsupported however. Results yielded a non-significant relationship between the TINS-determined advice network density score and team-level agreement in task objective agreement (γ10 = -.04, t = -.20, p = .839). The TINS-determined referent network density score was a significant, but an unexpectedly positive predictor of process conflict in teams (γ10 = .22, t = 2.34, p = .021). Taken together, mixed evidence was found for criterion
validity.
Incremental Validity. A series of one-way ANCOVAs with random effects (Appendix F) were conducted where task objective agreement, role clarity, and process conflict were first regressed onto their respective single-item network density measures (step 1). A subsequent one-way ANCOVA with random effects saw the TINS-determined density of advice, normative, and referent networks added to their respective model (step 2). Incremental validity was assessed by evaluating whether or not there was a significant change in -2LL deviation statistics between Step 1 and Step 2 using a Δχ2 test (Singer & Willett, 2003). Results (see Table 18) found that
neither the TINS-determined advice, Δ χ2 (Δ df = 1) = .068, and normative, Δ χ2 (Δ df = 1)= 1.79, density measures explained significant variability beyond their respective single-item density measures. The inclusion of the TINS-determined referent network density score yielded significant improvement in validity, Δ χ2 (Δ df = 1) = 6.19). However, because the relationship between the TINS-determined referent network density and process conflict were not in the expected direction, hypothesis 10 was not supported. In summary, the TINS did not explain additional variance above and beyond the single-item measures.
Following the Hinkin (1998) approach to item development, the current study is the first to use a classical test theory approach to 1) test the underlying factor structure of information types shared in teams and 2) develop three social network measures that can capture information flow within teams. This was accomplished by first using a systematic approach to item
development where items were generated based on construct definitions, and subsequently evaluated by SMEs for quality and consistency with definitions. This approach resulted in a multi-item scale for each network type which could be used to assess the factor structure of information types in team interactions. Results from exploratory and confirmatory factor analyses suggest that information sharing in teams can be categorized into three types of information: advice, normative, and referent. Further analyses from testing the nomological network of the TINS suggested strong interrelationships among the three TINS factors. These findings corroborate existing theories in teams’ research, and also sheds light on the nature of
information sharing in organizations as a whole.
Overall, the TINS-determined measure did not consistently perform as expected. The TINS demonstrated convergent validity, but yielded little discriminant, criterion, and incremental validity. The single-item density scores positively predicted their corresponding
TINS-determined network density scores thus providing evidence for convergent validity. With respect to discriminant validity, the TINS-determined network scores significantly related to
theoretically dissimilar single-item network measures. While this suggests a lack of discriminant validity, results from phase 2 already hinted at the possibility of a strong interrelationship
In terms of criterion validity, only the TINS-determined normative network density score significantly predicting its hypothesized outcome variable, role clarity. Results found that
sharing project-related information is not significantly related to task objective agreement which stands in contrast to existing research supporting the idea that discussion facilitates the
convergence of mental models in teams. It is possible that the classroom setting of the team task in the current study did not require enough collaboration among team members for this effect to emerge, or perhaps additional time was required for convergence of mental models to occur. Future research could replicate the study in an employment setting where more interdependence may be required.
The TINS-determined referent network density score significantly predicted process conflict within teams, however, in a positive rather than the expected negative direction. This indicates that sharing team member information is associated with higher levels of process conflict within teams. While it is possible that sharing information about team members can reduce conflict in teams by increasing awareness of each team member’s capabilities, it is also
plausible that team member information is being shared because of rising levels of conflict in teams (Greer, Jehn, & Mannix, 2008). Future research could expand upon the current study and include the measurement of variables such as the use of conflict resolution techniques in team interactions.
single-item social network measures to bolster the strength of inferences drawn from social network studies, and to allow for future assessment of the factor structure of the three information types. Limitations and Future Research
As with any research, the present study possesses some limitations, especially in the third phase. First, there was variability in the length of time between data collection points as a result of differences both between and within each undergraduate class, which can potentially limit the amount of time for certain types of team interactions to occur or for individual mental models to converge. In addition, not all teams possessed sufficient agreement in the outcome variables to justify aggregation. This could be a result of disagreement or careless responding. Furthermore, the sample consisted of students (undergraduate and graduate), and the size of the current study is less than 50, which may affect the power needed to find significant results, especially when testing the TINS for criterion related and incremental validity. Despite these limitations, the present study is the first to test the underlying factor structure of the different types of
information exchanged between team members. In addition, the study is the first to empirically test the validity of a social network scale in a longitudinal setting.
from email exchanges in addition to the TINS can help researchers better understand why frequent communication between teammates about team member information is potentially linked with higher levels of process conflict. Furthermore, the measure requires rating each team member on the scale, the scale can become unwieldy with large teams. As such, future research could find ways to further refine the scale so that it is shorter and more manageable.
Conclusion
Studying social networks within teams is important for understanding team dynamics and team performance. Being able to capture intra-team communication allows researchers to study how dyadic interactions affect team-level constructs. The TINS was created with the intent of studying team interactions, and the three factor structure emerged as expected. While this study found mixed results regarding its ability to replicate existing findings, it provides a useful springboard for additional research to further refine and test the scale’s properties, ideally in a workplace setting with established teams.4
References
Ashworth, M. J., & Carey, K. M. (2006). Who you know vs. what you know: The impact of social position and knowledge on team performance. Journal of Mathematical Sociology,
30, 43-75. doi:10.1080/00222500500323101
Baldwin, T. T., Bedell, M. D., & Johnson, J. L. (1997). The social fabric of a team-based M.B.A. program: Network effects on student satisfaction and performance. Academy of
Management Journal, 40, 1369-1397. doi:10.2307/257037
Balkundi, P., & Harrison, D. A. (2006). Ties, leaders, and time in teams: Strong inference about network structure's effects on team viability and performance. Academy of
Management Journal, 49, 49-68. doi:10.5465/AMJ.2006.20785500
Bandalos, D. L., & Boehm-Kaufman, M. R. (2009). Four common misconceptions in exploratory factor analysis. In C. E. Lance, R. J. Vandenberg (Eds.), Statistical and methodological myths and urban legends: Doctrine, verity and fable in the organizational and social
sciences (pp. 61-87). New York, NY, US: Routledge/Taylor & Francis Group.
Borgatti, S. P., & Cross, R. (2003). A relational view of information seeking and learning in social networks. Management Science, 49(4), 432-445.
Borgatti, S.P., Everett, M.G. and Freeman, L.C. 2002. Ucinet for Windows: Software for Social Network Analysis. Harvard, MA: Analytic Technologies.
Borgatti, S. P., & Foster, P. C. (2003). The network paradigm in organizational research: A review and typology. Journal of Management, 29, 991-1013.
doi:10.1016/S0149-2063(03)00087-4
Kozlowski, S. J. Kozlowski (Eds.), The Oxford handbook of organizational psychology,
Vol. 1 (pp. 667-695). New York, NY, US: Oxford University Press.
Brass, D. J., Galaskiewicz, J., Greve, H. R., & Wenpin, T. (2004). Taking stock of networks and organizations: a multilevel perspective. Academy of Management Journal, 47, 795-817. doi:10.2307/20159624
Buhrmester, M., Kwang, T., & Gosling, S. D. (2011). Amazon's Mechanical Turk: A new source of inexpensive, yet high-quality, data?. Perspectives on Psychological Science,
6, 3-5. doi:10.1177/1745691610393980
Campion, M. A., Medsker, G. J., & Higgs, A. C. (1993). Relations between work group characteristics and effectiveness: Implications for designing effective work groups.
Personnel Psychology, 46, 823-850. doi:10.1111/j.1744-6570.1993.tb01571.x
Cannon-Bowers, J. A., Salas, E., & Converse, S. (1993). Shared mental models in expert team decision making. In N. J. Castellan, N. J. Castellan (Eds.), Individual and group decision
making: Currentissues (pp. 221-246). Hillsdale, NJ, England: Lawrence Erlbaum
Associates, Inc.
Carpenter, M. A., Li, M., & Jiang, H. (2012). Social network research in organizational contexts: A systematic review of methodological issues and choices. Journal of Management, 38, 1328-1361. doi:10.1177/0149206312440119
Cortina, J. M. (1993). What is coefficient alpha? An examination of theory and applications.
Journal of Applied Psychology, 78, 98-104. doi:10.1037/0021-9010.78.1.98
100-120.
Fabrigar, L. R., Wegener, D. T., MacCallum, R. C., & Strahan, E. J. (1999). Evaluating the use of exploratory factor analysis in psychological research. Psychological Methods, 4, 272- 299. doi:10.1037/1082-989X.4.3.272
Gaggioli, A., Mazzoni, E., Milani, L., & Riva, G. (2015). The creative link: Investigating the relationship between social network indices, creative performance and flow in blended teams. Computers in Human Behavior, 42, 157-166. doi:10.1016/j.chb.2013.12.003 Gersick, C. J. (1988). Time and transition in work teams: Toward a new model of group
development. Academy of Management Journal, 31, 9-41. doi:10.2307/256496 Gibson, C. B., & Gibbs, J. L. (2006). Unpacking the concept of virtuality: The effects of
geographic dispersion, electronic dependence, dynamic structure, and national diversity on team innovation. Administrative Science Quarterly, 51(3), 451-495.
Graham, C. R. (2003). A model of norm development for computer-mediated teamwork.
Small Group Research, 34, 322-352. doi:10.1177/1046496403034003003
Greer, L. L., Jehn, K. A., & Mannix, E. A. (2008). Conflict transformation: A longitudinal investigation of the relationships between different types of intragroup conflict and the moderating role of conflict resolution. Small Group Research, 39, 278-302.
doi:10.1177/1046496408317793
Guzzo, R. A., & Dickson, M. W. (1996). Teams in organizations: Recent research on performance and effectiveness. Annual Review of Psychology, 47, 307-338. doi:10.1146/annurev.psych.47.1.307
literature. Journal of Engineering & Technology Management, 27, 74-109. doi:10.1016/j.jengtecman.2010.03.005
Henttonen, K., Janhonen, M., Johanson, J. E., & Puumalainen, K. (2010). The demographic antecedents and performance consequences of the social-network structure in work teams. Team Performance Management: An International Journal, 16(7/8), 388-412. Hinkin, T. R. (1998). A brief tutorial on the development of measures for use in survey
questionnaires. Organizational Research Methods, 1, 104-121. doi: 10.1177/109442819800100106
Hinkin, T. R., & Tracey, J. B. (1999). An analysis of variance approach to content validation.
Organizational Research Methods, 2, 175-186. doi:10.1177/109442819922004
Hopp, C., & Zenk, L. (2012). Collaborative team networks and implications for strategic HRM.
International Journal of Human Resource Management, 23, 2975-2994.
doi:10.1080/09585192.2011.637063
Hu, L., & Bentler, P. M. (1999). Cutoff criteria for fit indexes in covariance structure analysis: Conventional criteria versus new alternatives. Structural Equation Modeling, 6, 1-55. doi:10.1080/10705519909540118
Jehn, K. A., & Mannix, E. A. (2001). The dynamic nature of conflict: A longitudinal study of intragroup conflict and group performance. Academy of Management Journal, 44, 238 251. doi:10.2307/3069453
Katzenbach, J. R. & Smith, D. K. (1993). The discipline of teams. Harvard Business Review, 83
(8), 162 – 171.
debates. The Academy of Management Annals, 4(1), 317-357.
Kirkman, B. L., Gibson, C. B., & Kim, K. (2012). Across borders and technologies:
Advancements in virtual teams research. In S. J. Kozlowski (Ed.), The Oxford handbook
of Organizational Psychology, Vol. 2 (pp. 789-858). New York, NY, US: Oxford
University Press.
Krackhardt, D. (1987). Cognitive social structures. Social Networks, 9, 109-134. doi:10.1016/0378-8733(87)90009-8
Lance, C. E., & Vandenberg, R. J. (2002). Confirmatory factor analysis. In F. Drasgow, N. Schmitt, F. Drasgow, N. Schmitt (Eds.), Measuring and analyzing behavior in
organizations: Advances in measurement and data analysis (pp. 221-254). San Francisco,
CA: Jossey-Bass.
Lawshe, C. H. (1975). A quantitative approach to content validity. Personnel Psychology, 28(4), 563-575.
LeBreton, J. M., & Senter, J. L. (2008). Answers to 20 questions about interrater reliability and interrater agreement. Organizational Research Methods, 11, 815-852.
doi:10.1177/1094428106296642
Long, J. S. (1983). Confirmatory factor analysis: A preface to LISREL (quantitative applications
in the social sciences). Newbury Park, CA: Sage Publications, Inc.
Maas, C. M., & Hox, J. J. (2005). Sufficient sample sizes for multilevel modeling. Methodology:
European Journal Of Research Methods For The Behavioral And Social Sciences, 1, 86
92. doi:10.1027/1614-2241.1.3.86
of mental model convergence: Implications for distributed teams interacting in electronic collaboration spaces. Human Factors, 52, 264-281. doi:10.1177/0018720810370458 Marks, M. A., Mathieu, J. E., & Zaccaro, S. J. (2001). A temporally based framework and
taxonomy of team processes. Academy of Management Review, 26, 356-376. doi:10.5465/AMR.2001.4845785
Mathieu, J. E., Heffner, T. S., Goodwin, G. F., Cannon-Bowers, J. A., & Salas, E. (2005). Scaling the quality of teammates' mental models: Equifinality and normative comparisons. Journal of Organizational Behavior, 26, 37-56. doi:10.1002/job.296 Mathieu, J. E., & Gilson, L. L. (2012). Criteria issues and team effectiveness. In S. J. Kozlowski
(Ed.), The Oxford handbook of organizational psychology, Vol. 2 (pp. 910-930). New York, NY, US: Oxford University Press.
Mathieu, J. E., Goodwin, G. F., Heffner, T. S., Salas, E., & Cannon-Bowers, J. A. (2000). The influence of shared mental models on team process and performance. Journal of Applied
Psychology, 85(2), 273-283.
McGrath, J. E., Arrow, H., & Berdahl, J. L. (2000). The study of groups: Past, present, and future. Personality and Social Psychology Review, 4, 95-105.
doi:10.1207/S15327957PSPR0401_8
Miller, V. D., & Jablin, F. M. (1991). Information seeking during organizational entry:
Influences, tactics, and a model of the process. Academy of Management Review, 16(1), 92-120.
9010.78.2.173
Morrison, E. W. (2002). Newcomers' relationships: The role of social network ties during socialization. Academy of Management Journal, 45, 1149-1160. doi:10.2307/3069430 Nunnally, J. C. (1978). Psychometric theory. New York, NY, US: McGraw-Hill.
Parise, S., & Rollag, K. (2010). Emergent network structure and initial group performance: The moderating role of pre-existing relationships. Journal of Organizational Behavior, 31, 877-897. doi:10.1002/job.656
Perry-Smith, J. E. (2014). Social network ties beyond nonredundancy: An experimental
investigation of the effect of knowledge content and tie strength on creativity. Journal Of
Applied Psychology, 99, 831-846. doi:10.1037/a0036385
Phelps, C., Heidl, R., & Wadhwa, A. (2012). Knowledge, networks, and knowledge networks: A review and research agenda. Journal of Management, 38, 1115-1166.
doi:10.1177/0149206311432640
Raudenbush, S. W., & Bryk, A. S. (2002). Hierarchical linear models: Applications and data
analysis methods. Thousand Oaks, CA, US: Sage Publications, Inc.
Reagans, R., & Zuckerman, E. W. (2001). Networks, diversity, and productivity: The social capital of corporate R&D teams. Organization Science, 12(4), 502-517.
Reise, S. P., Waller, N. G., & Comrey, A. L. (2000). Factor analysis and scale revision.
Psychological Assessment, 12, 287-297. doi:10.1037/1040-3590.12.3.287
Resick, C. J., Murase, T., Bedwell, W. L., Sanz, E., Jiménez, M., & DeChurch, L. A. (2010). Mental model metrics and team adaptability: A multi-facet multi-method examination.
Rizzo, J. R., House, R. J., & Lirtzman, S. I. (1970). Role conflict and ambiguity in complex organizations. Administrative Science Quarterly, 15, 150-163. doi:10.2307/2391486 Rulke, D. L., & Galaskiewicz, J. (2000). Distribution of knowledge, group network structure,
and group performance. Management Science, 46(5), 612-625.
Salas, E., Bowers, C. A., & Cannon-Bowers, J. A. (1995). Military team research: 10 years of progress. Military Psychology, 7, 55-75. doi:10.1207/s15327876mp0702_2
Salas, E., Sims, D. E., & Burke, C. S. (2005). Is there a 'Big Five' in Teamwork?. Small Group
Research, 36, 555-599. doi:10.1177/1046496405277134
Scherbaum, C. A., & Ferreter, J. M. (2009). Estimating statistical power and required sample sizes for organizational research using multilevel modeling. Organizational Research
Methods, 12, 347-367. doi:10.1177/1094428107308906
Singer, J. D., & Willett, J. B. (2003). Applied longitudinal data analysis: Modeling change and
event occurrence. New York, NY, US: Oxford University Press.
Sparrowe, R. T., Liden, R. C., Wayne, S. J., & Kraimer, M. L. (2001). Social networks and the performance of individuals and groups. Academy of Management Journal, 44, 316-325. doi:10.2307/3069458
Tannenbaum, S. I., Mathieu, J. E., Salas, E., & Cohen, D. (2012). Teams are changing: Are research and practice evolving fast enough?. Industrial and Organizational Psychology:
Perspectives On Science And Practice, 5, 2-24. doi:10.1111/j.1754-9434.2011.01396.x
Tourangeau, R., Rips, L. J., & Rasinski, K. (2000). The psychology of survey response. New York, NY, US: Cambridge University Press.
configuration effects on team performance. Behaviour & Information Technology, 29, 363-375. doi:10.1080/01449291003752922
Wasserman, S., & Faust, K. (1994). Social network analysis: Methods and applications. New York: Cambridge University Press.
Whitaker, B. G., Dahling, J. J., & Levy, P. (2007). The development of a feedback environment and role clarity model of job performance. Journal of Management, 33, 570-591.
doi:10.1177/0149206306297581
Wise, S. (2014). Can a team have too much cohesion? The dark side to network density.
European Management Journal, 32, doi:10.1016/j.emj.2013.12.005
Table 1.
Example of Social Network Study on Teams that Use Mismatched Measures
Social Network Type of Interest
Social Network Type Measured
Operationalization Rating Scale/Method Citation
Knowledge Advice "To who do you often turn for advice in work-related matters"
Rating Scale
(0 = No; 1 = Yes) Henttonen, Johanson, Janhonen (2013) Knowledge Information “Over the past semester, I
frequently interacted with this person to exchange school-related information”
Rating Scale (1 = Strongly Disagree;
7 = Strongly Agree)
Parise & Rollag (2010)
Knowledge and Friendship Communication Number of emails Qualitative – Email Logs
Wise (2014) Knowledge Communication “How much [team member]
had communicated with each of their team members”
Rating Scale (1 = Not at All; 5 = A
Lot)
Rulke & Galaskiewicz (2000) Information Knowledge “Please indicate how often
you have turned to this person for information or knowledge on work-related topics in the past 3 months”
Rating Scale (1 = Never; 5 = Very
frequently)
Borgatti & Cross (2003)
Information Communication Frequency of reciprocated communication
Qualitative – Communication Logs
Table 2.
Types of Social Networks and Corresponding Type of Information Exchanged
Type of Network Information Type Exchanged in Social Network
Examples of Information Exchanged
Advice Task Information Task procedures Possible contingencies Possible strategies Likely scenarios
Environmental constraints Normative Normative
Information
Roles/responsibilities Interaction patterns Information sources Role interdependencies Information flow Referent Team Information Teammates’ knowledge
Teammates’ skills Teammates’ abilities Teammates’ tendencies
Note. Adapted from "Shared mental models in expert team decision making," by J. A. Cannon-Bowers, E.
Table 3
TINS – Advice Initial Items and Content Validity Ratio (CVR)
Item CVR
Clarification on the requirements of the project 1
Information on the project's progression 1
Information on how to complete the project more efficiently 1
Strategies for overcoming obstacles in this project 1
Information about alternative plans for project completion 1 Information on how a certain kind of problem was solved in the past* 0 Information needed for acquiring resources to complete this project 1
Information needed to complete this project 1
Resources needed to complete this project 1
Advice on how to complete a task with limited resources* 0.5
Advice solving a project-related problem 1
Information about new ways to go about tasks for this project 1
Plans for completing the project 1
Information on how to proceed in the project 1
Information about current difficulties in completing this project 1 Information on how to proceed with a task relating to the project 1
Information on alternative plans to solve a problem 1
Information about the project requirements 1
Clarification about your role in this project* -0.5
Advice on how to complete a certain task 1
Information about the steps necessary for project completion 1 Strategies for task completion given your current resources 1
Clarification about deadlines for this project 1
Information on how a certain kind of task was completed in the past* 0
Information about resource constraints 1
Information about how different parts of the project are related 1
A new perspective on a problem* 0
Advice for how to complete a task quickly* 0
Advice on alternative ways to complete a task* 0.5
Information on how to overcome an obstacle with this project 1 Information on how to acquire resources needed to complete this project 1 Information about meeting deadlines for this project 1
Input on solving problems with the project* 0.5
Information about potential difficulties in completing this project 1 Information needed to complete a part of this project 1
Strategies to deal with project-related problems 1
Information about resources needed to complete this project 1
Information about the scope of the project 1
Reassurance in regards to this project* 0.5
Information about your role in the team project* -1
Note. Items were evaluated using Lawshe’s (1975) Content Validation Ratio (CVR), which is and indicator of how consistent an item is with the it’s corresponding item definition.
Table 4
TINS – Normative Initial Items and Content Validity Ratio (CVR)
Item CVR
Information about how to better communicate with other team members* 0.5
Information about how tasks are assigned 0
Information about what other situations solving problems in a certain way would be appropriate.* -1
Information about solving problems between team members 1
Previous team experiences where breakdowns in coordination occurred* 0
Information about acceptable places to gather information.* 0.5
Information about how roles in teams are assigned 1
Information about how roles in teams are defined 1
What is considered an acceptable source of information* 0.5
Information about how much information you should be sharing with others on your team 1
Information about where information has been gathered in past projects* -0.5
Information about the appropriateness of the source of the information you gathered* 0.5
Information on how to address conflict between team members 1
Information about the most effective way to communicate within the team 1
Acceptable ways to communicate with one another 1
Information about how decisions have been made in the past* 0.5
Information about what other situations communicating in a certain way would be appropriate* 0.5
Information about what responsibilities correspond with others' roles in the team* 0.5
Information about how roles are formed within the team 1
Information about a potential problem between team members* -1
Information about who he/she usually communicates with on the team* -0.5
Information about how tasks will be assigned* 0.5
Information about who someone with your role should depend on* 0
Information about how decisions are made in the team* 0
Information about which responsibilities are valued most in your team 1
Information about what roles are present in the team 1
Information about how someone in your role should work with those in other roles in your team 1
Information about how to acquire resources from outside the team.* -0.5
Information about what is considered unacceptable behavior 1
Information about which roles are valued most in your team. 1
Information about what is considered acceptable behavior 1
Information about what responsibilities are expected of those in the team. 1
Ways he/she has coordinated with other team members in past projects* 0
Information about how your role contributes to the team. 1
Information about what is appropriate to discuss with other team members. 1
Information about the appropriateness of the way you communicated information within the team. 1
Information about what responsibilities correspond with your role in the team. 1
Information about how responsibilities were going to be divided amongst team members.* 0.5
Information about whether the role you had taken in the team was appropriate. 1
Information about how to deal with grievances with the team's decision 1
Note. Items were evaluated using Lawshe’s (1975) Content Validation Ratio (CVR), which is and indicator of how consistent an item is with the it’s corresponding item definition.