Copyright 0 1987 by the Genetics Society of America
On
the Overdispersed Molecular Clock
Naoyuki Takahata
National Institute of Genetics, Mishima, Shizuoka-ken 41 1, Japan Manuscript received December 8, 1986
Accepted February 12, 1987
ABSTRACT
Rates of molecular evolution at some loci are more irregular than described by simple Poisson processes. Three situations under which molecular evolution would not follow simple Poisson processes are reevaluated from the viewpoint of the neutrality hypothesis: (i) concomitant or multiple substitu- tions in a gene, (ii) fluctuating substitution rates in time caused by coupled effects of deleterious mutations and bottlenecks, and (iii) changes in the degree of selective constraints against a gene (neutral space) caused by successive substitutions. The common underlying assumption that these causes are lineage nonspecific excludes the case where mutation rates themselves change systematically among lineages or taxonomic groups, and severely limits the extent of variation in the number of substitutions among lineages. Even under this stringent condition, however, the third hypothesis, the fluctuating neutral space model, can generate fairly large variation. This is described by a time- dependent renewal process, which does not exhibit any episodic nature of molecular evolution. It is argued that the observed elevated variances in the number of nucleotide or amino acid substitutions do not immediately call for positive Darwinian selection in molecular evolution.
NE of the most unexpected things occurring at
0
the molecular level is perhaps that, as compared with the rate of evolution at the phenotypic level, the evohtionary rate of a particular gene is nearly con- stant among various lineages or species. T h e rate- constancy o r “molecular (evolutionary) clock” hypoth- esis proposed by ZUCKERKANDL and PAULINC (1 965) has attracted much attention and has been extensively used in research of molecular evolution (e.g., SARICHand W I ~ N 1967;
WILSON,
CARLSON and WHITE 1977). In their paper, ZUCKERKANDL and PAULING also suggested that observed rates of protein evolution could be approximately described by a simple Poisson process in which all lineages experienced the same mean number of amino acid substitutions per unit time. This simple model predicts that the variance in the number of substitutions should be equal to the mean. Despite its widespread use, there is controversy concerning the accuracy of this statistical description and the mechanisms responsible for the observed de- partures from it.OHTA and KIMURA (1971) examined the variance of amino acid substitution rates in hemoglobins and cytochrome c among diverse lineages, concluding that the variance is slightly higher than expected from a simple Poisson process. LANGLEY and FITCH (1974) statistically studied the evolution of four proteins in vertebrates via a maximum likelihood procedure and rejected the uniformity of rates in time and among lineages. GOODMAN and his associates repeatedly claimed the nonuniformity of rates of hemoglobins, and emphasized the rapid evolution immediately fol-
Genetics 116 169-179 (May, 1987)
lowed by gene duplication and slow-down in primate lineages (e.g., GOODMAN, MOORE and MATSUDA 1975). More recently, comparing DNA sequences of 11 genes from rodents and man, W u and LI (1 985) found that rodent genes, on the average, evolve significantly faster than man’s, although at nondegenerate (non- synonymous) sites, growth hormone and glycoprotein hormone a subunit evolve much faster in man. In comparison of primate 9 globin pseudogenes and the goat orthologue as a reference, Koop et al. (1986) observed a markedly retarded rate in hominoids. Also, compiling both DNA-DNA hybridization data and DNA sequence data available for various taxonomic groups, BRITTEN (1 986) reached the conclusion that genes evolve at different rates between different tax- onomic groups. These recent studies have called in question the validity of global molecular clocks and suggested that mutation rates themselves have been changing to some significant extent in particular lin- eages due presumably to changes in generation times and DNA repair mechanisms.
maintained the neo-Darwinian view even for molecu- lar evolution. LEWONTIN (1974, pp. 228-229), for instance, stated that the (observed) substitution rates are averages over vast periods of evolutionary time and many cycles of speciation, extinction, and phyletic evolution, namely over numerous episodes of rapid and slow evolution. Although KIMURA (1983, pp. 82- 83) strongly opposed such a view that confuses an intrinsic rate with an average, the concept of an “epi- sodic” clock has been recently resurrected on sophis- ticated theoretical grounds. GILLESPIE (1 984a) exam- ined the same amino acid sequences of five proteins as KIMURA (1983,
pp.
76-79). Although they agreed that two out of the five deviate significantly from simple Poisson processes, they disagreed on its inter- pretation. GILLESPIE emphasized the nonuniformity. He claimed that the relative constancy may be an artifact of the very slow rate of amino acid substitu- tions and that molecular evolution may be episodic, with bursts of rapid evolution separated by long pe- riods of very slow evolution. In his accompanying paper, GILLESPIE (1 984b) invoked directional selec- tion to account for the episodic nature of molecular evolution.Now it seems certain that some, if not all, genes evolve with sloppier clocks than those of radioactive materials. Under the neutrality hypothesis, however, only a few theories have been proposed to explain the departure from a simple Poisson process. GILLESPIE and LANGLEY (1979) examined the effects of muta- tions that had been segregating in a common ancestral population as the lineages split [see also HUDSON (1 983a,b) and TAKAHATA (1 985)l. Also, WATTERSON (1 982a,b) elegantly showed that, even when a Poisson distributed number of sites in a gene mutate, the substitutions tend to occur in clusters rather than behave as a Poisson process. A simple consequence of these studies is that the variance of the number of substitutions is in general larger than the mean. This is because mutant sites d o not evolve independently in a finite population with restricted intragenic recom- bination. Obviously, however, tight linkage and ran- dom drift are not the only causes that inflate the variance.
Here, I shall quantify other possibilities that are compatible with neutrality of molecular evolution. It is assumed, as usually done, that such causes are lineage nonspecific so that molecular evolution in all lineages under study follows common rules. It is to be noted that this is an important assumption. It excludes the case where mutation rates themselves may differ systematically among lineages; for biologically reason- able parameters, it severely limits the range of the variation of rates. Conversely, systematic changes in mutation rates can greatly affect the tick rate of mo- lecular clocks and may easily account for the elevated
variance observed. This situation is clearly compatible with the neutrality hypothesis, but it is not the main concern here.
Under the lineage-nonspecificity assumption, I shall study the following possibilities analytically or by sim- ulation:
1. Multiple substitutions caused by simultaneous occurrence of multiple mutations in a gene or by intramolecular interactions. T h e process is described by a compound Poisson process.
2.
Fluctuating substitution rates in time. T h e proc- ess becomes a so-called doubly stochastic point process equivalent to that of GILLESPIE (1984a), but a different interpretation of this model is presented in terms of deleterious mutations and fluctuating population size. 3. Fluctuating neutral space. T h e possibility that each substitution in a gene changes the degree of selective constraints (neutral space) is analyzed as a time-dependent renewal process.In these hypotheses, it is also assumed, to simplify the mathematical treatment, that every substitution in a lineage occurs instantaneously. They involve statis- tical descriptions of molecular evolution rather than mechanistic models based on explicit considerations of allele frequency dynamics in a population. Of course, it is desirable to fully develop mechanistic models of these hypotheses and in fact some popula- tion genetics models are considered and simulated on a computer to supplement the analytical results, but it is the main purpose of this paper to look for plausible causes which make molecular clocks irregular under neutrality.
MODEL A N D ANALYSIS
KIMURA (1983, pp.
77-78)
proposed a statistical method to see whether the variance of the number of amino acid (or nucleotide) substitutions among lin- eages is larger than expected by pure chance. In that method, it is assumed that all lineages under study diverged in a short time relative to the time back to their common ancestor. Such a phylogeny may be called a “star” phylogeny (GILLESPIE 1984a). T h e value of using a star phylogeny to examine the rate- constancy hypothesis is in that the number of substi- tutions x i ( t ) accumulated in a homologous gene in the ith lineage (i = 1, 2,. . .
, n) follows a distribution with a common parameter t (divergence time of lin- eages). Here it is tacitly assumed that gene phylogeny is identical to species phylogeny and therefore that the possibility of gene divergence prior to species divergence is ignored(6
TAKAHATA and NEI 1985; TAKAHATA 1987). We define the sample mean X(t) asx?
xi(t)/n and the sample variance v x ( t ) as C ’ ; { x i ( t )-
X(t))‘/n, each of which is associated with a correspond-
ing random variable. We may use the estimate R ’ ( t )
Overdispersed Molecular Clock 171
changes among lineages. In actual situations, however,
x ( t ) ’ s are not directly observed and must be computed from d , ( t ) , where d,(t) is the number of substitutions between the ith a n d j t h lineages
(i,
j = 1, 2,.
.
.
, n ) .When n
>
3, x(t)’s are overdetermined by the d(t)’s for there are n ( n-
1)/2 d ( t ) values while there are only n independent variables of x ( t ) ’ s . T o estimate thex ( t ) ’ s from the d(t)’s, KIMURA (1987) developed a least square statistical method. Originally, KIMURA (1 983, pp. 77) considered an analogous statistic referred to as R ( t ) . This is the ratio of v x ( t ) to the expected variance. He then showed that if the x ( t ) ’ s follow the Poisson distribution, ( n
-
l ) R ( t ) approximately fol- lows the chi square distribution with n-
1 degrees of freedom, in which R ( t ) is estimated by ( n+
l ) v d ( t ) / [ ( n-
l)z(t)] where z(t) and vd(t) are the sample mean and variance of d ( t ) ’ s . Although R ( t ) and R ’ ( t ) do not give precisely the same values, both estimates can be used to measure the deviation of the observed number of substitutions among lineages from the Poisson ex- pectation. In our models, however, it is not easy to manipulate R ( t ) and R ’ ( t ) so that we will concern the expectations of Z ( t ) and v x ( t ) , denoted byy(t)
and V x ( t ) , respectively, and examine the dispersion indexZ ( t ) defined by V x ( t ) / x ( t ) . As n becomes large, R ’ ( t ) converges to Z ( t ) . In the literature of point processes
(e.g., COX and ISHAM 1979), processes are called overdispersed if Z ( t )
>
1 and underdispersed if Z ( t )<
1.
In what follows, we further assume that all lineages start out with independent substitution rates. Or, we postulate that with speciation, both intragenomic and external environments of a particular gene in each descendent lineage have no memory of those of the ancestor. This is a favorable condition to generate large values of Z ( t ) . However, unless the correlation of initial rates persists for a sufficiently long time compared with current separation times, this assump- tion would not make a large difference in Z ( t ) . In addition, the assumption allows one to compute Z ( t )
by only examining the substitution process along a single lineage.
Multiple substitutions (compound Poisson proc- ess): One generalization of a simple Poisson process is to allow for multiple occurrences of points (substitu- tions in the present context) at a time. Many authors (WYCKOFF 1968; DICKERSON and GEIS 1969; FITCH
and MARKOWITZ 1970; DAYHOFF and MCLAUCHLIN
1972; OZEKI et al. 1980; TSUKIHARA et al. 1985) have recognized that some, if not many, substitutions in a gene might not have occurred singly because of highly specialized intramolecular interactions. T h e concept of “covarion” (FITCH and MARKOWITZ 1970) was a result of such recognition, expressing that there exist concomitantly variable regions in a molecule in which changes have strong correlations. Alternatively, some
mutational events may create more than one nucleo- tide change, potentially resulting in multiple substi- tutions
(cf:
GOLDING 1987). If such simultaneous sub- stitutions occur, they produce a larger variance than expected from a simple Poisson process.Let yjAt be the probability of an event w i t h j con- comitant (multiple) substitutions during a time inter- val of length At. We assume that at most m substitu- tions can simultaneously occur, the total rate being
p = xj”=lyj. Let p i ( t ) be the probability that a gene has accumulated i substitutions during t units of time and assume that pi(0) = d i 0 where a i 0 is Kronecker’s delta
function. It is easy to derive the recurrence equations
for pi(t
+
At). Taking the limit as t --., 0, we readilyobtain the continuous-time version as
d . m
d t j = i
=
-
c
rjpi+
z
yjpi-jj = l
for i = 0, 1,
.
.
.
, where w e dropped the argument of p i ( t ) and defined pi = 0 ifi
<
0. T o solve (l), we take the Laplace transform with respect to t,Here, and subsequently, the superscript asterisk stands for Laplace transforms. We consider the gen- erating function of p,+(s)
Q*(%, s) =
CLo
p,+2.
(3)From (l), (2) and (3), we have
-1
Q”(2, s) =
[.
+
2
yi-
5
4
.
(4)
i= 1 i= 1
T h e inverse Laplace transform of (4) immediately leads to
Q(Z, t ) = exp
-
1
y i t+
2
yiz?m
}
{ ”
i= 1 i= 1m
= e x p b
+
@f(z)l,f(z) = C(yi/P)za. ( 5 )i= 1
Equation (4) or ( 5 ) implies that the process is a com- pound Poisson process. T h e mean and variance of the number of substitutions are
m
X ( t ) =
1
iyit,(6)
i= 1
i = l
and therefore the dispersion index becomes
m
C.
i2yii= 1
Z ( t ) = 7 ,
C
iyii= 1
which is independent o f t . It is clear from
(7)
that 1 SZ(t) 6 m holds. Thus, concomitant substitutions pro- duce overdispersed rates.
Fluctuating substitution rate (doubly stochastic point process): T h e second generalization of a simple Poisson process can be achieved when the rate func- tion changes in time, If the rate function determinist- ically changes, however, there would not be any effect to increase V x ( t ) as we shall see below. If, on the other hand, the rate is determined by a probabilistic law, the process becomes a so-called doubly stochastic point process. GILLESPIE
(1
984a,b) has recently considered this type of point processes to demonstrate that mo- lecular clock could be very irregular. We shall exam- ine the essence of this model in an elementary way, and attach a different evolutionary significance from that of GILLESPIE.
Let y ( t ) be the rate function of the Poisson process.
We begin with the following equations
where
p i
= 0 ifi
<
0. If we define a new time scale through7
= 7 ( t )
=I’
y(t’)dt’, (9)(8) become equivalent to the equations for an ordinary Poisson process with unit rate. Then the standard techniques used in the previous section yield the gen- erating function of p*(s) as
Q*(z, s) = [s
+
1 - 23-1, ( 1 0 4from which we have the probability generating func- tion of
p,(t)
asQ(z, 7 ) = e x p b
-
1)71 (lob)= exp{(z
-
1)1
y(t’)dt’).Hence the first and second moments, denoted by X , ( t ) and X 2 ( t ) , can be readily derived as
X l ( t ) = 7 ( t ) (1 la>
X,(t) = 7 ( t )
+
7 ( t y (1 1b)where 7 ( t ) is given by (9). From (1 l), we first see that Z ( t ) = 1 if the rate function ~ ( t ) is deterministically given, since the variance equals ~ ( t ) . Said another way,
7 ( t ) should be stochastic in order to augment the variance.
Now let us assume that y ( t ) is a weakly stationary process with the mean
T
and correlation function r(t). Taking the expectation of (1 1) with respect to the distribution of y ( t ) , we haveX ( t ) = E j 7 ( t ) ) = +t 1 2 4
and
(12b) V x ( t ) = E { 7 ( t ) )
+
E{T(t)2]-
E { T ( t ) ) 2= E f T ( t ) )
+
It
r(t1-
tz)dtldt2.Thus, the dispersion index is given by
I ( t ) = 1
+
4
s‘
l‘
r(t1-
t2)dtldtn. (12c)To evaluate the extent of overdispersion due to the randomly fluctuating rate y( t), we consider the follow- ing simple stochastic process. Assume that y ( t ) can take either a with probability
p
or b with probabilityq ( p
+
q = 1, 0<
a<
b) throughout successive time intervals of a fixed length A and that the value it takes in one interval is independent of the value in any other interval. With the subsidiary assumption that the process begins at a random time point, it is not difficult to show thaty t 0
+
= pa+
qb ( 1 3 4and
r(t,
-
t2) =a2(1 - I t 1
-
t2I/A), I t 1-
t 2 I 5 AI t 1
-
t 2 1>
A(13b)
( 0
where
d‘
= &(a-
b)‘. Then the second term on the right side of (1 2b) becomes, for 2t
I
A,2 (14)
1 --
E),
for 2t A.From (1 2c) and (1 4), Z(t) can be computed as
Z ( t ) = (15)
Overdispersed Molecular Clock 173
lineage follows a negative binomial distribution. We shall reconsider an analogous situation later although there are no good reasons to assume that the rate changes only at special evolutionary events. The op- posite case of A
<<
t seems more reasonable as dis- cussed in GILLESPIE (1984a). In this case, the rate changes many times along a lineage and it is this change that increases Z ( t ) . In our model, there would be bursts of substitutions when y ( t ) happens to take a large value of b, and long periods of status quo corre- sponding to a small value a. This picture of molecular evolution led GILLESPIE (1 984a) to the concept of episodic clocks for which he invokes positive Darwin- ian selection (GILLESPIE 1984b).From the neutralist point of view, however, a dif- ferent interpretation of this statistical model can be made. We recall that the rate of deleterious mutations is much higher than that for strictly neutral mutations
(e.g., MUKAI 1964) and deleterious mutations can ac-
cumulate in a population when the size is small (KI- MURA 1964, 1969; OHTA 1973, 1974). Therefore, we may attribute deleterious mutations coupled with the reduction of population size to bursts of substitutions. This view is entirely different from GILLESPIE'S.
However, because the above argument is based on fixation probabilities which are traditional for evalu- ating the average evolutionary rate, a more rigorous study is needed to assess the effect of deleterious mutations on Z ( t ) . Simulations were conducted, and some results of HAICH (1978) on Muller's ratchet were combined for this purpose.
We used the following simulation scheme. The pop- ulation with a fixed size, N , is haploid and monoecious. Generations are discrete and nonoverlapping. Two classes of mutations are introduced every generation; neutral mutations occur with rate yo, and deleterious mutations occur with rate y1 per locus. Each allele at time t is labeled by a vector ( X ( t ) , Y ( t ) ) where X ( t ) and Y ( t ) are the numbers of neutral and deleterious mu- tations that have accumulated since the start of a simulation. The relative fitness of an allele carrying Y ( t ) deleterious mutations is given by (1
-
s)'@). There is a steady decrease of fitness as Y ( t ) increases. Suppose that the population undergoes a bottleneck and sud- denly recovers its original size N at time t = 0. Assume that the bottleneck is so severe as to make the popu- lation virtually monomorphic, and ask to what extent neutral and deleterious mutations can accumulate from that time on. We set X ( 0 ) = Y ( 0 ) = 0. T o estimate the distribution of X ( t ) , Y ( t ) and the sum of these for an allele randomly selected from the population and the distribution of their population averages, we per- formed 500 repeats for a given set of parameters. Since these two kinds of distributions were found not to differ significantly from each other, we will focus mainly on a single allele.0.5
-
0 " " " " '
0 10 20 30 40 50 60 70 80
"0
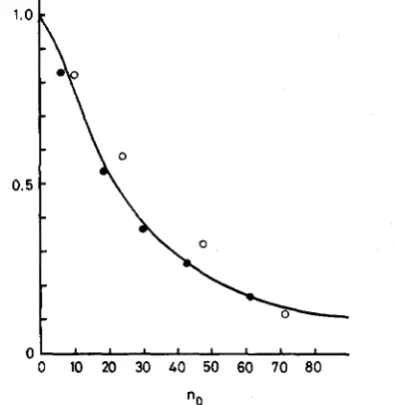
FIGURE 1.-The ratio of the mean number of deleterious mu- tations in a randomly selected gene to y l t against no = N exp(--yl/
s). y1 = 0.01 and s = 0.02 (0) and y1 = 0.001 and s = 0.02 (0). In the simulations, the population size N varied from 10 to 100 and observations were made after lo4 generations. The solid line is drawn by @)/(ylt) = 100/(nk5
+
100).Our concern is with the ratio of the mean of Y ( t ) observed in simulation, denoted by F(t), to ~ ~The t .
ratio is depicted against no = N exp(-yl/s) in Figure 1. HAIGH (1978) noted that if no is large (>25),
deleterious mutations (not only in a randomly selected gene but in a population) accumulate very slowly, and independently of each other, whereas, if no is small (cl), they behave as neutral alleles. Our simulations confirm this. However, because the ratio appears not to be precisely determined by no alone, we use the simulation results only in a crude way to assess to what extent deleterious mutations play a significant role in molecular evolution relative to neutral mutations. The empirical relationship between the ratio and no
we assume from Simulation is F(t)/(yIt) = 1 0 0 / ( ~ 6 . ~
+
100). For deleterious mutations to be more important in molecular evolution than neutral mutations, F ( t )>
z(t) must hold whereZ(t)
stands for the mean number of neutral mutations that have accumulated in an allele during t. The simulation result showed that the effects of linkage between neutral and deleterious mutations in an allele are slight, and that neutral mutations accumulate approximately as expected from a Poisson distribution of parameter yet. Thus the condition for F ( t )>
x ( t ) may be rewritten as N C[ 100(y,/yo
-
1)]2'5 exp(yl/s). If deleterious mutations occur at a much higher rate than neutral mutations,e.g., y1 = 10 yo, the above condition reduces to N
<
100 exp(yl/s), implying that unless 71>>
s, a verysize is moderately small. Another condition is also necessary for Z ( t )
>
1 because the occurrence of bottlenecks itself does not necessarily increase the variance of Y(t). T o guarantee it, the mode of bottle- necks must differ from lineage to lineage, o r at least it must be determined by some probabilistic law.We summarize these results: If there are very severe bottlenecks whose mode of occurrences differs from lineage to lineage and deleterious mutation rates are much higher than neutral mutation rates, then there would be bursts of substitutions in each lineage and at the same time it can be expected that Z ( t )
>
1. This picture is quite analogous to that described by the doubly stochastic point process considered here.Fluctuating neutral space (time-dependent re- newal process): T h e details of this model will be
presented elsewhere (M. KIMURA and N. TAKAHATA,
unpublished data). Here we briefly introduce the model and its consequences for comparison. T h e model assumes that the substitution rate fluctuates through changes of selective constraints as new sub- stitutions take place one after another. Assume also that the rate changes only when substitutions occur. If a gene has already experienced
i
substitutions, the rate for the(i
+
1)th substitution is designated by X,y where y denotes the upper limit of the rate and X, (0 5A,
S 1) specifies the degree of selective con- straints of a gene or its “neutral space.” Then, the p,(t)’s satisfy- d p z =
-Xipi
+ Xi-,pi-l,
(i
= 0, 1 , 2,. .
.) (16)d r
where r = y t and A-1 =
p-1
= 0. Equations (16) implythat the process is a “time-dependent” renewal process with a survival function for the (z
+
1)th substi- tution. T h e Laplace transform ofpi(.)
isNow assume that the A’S are mutually independent and follow a common distribution. Denoting the ex- pectation taken by this distribution by E ( ], we have, from (1 7),
for i = 0, 1, 2,
. . . .
T h e generating function of E(p*(s)J, denoted by Q*(z, s) as before, becomessatisfying automatically the normalization condition of Q*(1, s) = 1/s, or pi(.) = 1. If the distribution
of X is Dirac delta function corresponding to a single fixed rate of substitution, (19) reduces to the gener- ating function for a Poisson distribution. T h e Laplace transforms of the first and second moments, denoted by X:(s) and X z ( s ) , are given by
and
2
2 1
S ( s ) = X:(S)
+
2
[
{s ~-
s ] , @Ob)E -
respectively.
Let us consider the case where the X’s are uniformly distributed in the interval (U, b ) (0
<
a<
b S 1). Then we haveand
Although we could not successfully obtain the inverse Laplace transform of (21), we can obtain the asymp- totic forms of
T(r)
and V x ( r ) by using a Tauberian theorem. As s approaches 0,1 1
X;k(s) +
-$IO)
+
;
( f ’ ( 0 )-
1) (2%)and
+
1
( f ’ ( 0 )-
1)(2f’(O)-
1)S
Overdispersed Molecular Clock 175
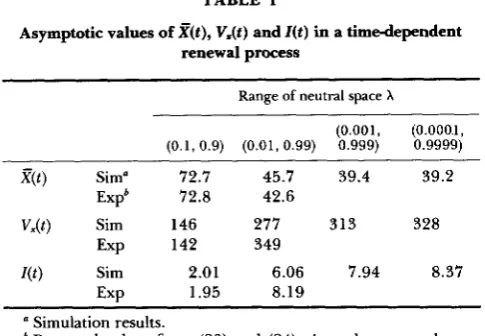
TABLE I
Asymptotic values of n t ) , V.(t) and Z ( t ) in a timedependent renewal process
Range of neutral space X
(0.001, (O.OOO.l, (0.1,0.9) (0.01,0.99) 0.999) 0,9999)
X ( t ) Sim" 72.7 45.7 39.4 39.2
V&) Sim 146 277 313 328
Expb 72.8 42.6
Exp 142 349
W )
Sim 2.01 6.06 7.94 8.37EXP 1.95 8.19
a Simulation results.
'
Expected values from (23) and (24). As a decreases, the ap- ' AI1 values are computed at y t = 200.proximation does not work well.
= f(O)'/(ab). Thus the Tauberian theorem implies that the mean and variance of X ( t ) must approach
X ( t ) =AO)yt ( 2 3 4
Vx(t) =f(0>(2f'(O>
-
l h t (23b) andas t + 00. It can be seen from (23a) that z(t) increases
at a rate slower than expected from a mean value
1
= ( b+
a)/2. This retardation results from an aftereffect of such substitutions that may happen to severely shrink the neutral space for the subsequent substitu- tions: Once such a small rate is taken, the substitution process will be virtually terminated later on.T h e asymptotic formula of Z ( t ) becomes
Z ( t ) = 2f'(O)
-
1 2We note in (24) that Z ( t ) = 1 still holds if a = b and that Z ( t ) increases as the ratio b / a increases.
Monte Carlo experiments were carried out to sup- plement these results, and showed that the asymptotic formulas of (23) and (24) are approximately valid for
1 I b / a
<
10' (Table 1); the simulation value of Z ( t )at y t = 200 is about 6, whereas Z ( t ) is about 8 from (24). For even larger values of b / a , however, (23) and (24) do not give good approximations, probably be- cause higher order terms of s in (21) become more important as a becomes small. Of importance here is that this renewal model can in fact predict fairly large values of Z ( t ) if the parameter of neutral space X
fluctuates to a large extent.
DISCUSSION
We discuss in turn the models studied above and their consequences. There are, it seems, two obser-
vations in favor of the occurrence of multiple (actually double) nucleotide substitutions. FITCH and MARGO- LIASH (1968) noted that the number of codons that have changed at two of the three positions is greatly in excess of expectations based on independence of sites. OHTA (1973) interpreted it as a result of double mutations in which the second compensates slightly deleterious effects of the first on fitness, increasing a chance of fixation of such double mutations. KIMURA (1985) modeled OHTA'S idea, showing in the absence of recombination between two mutant sites that the average fixation time of double mutants is much shorter than expected for a single deleterious muta- tion. A more direct estimate of double substitutions can be made when DNA sequences are at hand. In fact, GILLESPIE (1986b) found that out of 33 pairwise comparisons of nine DNA sequences from four lin- eages, 25 showed an excess of double substitutions at the first and second positions of codons. These are suggestive that double substitutions often occur within a codon and have some important bearing on molec- ular evolution.
T h e second supporting evidence comes from the combined study of amino acid sequence with the three-dimensional structure of protein. WYCKOFF (1 968) compared the rat pancreatic ribonuclease se- quence with the bovine RNase-S structure and noted that a number of amino acid changes can be paired on the basis of their distance in the three-dimen- sionally folded structure. Such paired substitutions were found also in tryptophan synthetase A protein
(YANOFSKY, HORN and THORPE 1964), tRNA (OZEKI
et al. 1980) and ferredoxins (TSUKUHARA et al. 1985), suggesting that they might have evolved concomi- tantly.
To get a rough idea about the frequency of double substitutions, we recall that out of 41 amino acid changes between the rat and bovine ribonucleases (WYCKOFF 1968, Table D-1), 14 are paired and the rest are single. Therefore the frequency of double substitutions relative to single may be estimated as
7
of 27. Substituting this ratio and m =2
for(7)
yieldsZ ( t ) = 1.34, which is only a little larger than the Poisson expectation. Actually, the observed value of
R ( t ) for this special comparison of bovine, pike whale,
horse and rat ribonucleases is about 2.4, which is not significantly different from unity (KIMURA 1983, pp. 78-79). It is clear from
(7)
that Z ( t ) remains close to unity unless substitutions occur with very high multi- plicity and rate. Since there is no evidence for such multiplicity and rate [see also GOLDING (1987)], it is unlikely that large values of R ( t ) as observed in hemo- globinP
and cytochrome c are caused by this type of substitutions.with Z ( t ) significantly larger than unity. One is made by GILLESPIE (1 984a), in which he considers the three primary elements: a changing environment, a muta- tional landscape and epistasis. Changes in the environ- ment are referred to as environment challenges to each of which one of the loci under epistatic interac- tions responds with one or more substitutions. T h e mutational landscape model calls for directional selec- tion to show that the mean number of nucleotide substitutions per environment challenge should be about 1.5-2.5. Here we see the crucial role of positive Darwinian selection to explain such a specific number of substitutions per environment challenge. It is not clear, however, why the number of environment chal- lenges as well as the number of nucleotide substitu- tions per environment challenge in diverse lineages in a star phylogeny must follow common rules. There seems no a priori reason to believe that molecular evolution driven by positive Darwinian selection pro- ceeds in such a regular way among lineages that may differ drastically in environment, morphological traits, phyletic evolution and so on. T h e validity of this model and its interpretation should be examined more carefully, otherwise the “episodic” clock may be an artifact of the assumption that all lineages under study share common rules for molecular evolution.
T h e other interpretation of doubly stochastic point processes is that the rate y ( t ) is a function of selective constraints against mutations and population size. OHTA ( I 977) and KIMURA (1 979) considered specific models which assume that selection coefficient s fol- lows a particular distribution, f(s). They noted that the fraction of effectively neutral mutations in a hap- loid population of size N that can contribute to sub- stitutions is approximately given by
1
”f(
s) ds. (25)Let y ( t ) be the effectively neutral mutation rate which changes from time to time as the population size fluctuates. Consider the two state model of y ( t ) intro- duced in (1 3). We assume that a and b are the effec- tively neutral mutation rates when a population is in the phase of expansion and contraction in its size, respectively. Suppose, for instance, that a = b =
A = l o 5 and q = lo-’. These values of A and q imply that the population size suddenly changes every l o 5 units of time and that at every one hundredth change, on the average, the population undergoes a bottleneck. T h e mean evolutionary rate then becomes
2
X loe6 from (13a), whereas Z ( t ) = 3.45 for t>>
A from (1 5). To evaluate how large the population size must be in the expansion and contraction phases, we consider OHTA’S ( 1 977) model which assumes that selection coefficients among mutations are exponen- tially distributed, i . e . , f ( s ) = ( a = 1 / S where S isthe mean selection coefficient). Substituting f(s) for (25) yields that N must be much smaller than 1/S in the contraction phase while the opposite condition is required in the expansion phase. If a typical value of S is of the order of 1 0-3, very severe bottlenecks must be called for to incorporate most of deleterious mu- tations with a broad spectrum on fitness.
We have already reached the same conclusion about the role of deleterious mutations on molecular evo- lution through simulation and Muller’s ratchet consid- erations. We pointed out that deleterious mutations could be more important than neutral mutations only when y 1
>>
yo and N< 100
exp(yl/s). T h e latter condition is very stringent, requiring very high mu- tation pressure, very strong drift, or both to overcome negative selection. Therefore deleterious mutations that newly arise only in the bottleneck phase can accelerate the rate of molecular evolution, with a lesser role of fixation of those barely segregating before bottlenecks or founder events. T h e net effect of deleterious mutations would be estimated by sum- ming up the periods that a lineage spends with N<
100 exp(yl/s). To observe significant variation of the evolutionary rate among lineages, however, bottle- neck events have to vary considerably from lineage to lineage. In other words, for this hypothesis to work, the assumption of lineage-nonspecificity made here must be unrealistic and removed. In addition, if bot- tlenecks are a main cause of increasing the variation of evolutionary rate, the effect should be manifest in all genes of a lineage. In WU and LI’S (1985) study of 1 1 genes from mammals, not all genes from rodents evolve significantly faster than man’s as noted earlier. It is not clear at present whether or not this is excep- tional, but the bottleneck and deleterious mutation argument would be convincing only when most of genes from a lineage show the same patterns.
To rationalize the fluctuating neutral space model, we take the opposum hemoglobin a (STENZEL 1974) and the guinea pig insulin (BLUNDELL et al. 1971;
Overdispersed Molecular Clock
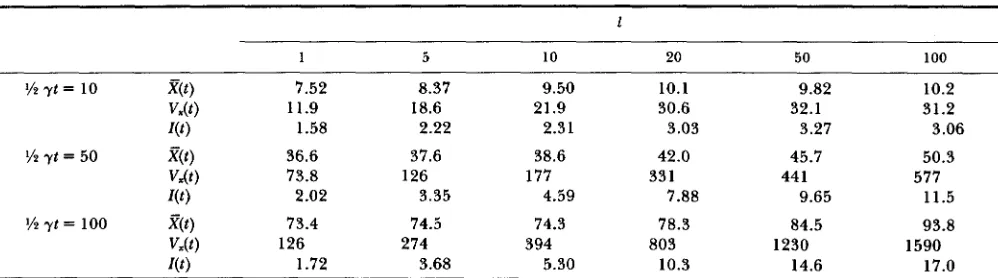
TABLE 2
Simulation results when the substitution rate changes every I substitutions
177
1
1 5 10 20 50 100
7.52
1.58 11.9
36.6 73.8
73.4 2.02
126
8.37
2.22 18.6
37.6 126
3.35 74.5 274
9.50
2.31 21.9
38.6 177
4.59 74.3 394
10.1 30.6 3.03 42.0 331
7.88 78.3 803
9.82
3.27 32.1
45.7 44 1
9.65 84.5 1230
10.2 31.2 3.06 50.3
11.5 93.8 577
1590
r(t
j
1.72 3.68 5.30 10.3 14.6 17.0Here it is assumed that the range of neutral space X is rather narrowly restricted to (0.1, 0.9) to see large effects of the duration parameter 1 on l ( t ) . Observe that X ( t ) , V&) and I ( t ) approach the values predicted from (26) as 1 increases, and that the asymptotic value of l ( t ) is attained rather quickly when 1 is small, but rather slowly when 1 is large.
others. In Table 1 , we have noted that the neutral space must fluctuate to a large extent in order to increase
Z(
t ) substantially. However, if we take account of the long-term effect of some substitutions, a differ- ent result emerges. Consider the extreme case where the long-term effect is perfect so that the substitution rate in a lineage is determined as a random variable,A, from a distribution and remains fixed throughout time. Since we have assumed that the distribution is uniform on (a, b), the mean and variance of the number of substitutions become
q t ) = xyt,
and
Var(A)
x
Z ( t ) = 1
+
-
( y t )where
x
= ( a+
b)/2 and Var(A) = ( a-
b)‘/12. Thus even when a = 0.1 and b = 0.9 (cf: Table l) , I ( t ) E 1+
0.1 l(yt) implying that Z ( t ) increases indefinitely asy t increases. This time-dependence of Z ( t ) is a general
property of renewal processes (Table 2) so that we can examine this model by looking at star phylogenies with different divergence times. Simulation similar to that performed for Table 1 was carried out to confirm this and, more importantly, to see what happens when the substitution rate randomly changes at every I substitutions. It is clear from Table 2 that Z(t) increases and approaches the theoretical expectation as 1 in- creases and that it can be very large when y t is large. This situation may be rephrased in terms of confi- dence limits. Consider, for example, the case of i ( t ) =
24.6 (the sample mean of amino acid substitutions among the human, bovine and mouse cytochrome oxidase 2). If the substitution process is Poisson, then the 99% confidence limit ranges from 17 to 35. If instead the substitution process is specified by the
renewal process with a = 0.1, b = 0 .9 and I = 10, the limit becomes much broader, ranging from 1 to 50. A renewal process of this type can generate very large variation. Nonetheless, molecular clock does not have any episodic nature as noted by GILLESPIE (1 986c).
Our conclusion is that, among the possibilities we studied, the fluctuating neutral space has the largest effect on Z ( t ) with lesser roles of multiple and delete- rious mutations. This conclusion was obtained mainly through the analysis of various point processes. How- ever, we recognize that our approach of using point processes to study molecular evolution is a crude way of describing the underlying mechanism. It lacks mechanistic aspects. This is clearly demonstrated by the “doubly stochastic point process” which can be consistent with two antagonistic mechanisms. There- fore, it is important to develop a mechanistic, popu- lation genetics model of fluctuating neutral space and to see if our conclusion is supported. Some prelimi- nary results are presented in Table 3. T h e table indicates what we expect from the renewal process above. However, throughout the present study, we have assumed that all lineages start out with inde- pendent rates. While this assumption is conservative for the models of multiple and deleterious mutations, it is not so for the fluctuating neutral space model particularly when the duration parameter I is large. Any correlation of starting rates among lineages re- duces the variation of rates for obvious reasons. In addition, we have focused mainly on the dispersion index Z ( t ) rather than the distribution of R ( t ) or R’(t). There is no study on the distribution of R(t) or R’(t) except for a simple Poisson process (KIMURA 1983, pp. 77-78), although it is necessary to statistically examine R ( t ) or R ’ ( t ) . More needs to be done to clearly answer these points.
TABLE 3
Average R’(t) values obtained by a population genetics model of
fluctuating neutral space
1 10 20 30 40 50
Nu& = 0.4 4 1.79 2.43 2.85 3.11 3.37 20 2.43 4.15 5.80 7.24 8.93
N V I = 0.04 2 2.19 3.30 3.16 3.44 3.98 20 3.64 4.91 6.56 7.41 9.65
The simulation scheme used in this table is as follows. The population with a fixed size, N, is haploid, monoecious. Generations are discrete and nonoverlapping. T w o classes of mutations are introduced every generation, one for neutral mutations with rate
vfo per gene and the other for deleterious mutations with rate U( 1
- f o ) , where& is the fraction of neutral mutations. In this simulation, & uniformly ranges from 0 to 0.2 (the average& = 0.1) and changes randomly every 1 mutations for each gene. All genes carrying at least one deleterious mutation are assumed to be disadvantageous;
Ns = 20, where s is the selective disadvantage. In each run for a given set of parameters, the ratio R’(t) is computed at specified times for n genes each sampled from independent lineages or populations. In all cases, n = 4 is assumed. Each run is repeated 10 times and the average ratio R’(t), is computed over these repeats. The variation of R’(t) is very large with the small number of populations. I t is clear, however, that the time-dependent renewal process in text can accurately predict most of the features seen in this table. In particular, the agreement is better for small values of
Nu because the assumption of instantaneous substitutions made for point processes becomes more reasonable in such circumstances.
tion of evolutionary rates from a simple Poisson proc- ess is rather insensitive to the magnitude of various factors modeled here. This insensitivity stems largely from our basic assumption that these factors are lin- eage nonspecific. We have stressed that it rules out any systematic changes in neutral mutation rates among lineages. T h e systematic changes presumably caused by alterations of generation lengths and DNA repair mechanisms, even though slight, can greatly affect the accuracy of molecular clocks.
As a final caveat, although we have admitted that some genes evolve at different rates in time and among lineages, there are many genes whose clocks may well be characterized by simple Poisson processes. As KIMURA (1983, pp. 85) admonished, we should bear in mind that emphasizing departures from this simple model may repeat the fault of “not seeing the forest for the trees.”
I thank Drs. M. KIMURA, T . OHTA and J. GILLE~PIE for their comments and criticisms from their own opinion about molecular evolution, which contributed much to shape the final version of this paper. I am also grateful to Dr. M. TURELLI and an anonymous reviewer for their editorial comments and critical reading of the manuscript. This is contribution no. 1722 from the National Insti- tute of Genetics, Mishima, Shizuoka-ken 41 l , Japan.
LITERATURE CITED
BLUNDELL, T. L., J. F. CUTFIELD, S. M. CUTFIELD, E. J. DODSON, G. G. DODSON, D. C. HODGKIN, D. A. MERCOLA and M. VIJAYAN, 1971 Atomic positions in rhombohedral 2-zinc in- sulin crystals. Nature 231: 506-51 1.
BLUNDELL, T. L. and S. P. WOOD, 1975 Is the evolution of insulin Darwinian or due to selectively neutral mutation? Nature 257:
197-203.
Rates of DNA sequence evolution differ between taxonomic groups. Science 231: 1393-1398.
Point processes. In Monographs on Applied Probability and Statistics. Chapman & Hall, New York.
In Atlas ofProhin Sequence and Structure 1972, EdiLed by M. 0. DAYHOFF. Na- tional Biomedical Research Foundation, Silver Spring, Mary- land.
DICKERSON, R. E. and I. GEIS, 1969 The Structure and Action of
Proteins. W. A. BENJAMIN, Menlo Park, New Jersey.
FITCH, W. M. and E. MARGOLIASH, 1968 The construction of phylogenetic trees. 11. How well do they reflect past history? Brookhaven Symp. Biol. 21: 217.
FITCH, W. M. and E. MARKOWITZ, 1970 An improved method for determining codon variability in a gene and its application to the rate of fixation of mutations in evolution. Biochem. Genet. 4: 579-593.
GILLESPIE, J. H., 1984a The molecular clock may be an episodic clock. Proc. Natl. Acad. Sci. USA 81: 8009-8013.
GILLESPIE, J. H., 1984b Molecular evolution over the mutational landscape. Evolution 38: 11 16-1 129.
GILLESPIE, J. H., 1986a Natural selection and the molecular clock. Mol. Biol. Evol. 3: 138-155.
GILLESPIE, J. H., 198613 Variability of evolutionary rates of DNA. Genetics 113: 1077-1091.
GILLESPIE, J. H., 1986c Statistical aspects of the molecular clock. pp. 255-272. In Evolutionary Processes and Theory, Edited by S. KARLIN and E. NEVO. Academic Press, New York.
Are evolutionary rates really variable? J. Mol. Evol. 13: 27-34.
Multiple substitutions create biased esti- mates of divergence times and small increases in the variance to mean ratio. Heredity. In press.
Darwinian evolution in the genealogy of hemoglobin. Nature 253: 603- 608.
The accumulation of deleterious genes in a population-Muller’s ratchet. Theor. Popul. Biol. 14: 25 1- 267.
HUDSON, R. R., 1983a Testing the constant-rate neutral allele model with protein sequence data. Evolution 37: 203-21 7. HUDSON, R. R., 1983b Properties of a neutral allele model with
intragenic recombination. Theor. Popul. Biol. 23: 203-2 17. KIMURA, M., 1964 Diffusion models in population genetics. J.
Appl. Probab. 1: 177-232.
KIMURA, M., 1968 Evolutionary rate at the molecular level. Na- ture 217: 624-626.
KIMURA, M., 1969 The rate of molecular evolution considered from the standpoint of population genetics. Proc. Natl. Acad. Sci. USA 63: 1181-1188.
Model of effectively neutral mutations in which selective constraint is incorporated. Proc. Natl. Acad. Sci. USA
76: 3440-3444.
KIMURA, M., 1983 The Neutral Theory of Molecular Evolution.
Cambridge University Press, Cambridge.
KIMURA, M., 1985 The role of compensatory neutral mutations in molecular evolution. J. Genet. 64: 7-19.
KIMURA, M., 1987 Molecular evolutionary clock and the neutral theory. J. Mol. Evol. In press.
KING, J. L. and T. H. JUKES, 1969 Non-Darwinian evolution. Science 164: 788-798.
KOOP, B. F., M. GOODMAN, P. XU, K. CHAN and J. L. SLIGHTOM, 1986 Primate s-globin DNA sequences and man’s place among the great apes. Nature 319: 234-237.
BRITTEN, R. J., 1986
COX, D. R. and V. ISHAM, 1979
DAYHOFF, M. 0. and P. J. MCLAUGHLIN, 1972
GILLESPIE, J. H. and C. H. LANGLEY, 1979
GOLDING, G. B., 1987
GOODMAN, M., G. W. MOORE and G. MATSUDA, 1975
HAIGH, J., 1978
Overdispersed Molecular Clock 179
LANGLEY, C. H. and W. M. FITCH, 1974 An examination of the constancy of the rate of molecular evolution. J. Mol. Evol. 3:
LEWONTIN, R. C., 1974 The Genetic Basis of Evolutionary Change.
Columbia University Press, New York.
MUKAI, T., 1964 The genetic structure of natural populations of
Drosophila melanogaster. I. Spontaneous mutation rate of poly- genes controlling viability. Genetics 5 0 1-19.
OHTA, T., 1973 Slightly deleterious mutant substitutions in evo- lution. Nature 246: 96-98.
OHTA, T., 1974 Mutational pressure as the main cause of molec- ular evolution and polymorphism. Nature 252: 351-354. OHTA, T., 1977 Extension to the neutral mutation random drift
hypothesis. pp. 148-1 67. In Molecular Evolution and Polymor- phism, Edited by M. KIMURA. National Institute of Genetics, Mishima.
OHTA, T. and M. KIMURA, 1971 On the constancy of the evolu- tionary rate of cistrons. J. Mol. Evol. 1: 18-25.
OZEKI, H., H. INOKUCHI, F. YAMAO, M. KODAIRA, H. SAKANO, T. IKEMURA and Y. SHIMURA, 1980 Genetics of nonsense s u p pressor tRNAs in Escherichia coli. pp. 341-362. In Transfer RNA: Biological Aspects, Edited by D. SOLL, J. ABELSON and P. SCHIMMEL. Cold Spring Harbor Laboratory, Cold Spring Har- bor, New York.
Immunological time scale for hominid evolution. Science 1 5 8 1200-1 203.
Opossum Hb chain sequence and neutral mu- tation theory. Nature 252: 62-63.
Gene diversity in finite populations. Genet. Res. 4 6 107-1 13.
An attempt to estimate the effective size of 161-177.
SARICH, V. M. and A. C. WILSON, 1967
STENZEL, P., 1974
TAKAHATA, N., 1985
TAKAHATA, N., 1987
the ancestral species common to two extant species from which homologous genes are sequenced. Genet. Res. In press.
Gene genealogy and variance of interpopulational nucleotide differences. Genetics 1 1 0 325- 344.
TSUKIHARA, T., K. FUKUYAMA, S. WAKABAYASHI, K. WADA, H. MATSUBARA, L. KERSCHER and D. OESTERHELT, 1985 Preliminary x-ray diffraction studies on a ferredoxin from the thermophilic archaebacterium, thermoplasma acidophilum. J. Mol. Biol. 1 8 6 481-482.
UZZELL, T. and K. W. CORBIN, 1971 Fitting discrete probability distributions to evolutionary events. Science 172: 1089-1096. WATTERSON, G. A., 1982a Substitution times for mutant nucleo-
tides. J. Appl. Probab. 194 59-70.
WATTERSON, G. A., 1982b Mutant substitutions at linked nucleo- tide sites. Adv. Appl. Probab. 1 4 206-224.
WILSON, A. C., S. S. CARLSON and T. J. WHITE, 1977 Biochemical evolution. Annu. Rev. Biochem. 46: 573-639.
WU, C.-I. and W.-H. LI, 1985 Evidence for higher rates of nu- cleotide substitution in rodents than in man. Proc. Natl. Acad. Sci. USA 82: 1741-1745.
Discussion. Brookhaven Symp. Biol. 21:
Protein structure relationships revealed by mutational analysis. Science 146:
Evolutionary divergence and convergence in proteins. pp. 97-166. In Evolving Genes and Proteins, Edited by V. BRYSON and H. J. VOGEL. Academic Press, New York.
Communicating editor: M. TURELLI TAKAHATA, N. and M. NEI, 1985
WYCKOFF, H. W., 1968
YANOFSKY, C., V. HORN and D. THORPE, 1964 252-257.
1593-1594.