EFFECTS OF CONSERVATION AGRICULTURE ON BEAN AND
MAIZE YIELD, SOIL PROPERTIES AND WATER PRODUCTIVITY
IN BUGESERA DISTRICT, RWANDA
Michel Kabirigi (BSc.)
A148EA/20751/2012
A Thesis Submitted in Partial Fulfillment of the Requirements for the
Award of the Degree of Master of Science in Integrated Soil Fertility
Management, in the School of Agriculture and Enterprise Development,
Kenyatta University, Kenya
DECLARATION
This thesis is my original work and has not been presented for a degree in any other University or any other award.
Signed______________________ Date ___________________
Michel Kabirigi (A148EA/20751/2012)
Department of Agricultural Resource Management
SUPERVISORS
We confirm that the work reported in this thesis was carried out by this candidate under our supervision.
Signed ______________________ Date__________________
Dr. Ngetich Kipchirchir Felix
Department Land and Water Management, Embu University College, Kenya.
Signed ______________________ Date__________________
Dr. Kennedy Mwetu
Department of Agricultural Resource Management, Kenyatta University, Kenya.
Signed ______________________ Date__________________
Dr. Nsharwasi Leon Nabahungu
DEDICATION
ACKNOWLEDGEMENT
The completion of this work has been possible through the assistance and co-operation of several people and institutions. I am grateful to Association for strengthening Agricultural Research in Eastern and Central Africa (ASARECA) and Rwanda Agriculture Board (RAB) for fellowship which allowed me to stay in Kenyatta University and the payment of tuition fees. I am also grateful to Sustainable Intensification of Maize-Legume cropping systems for food security in Eastern and Southern Africa program (SIMLESA) project for supporting my research work and laboratory activities. I acknowledge RAB and Ministry of Agriculture (MINAGRI) for selecting me as candidate for MSc studies and for granting me the study leave.
I sincerely thank my supervisors Dr. Felix Ngetich, Dr. Kennedy Mwetu and Dr Nsharwasi Leon Nabahungu for their professional guidance and tireless efforts during my study. Special thanks to Dr. Nabahungu for his encouragement and mentorship, Dr. Ngetich for a wonderful contribution and working relationship and his effort towards reshaping the initial rough ideas into a proposal from the beginning of this research. I acknowledge Dr. Jayne Mugwe for valuable contributions and stimulating discussions. I acknowledge the assistance in guidance and advice received from John Hargreaves, Kisaka Masika Oscar, Thomas Mawora and Musana during APSIM simulations build up.
TABLE OF CONTENTS
DECLARATION... i
DEDICATION... i
ACKNOWLEDGEMENT ... iv
TABLE OF CONTENTS ... v
LIST OF TABLES ... viii
LIST OF FIGURES ... ix
ABBREVIATIONS AND SYMBOLS ... x
ABSTRACT ... xii
CHAPTER ONE ... 1
INTRODUCTION... 1
1.1. Background ... 1
1.2 Problem Statement ... 3
1.3 Objectives ... 4
1.3.2 Research hypothesis ... 5
1.5 Justification of the study ... 5
1.6 Significance of the study ... 6
1.7 Conceptual framework ... 7
CHAPTER TWO ... 9
LITETURE REVIEW ... 9
2.1 Background information on conservation agriculture ... 9
2.2. Tillage method and environment... 10
2.3. Crop residues application and Soil quality ... 11
2.4. Conservation Agriculture and Climate variability Adaptation ... 12
2.5. The trade-offs of implementing CA ... 13
2.6. Conservation agriculture for improved agricultural water productivity ... 14
2.7. Modeling conservation agriculture... 16
CHAPTER THREE ... 18
3.1 Study area ... 18
3.2 Experiment set up ... 19
3.2.1 Experimental design and layout ... 20
3.2.2 Test crops, Residues and fertilizers application ... 20
3.2.3 Experiment data collection ... 21
3.3 Soil sampling ... 21
3.4 Rainfall measurements ... 22
3.5 Soil analysis... 22
3.6 Water productivity Determination ... 23
3.7 Infiltration rate measurement ... 24
3.8 Modeling: APSIM ... 25
3.8.1 Choice of scenario ... 25
3.8.2 APSIM Model Parameterization ... 26
3.8.3 APSIM Calibration and validation ... 30
3.9 Statistical Analysis ... 30
CHAPTER FOUR ... 31
RESULTS AND DISCUSSION ... 31
4.1 Overview of results presentation ... 31
4.2 Rainfall distribution in RAB Karama research station... 31
4.3 Effect of tillage method, residues application and inorganic fertilizers on beans and maize yield ... 32
4.3.1 Effect of Residues application on beans grain and biomass yield ... 32
4.3.2 The effect of tillage method on grain and biomass yield of beans ... 34
4.3.3 The effect of tillage method and residues application on maize grain and biomass yield ... 35
4.3.4 Effects of residues application on maize grain and biomass yield ... 37
4.3.5 The effect of tillage method on maize grain and biomass yield... 40
4.3.6 The effect of residues application on beans and maize 1000 grain weight ... 41
4.4 Effects of tillage method, residues application and inorganic fertilizers on soil properties ... 43
4.4.1 Initial soil fertility status ... 43
4.4.2 Effect of tillage method and residues application on soil properties ... 44
4.4.2.1 Effect of tillage and residues application on organic carbon ... 44
4.4.2.3 Effect of tillage method and residues application on Nitrogen ... 49
4.4.2.4 Effect of tillage method and residues application on Available phosphorous ... 53
4.4.2.5 Effect of tillage method and residues applicationon soil pH ... 55
4.4.3 Effect of residues application on soil properties ... 58
4.4.4 The effect of tillage method on soil properties ... 62
4.4.5 Effects of residues application and crop type on organic carbon and CEC ... 64
4.4.6 Effect of tillage and crop type on available P and soil pH ... 66
4.5 The effect of tillage method, residues application and inorganic fertilizers on infiltration rate and water productivity... 67
4.5.1 Effect of tillage method and residues application on infiltration rate and water productivity ... 67
4.5.2 The effect of residues application on beans and maize water productivity ... 69
4.5.3 The effect of tillage method on infiltration rate and water productivity ... 70
4.6 Simulating the long term effect of CA on maize yield with reduced rainfall scenario ... 73
4.6.1 Simulated effect of residues application on maize grain and biomass yield in reduced rainfall (by 10%) condition... 73
4.6.2 Simulated effect of residues application on maize water productivity in reduced rainfall (by 10%) condition ... 75
4.6.2 Simulated effect of residues application on soil organic carbon ... 77
CHAPTER FIVE ... 79
CONCLUSION AND RECOMMENDATION ... 79
5.1 Overview ... 79
5.2 Conclusions ... 79
5.3 Recommendations ... 80
REFERENCE ... 82
APPENDICES ... 92
APPENDIX 1Randomization of treatments in the experiment (B=Beans and M=Maize) ... 92
LIST OF TABLES
Table 1: Treatments structure, combination and initialization ... 20
Table 2: Methods of soil analysis ... 23
Table 3: An example of some soil properties used for specifying APSIM simulations ... 26
Table 4: Cultivar parameters ... 27
Table 5: Initial Soil Organic Matter Status ... 27
Table 6: The effect of tillage method on beans grain and biomass yield ... 34
Table 7: The effect of tillage method and residues application on maize grain and biomass yield... 36
Table 8: The effect of tillage method on maize grain and biomass yield ... 40
Table 9: Soil fertility status before applying treatments ... 44
Table 10: The effect of tillage method and residues application on organic carbon (%) . 45 Table 11: The effect of tillage method and residues application on CEC (meq) ... 48
Table 12: The effect of tillage method and residues application on Nitrogen (%) ... 51
Table 13: The effect of tillage method and residues application on available P (ppm) .... 54
Table 14: The effect of tillage method and residues application on soil pH ... 57
Table 15: Effect of residues application on soil properties for 2014A and 2014 B ... 60
Table 16: Effect of tillage method on soil properties for 2014A and 2014 B ... 63
Table 17: Effects of residues application and crop type on organic carbon and CEC... 65
Table 18: Effect of tillage method and crop type on available P and soil pH ... 66
Table 19: Effects of tillage and residues application on infiltration rate and water productivity (WP) ... 68
LIST OF FIGURES
Figure 1: Conceptual framework (Kabirigi, 2015). ... 8 Figure 2: Location of research site with dominant soil (CM= CAMBISOLS,
ABBREVIATIONS AND SYMBOLS
ANOVA: Analysis of Variance
ASARECA: Association for strengthening Agricultural Research in Eastern and Central Africa
APSIM: Agricultural Production Systems sIMulator
CA: Conservation Agriculture
CEC: Cation Exchange Capacity
CIP: Crop Intensification Program
CM: CAMBISOLS
CROPWAT: Computer Program for Irrigation Planning and Management
ESW: Extractable soil water
FR: FERLSOLS
GDP: Gross Domestic Product
GHG: Green House Gases
HS: HISTOSOLS
ICF: International Council for Research in Agroforestry
IITA: International Institute of Tropical Agriculture
GL: GLEYSOLS
MDG: Millennium Development Goal
B: Rwanda Agriculture Board
SIMLESA: Sustainable Intensification of Maize-Legume cropping systems for food security in Eastern and Southern Africa program
SOC: Soil Organic Carbon
USDA: United States Department of Agriculture
USA: United States of America
Wa: Water
WUE: Water Use Efficiency
ABSTRACT
CHAPTER ONE
INTRODUCTION
1.1. Background
Agriculture remains vital for Africa as over 60% of African population depends on some form of farming for their nourishment and livelihoods (Diao et al., 2010). Indeed the sector is important for the continent‘s development and economic growth (Gollin, 2014). Therefore, efforts to reduce poverty in Africa must pay particular attention to the agricultural sector. In Rwanda, besides agriculture‘s contribution to GDP, the sector typically generates about 90% of employment (especially for women), about 70% of export revenues and about 90% of national food need (Cantore, 2011a). Attempts to increase agricultural production and food consumption are destabilized by rapid population growth (Boserup, 2005). Consequently, crop productivity is declining (Kelly et al., 2001; Cantore, 2011b) as a result of intensive farming, which leads to soil degradation through erosion and declining soil fertility (Kagabo et al., 2013). In 2007 Crop Intensification Program (CIP) policy in Rwanda was started with its aim to boost agricultural productivity through an improvement of productive inputs use, irrigation and rainwater use efficiency and soil quality (Cantore, 2011a). To date, however, expected potential increase in production has not been attained probably due to low soil fertility, low fertilizer response and rainfall variability.
nutrient mining, soil erosion, and unequal soil fertility replenishment within family fields have been reported to contribute to soil fertility depletion by several researchers (Mtambanengwe and Mapfumo, 2005; Bationo et al., 2007; Kimetu et al., 2008; Vanlauwe et al., 2010). The rate of fertility depletion in Rwanda is very high. The annual loss of nutrients is estimated to exceed 40 kg N ha-1, 6.6 kg P ha-1, and 33.2 kg K ha-1 (Nabahungu, 2012).
Climate variability is expected to affect adversary the agricultural production in Africa (Lybbert and Sumner, 2012; Bryan et al., 2013). Concerns that climate variability, will have an adverse impact on the livelihoods of the rural poor in developing countries have been raised (Below et al., 2010). Due to heavy dependence on rain fed agriculture (Lybbert and Sumner, 2012), the effects of climate variability are expected to be particularly prominent (Lybbert and Sumner, 2012). For example, in drought prone areas like Bugesera, frequent droughts lead to significant reduction in crop yields while delayed onset of ins is reported to affect the timing of farm operations (e.g. opening up of seedbeds and beginning of planting) which shortens the crop growing season and hence resulting into poor crop yields (Rwanyiziri and Rugema, 2013).
low rainfall areas (Below et al., 2010; Hobbs and Govaerts, 2010). In high rainfall areas of Rwanda, the soils are susceptible to soil erosion and experience fertility decline (Kagabo et al., 2013) while in low rainfall areas (East) crops fail due to water related stresses (Verdoodt and Van Ranst, 2003).
The increase in soil moisture as a result of CA has a potential of enabling crops to surmount seasonal dry spells, mitigate the effects of drought and rainfall variability and reduce the risk of crop failure (Thierfelder and Wall, 2010). Conservation agriculture has significant potential to improve rainfall-use efficiency through increased water infiltration and decreased evaporation from the soil surface, with associated decreases in runoff and soil erosion (Thierfelder and Wall, 2009). However, decreased yield observed in early years of conservation agriculture application, weed management that requires herbicides application and lack of mulch due to priority given to feeding of livestock constrains its adoption (Giller et al., 2009). Several researchers conclude that, CA is a system approach to sustainable agriculture (Chivenge et al., 2007; Govaerts et al., 2009; Mkoga et al., 2010; Li et al., 2011; Mrabet et al., 2012). There is still limited information on how CA techniques can best be targeted for desired impact in low rainfall areas of Rwanda. Hence, need to assess potential benefits of conservation agriculture in Bugesera District of Rwanda.
1.2 Problem Statement
declining largely because of recurrent water scarcity occasioned by erratic and unreliable precipitation coupled with high evapotranspition. Soil fertility decline is attributed to nutrients mining over a long time through crop components harvests and feeding of residues to livestock without balanced replenishment. In addition, soil disturbance though conventional tillage, has been reported as, among others, a cause of land degradation through increased soil structure destruction and organic matter depletion (Baker et al., 2007) which have effect on physical, chemical and biological soil degradation (Thierfelder and Wall, 2009).
Removal of crop residues from the fields, coupled with conventional tillage, is known to hasten soil organic carbon decline,an important determinant of soil fertility (Chivenge et al., 2007). Therefore copping strategies which can alleviate the effects of erratic rainfall and reverse soil fertility decline are desired in order to increase and sustain agricultural productivity. There is big effort to disseminate conservation agriculture (CA) practices for sustainable land use management in SSA but little is known on the effect of CA on agricultural productivity under the prevailing agro-ecological conditions in Rwanda. Hence, this research sought to assess the effects of CA on bean and maize yield, soil properties and water use efficiency in Bugesera district.
1.3 Objectives
1.3.1 Specific objectives are:
i. To determine the effects of tillage methods, residues application and fertilizer use on maize and bean yields.
ii. To evaluate the effects of tillage methods, residues application and fertilizer use on soil properties; Organic carbon, total Nitrogen, CEC, available P and soil pH. iii. To assess the effects of tillage methods, residues application and fertilizer use on
soil infiltration rate and maize and beans water productivity.
iv. To evaluate the potential long term effects of residues application and fertilizer use on maize yield and water productivity under simulated depressed rainfall regimes.
1.3.2 Research hypothesis
i. Tillage methods, residue application and fertilizer will not increase beans and maize yield.
ii. Tillage methods, residue application and fertilizer will not result in improved soil properties (Organic carbon, total Nitrogen, CEC, available P and soil pH).
iii. Tillage methods, residue application and fertilizer will not increase infiltration rate and bean and maize water productivity.
iv. Residues application and fertilizer will not result in stabilized maize yield and water productivity under simulated reduced daily rainfall by 10%.
1.5 Justification of the study
country are generally food insecure mainly due to low and erratic rainfall. In spite of the tremendous potential for crop and livestock farming, the current agricultural productivity levels remain low (Diao et al., 2010). In light of growing concerns over the implications of many conventional agricultural practices, and especially the conventional tilling of soils, which leads to reduced soil productivity and wider environmental implications (Knowler and Bradshaw, 2007), conservation agriculture, as a concept for land management with agronomic, economic, environmental and social benefits has been found to improve soil productivity (Sanginga and Woomer, 2009). This study is in line with Crop Intensification Program for Rwanda whose major goal is to guarantee food security and strengthen the country‘s agricultural productivity through an improvement of inputs use, irrigation, rainwater use efficiency and soil quality (Cantore, 2011a).
1.6 Significance of the study
reference for further research related to development of strategies for climate change adaptation and mitigation with minimized negative effect to the environment.
1.7 Conceptual framework
Figure 1: Conceptual framework (Kabirigi, 2015).
CHAPTER TWO
LITETURE REVIEW
2.1 Background information on conservation agriculture
Conservation agriculture is defined as minimal physical disturbance of soil through zero or minimum tillage, maintaining permanently soil cover by either growing crop or dead mulch and diversifying crop sequences and pattern as crop rotation and/or intercropping (Giller et al., 2009; Sanginga and Woomer, 2009). As defined by Friedrich et al. (2009), CA is a concept for resource-saving agricultural crop production that strives to achieve acceptable profits together with high and sustained production levels while concurrently conserving the environment. Conservation agriculture originated in the USA in the 1950s and from then until 2007 the USA had the largest area under no-till worldwide (Kassam et al., 2009) while Asian and African countries started to take up CA practices only in the last 10-15 years (Friedrich et al., 2009).
Several researchers have concluded that CA is a system approach for sustainable agriculture in Latin America, Asia and Africa (Chivenge et al., 2007; Govaerts et al., 2009; Mkoga et al., 2010; Li et al., 2011; Mrabet et al., 2012). There is increasing awareness all over the world of the negative effects of conventional agriculture and the need to change tditional agricultural practices (Baker et al., 2007; Morris et al., 2010). And embce conservation agriculture.
al., 1996; B. Singh and Malhi, 2006). This is primarily due to soil erosion and the loss of organic matter associated with conventional tillage practices (Chivenge et al., 2007), which leave the soil bare and unprotected in times of heavy infall, wind and heat (Derpsch, 2003). Thus, Zero-tillage was born out of a necessity to combat soil degdation and has been widely adopted by farmers at different scales (Kassam et al., 2009).
2.2. Tillage method and environment
Conventional tillage has attributed to land degdation (Morris et al., 2010). This is due to farming practices such as; ploughing that destroys the soil structure and degrades organic matter, burning or removing crop residues, monocropping, and so on (Rusinamhodzi et al., 2011). In addition to the emissions directly from the farm equipment, convetional tillage also leads to increases carbon dioxide levels in the atmosphere (Chivenge et al., 2007).
Cropland soils are ideal for use as a carbon sink, since they have been depleted of carbon in most areas (Hobbs and Govaerts, 2010). It is estimated that enormous carbon that was tpped in the soil has been released because of tillage (Håkansson, 1994; Balesdent et al., 2000; Six et al., 2004). Conventional farming practices that rely on tillage have removed carbon from the soil ecosystem by removing crop residues such as left over maize stalks (Baker et al., 2007). Conservation Agriculture can give farmers a means of conserving, improving and making more efficient use of their natural resources.
2.3. Crop residues application and Soil quality
Soil organic matter (SOM) is an important determinant of soil fertility, productivity and sustainability, and is a useful indicator of soil quality in the tropics (Chivenge et al., 2007). Residue retention and reduced tillage are both conservation agricultural management options that may enhance soil organic carbon (SOC) and soil aggregate stabilization in tropical soils (Chivenge et al., 2007). In extremely degded soils there is low recycling of nutrients during the decomposition of organic matter, and low biological activity (small quantity of microorganisms)(Janssen, 1996).
soil in the form of organic matter which is a key factor in binding soil particles together leading to improved soil structure.
Crop residues left intact help both natul precipitation and irrigation water infiltte the soil where it can be used (Friedrich et al., 2009). Crop residue left on the soil surface also reduces soil water loss through evaporation hence conserving water for plant growth (Thierfelder and Wall, 2009).
2.4. Conservation Agriculture and Climate variability Adaptation
Agricultural production, including access to food in many African countries, is projected to become severely compromised by rainfall variability (Cooper et al., 2008; Below et al., 2010). This arises from the fact that African agriculture is mainly in-fed, and the areas suitable for agriculture, the length of growing seasons and yield potential, particularly along the arid and semi arid areas, are all expected to decrease (Thornton et al., 2010). In this case, adaptation is a key factor that will shape the future severity of climate change impacts on food production (Lobell et al., 2008).
Producers will find that the benefits of CA will come rather late than sooner (Chivenge et al., 2007; Thierfelder and Wall, 2009) since CA takes time to build up enough organic matter and have soils become their own fertilizer. This process does not start to work over night. But if producers make it through the first few years of production, results will start to become more satisfactory (Giller et al., 2009).
Improved soil quality and improved nutrient cycling, with CA, will improve the resilience of crops to adapt to changes in local climate change while drought tolerance can be increased in some areas with CA (Hobbs and Govaerts, 2010). Thierfelder and Wall (2009) concluded that conservation agriculture benefit more in areas where soil moisture is a limiting factor like in Bugesera district of Rwanda.
2.5. The trade-offs of implementing CA
At farm and village levels, trade-offs in the allocation of resources become important in determining how CA may fit into a given farming system (Giller et al., 2011). There are many reasons why conservation agriculture cannot always be a win-win situation. Since CA is based upon establishing an organic layer and producing its own fertilizer, then this may take time to produce that layer (Thierfelder and Wall, 2009). It can be many years before a producer will start to see better yields than he/she has had previously before.
fertilizer, not tilling of ground and among other processes that come with the responsibility to feed the world. With this in mind, comes the responsibility for producers to increase food supply with the same or even less amounts of land.
Problems arise in the fact that if farms do not produce as much as conventional ways, then this leaves the world with less food. While benefits of CA are most directly attributed to the mulch of crop residues applied in the field, limited availability of crop residues in many farming conditions is an issue because of priority given to livestock feeding, used as fuel and as construction materials (Giller et al., 2009).
2.6. Conservation agriculture for improved agricultural water productivity
The majority of the world‘s rural poor people depend on in fed crop and livestock systems for their food and incomes (Wallace, 2000). Rain-fed agriculture will continue to play a critical role in future food needs despite the increasing population that is causing pressure particularly in Africa (Rockström et al., 2003; Rockström et al., 2010). However, in fed agriculture in semi-arid and arid regions is highly variable and unpredictable due to erratic rainfall, and with structurally unstable soils leading to low overall productivity (Jat et al., 2012).
for the necessity to focus on water productivity (WP) mostly in in-fed agriculture (Sidhu, 2014).
Water productivity or use efficiency is used exclusively to denote the amount or value of product over volume or value of water depleted or diverted (Molden et al., 2010). It expresses the amount of marketable product (e.g. kilograms of grain) in relation to the amount of input needed to produce that output (cubic meters of water) (Rockström et al., 2003). Water productivity is a key parameter when assessing the performance of irrigated and in fed agriculture since water is generally considered to be an important factor limiting yields (Sidhu, 2014).
Increasing WP is particularly appropriate where water is scarce and it is very important for increasing the productivity and sustainability of in fed cropping systems of poor smallholder farmers (Sidhu, 2014). However, rainfall variability coupled with dry spells and droughts in between have been identified as main factors that lower yield and rainwater productivity in many in fed environments (Howden et al., 2007). Furthermore rainfall variability and the frequency of extreme events are likely to increase in the future as a result of climate change (Cooper et al., 2009). In addition, conventional farming system based on soil inversion using plough and hoe, contributes to soil erosion and soil desiccation thus reducing water productivity (Rockström et al., 2003).
Conservation farming based on non- inversion tillage systems from zero-tillage to reduced tillage have been recommended in maximizing soil infiltration and reducing soil erosion while conserving energy and labor (Su et al., 2007). Moreover mulch cover provides benefits in improved water infiltration and reduces soil surface evaporation especially under dry or moisture‐limited conditions (Turmel et al., 2014).
2.7. Modeling conservation agriculture
Experiments to study long term effects of conservation agriculture options are lacking because they are expensive and cannot be easily managed. Fortunately crop simulation models, like Agricultural Production Systems Simulator (APSIM), have the ability to use long term weather data and the local soil parameters to assess the long term potential effects of conservation agriculture practices (Mkoga et al., 2010).
Agricultural Production Systems Simulator (APSIM) is a detailed mechanistic crop growth model used to generate parameters and variables that can be introduced as descriptive functions in NUANCES-FIELD (Chikowo et al., 2008). APSIM allows users to improve understanding of the impact of climate, soil types, and management on crop and pasture production. It is a powerful tool for exploring agronomic adaptations such as changes in planting dates, cultivar types, fertilizer/irrigation management, etc (MacCarthy et al., 2010).
where there is interest in the economic and ecological outcomes of management practice in the face of climatic risk (Keating et al., 2003).
APSIM is a dynamic crop growth model that combines biophysical and management modules within a central engine to simulate cropping systems (MacCarthy et al., 2010). It is a modeling framework with the ability to integrate sub-models derived in fragmented research efforts (Dimes et al., 2003). This enables research from one discipline or domain to be transported to the benefit of some other discipline or domain. It also facilitates comparison of models or sub-models on a common platform (Chikowo et al., 2008). This functionality uses a ―plug-in-pull-out‖ approach to APSIM design.
The user can configure a model by choosing a set of sub-models from a suite of crop, soil, and utility modules (Chikowo et al., 2008). Any logical combination of modules can be simply specified by the user ―plugging in‖ required modules and ―pulling out‖ any modules no longer required. Its crop simulation models share the same modules for the simulation of the soil, water, and nitrogen balances (Keating et al., 2003).
CHAPTER THREE
MATERIALS AND METHODS
3.1 Study area
The study was implemented in Bugesera District in Rwanda (Figure 2). It is located in Eastern Rwanda and has a population of approximately 266,775 people (138,723 female and 128,052 male) and an area of 1,290 km2. Administratively, the district is divided into 15 sectors. The district has gentle topography and lies between 1,290 m and 1,524 m above sea level with annual average temperature and rainfall of 21.4ºC and 854 mm, respectively. Agriculture in the districts is of subsistence nature and largely characterized by low landholding size (0.75 ha on average) due to high population density. The area is characterized by a long dry season of 3-4 months. The soil in that area are classified under oxisols according USDA classification and are clay sandy and Loam sandy in texture (Munyabarenzi, 2014). In comparison to other regions of Rwanda, the Bugesera district is regarded as one of the drought-prone regions, experiencing frequent rainfall deficit and a significant number of dry spells (Benimana et al., 2015). While the causes of food insecurity in other areas have been identified as land degradation (e.g. low soil fertility and soil erosion), in Bugesera, the main factor is unpredictable and inadequate rainfall, which is linked to prolonged drought (Jean-fiston et al., 2014).
Figure 2: Location of research site with dominant soil (CM= CAMBISOLS, FR=FERRALSOLS, GL=GLEYSOLS, HS=HISTOSOLS, Wa=Water).
3.2 Experiment set up
Table 1: Treatments structure, combination and initialization
Treatment Input management Tillage
T1 No input Zero Tillage
T2 Residues application Zero Tillage
T3 Residues application and Inorganic Fertilizers Zero Tillage
T4 Inorganic fertilizers Zero Tillage
T5 No input Conventional tillage
T6 Residues application Conventional tillage
T7 Residues application and Inorganic Fertilizers Conventional tillage
T8 Inorganic fertilizers Conventional tillage
3.2.1 Experimental design and layout
The experimental design was Split Plot with 4 replications. The main plot was tillage system while sub plot was surface management (with or without residue cover) with or without inorganic fertilizers. Main plots and sub plot treatments were combined and randomly assigned to plots within blocks. Blocking was done based on the field terrain/slope.
3.2.2 Test crops, Residues and fertilizers application
residues in the plots with maize as the test crop. This hold that a crop use residues of previously harvested crop when rotation is considered thus, in the case of this study rotation of beans with maize is considered. The average of 3t/ha of residues were applied considering the average produced according to literature (Munyabarenzi, 2014).
3.2.3 Experiment data collection
Germination rate, Dates of flowering, podding, senescence and harvest for both maize and beans were assessed. Yield parameters taken included, number of plants harvested/stand count, weight of above ground dry biomass yield, weight of dry grain yield and weight of 1000 grains for both Maize and Beans and grain moisture content. The whole plants on the plots were harvested, except for the border rows, by cutting at the ground level and weighed as fresh weight. A sample of 10 cobs of maize was taken, weighted as fresh weight, dried and the dry weigh was taken of both cobs with grain and grain after separation. Beans grain were separated, weighted as fresh dried and dry weight was taken. A sample of above ground biomass was taken for both maize stover and beans residues and dried to obtain difference in moisture which further was used to determine biomass yield.
3.3 Soil sampling
3.4 Rainfall measurements
Daily rainfall data were taken using Rain Gauge Smart Sensor of HOBO automatic weather station installed in RAB Karama research station. The Rain Gauge smart sensor is designed to work with the HOBO Weather Station logger. The smart sensor has a plug in modular connector that allows it to be added easily to a HOBO Weather Station. All sensor parameters are stored inside the smart sensor, which automatically communicates configuration information to the logger without the need for any programming or extensive user setup. The Rain Gauge smart sensor measures rainfall by counting the number of tips per recorded measurement. The Rain Gauge smart sensor counts up to 4000 tips per logging interval (40 inches or 80 cm of rain).
3.5 Soil analysis
Table 2: Methods of soil analysis
Soil properties Parameters to
identify
Methods to be used
Soil chemical properties
Soil organic C Organic Carbon was determined by wet oxidation with heated acidified dichromate followed by colorimetric determination of Cr3+ following the modified Walkley Black method (Skjemstad and Taylor, 1999)
Soil CEC Soil Cation Exchange Capacity (CEC) was determined using ammonium acetate saturation method (Kitsopoulos, 1999)
P content The P was determined using Mehlich III method (Sims, 2000)
Total N N was determined using Kjeldahl method (Bremner, 1960)
Soil pH Soil pH water was determined using a pH meter in 1:2.5 soil: water suspensions (Thunjai et al., 2001)
Soil physical properties
Soil texture The soil texture was determined using hydrometer method (Bouyoucos, 1962) followed by USDA textural class triangle
3.6 Water productivity Determination
Eq 1
Eq 2
Where: is the effective rainfall (mm) P is the gross monthly rainfall (mm)
Water productivity was calculated using equation 3.
Eq 3
In a long term simulation of the effect of residues on maize yield and water productivity with reduced daily rainfall by 10% (See 3.7.1) water productivity was calculated using equation 4.
Eq 4
3.7 Infiltration rate measurement
disturbance while measuring infiltration rate, only two reading were taken. One reading was taken at the sampling time before applying treatments to make an average of infiltration rate of the block and the reading of each plot was taken at harvest period after the second season.
3.8 Modeling: APSIM
The calibrated and validated APSIM model was used in long-term simulation of tillage system and residues on maize yield. Simulation focused on changes in maize yield with the decrease by 10% of daily rainfall. This was done in management modules, climate control simulation which is incorporated in APSIM model. The simulation was done for the period of 1962 to 2010 considering only long in season (September to January)
3.8.1 Choice of scenario
3.8.2 APSIM Model Parameterization
The key inputs are Soil properties, daily climate data, cultivar characteristics, and agronomic management. APSIM requires daily values of rainfall, maximum and minimum temperature and solar radiation. Climatic data for Bugesera were obtained from Rwanda national meteorological service while soil properties were extracted from soil map using ArcMap tool (attribute table) as it is shown in table 3. The soil dominant in Bugesera district is Xanthic Ferralsols according to FAO soil classification (Figure 2). The maize variety used was Katumani which is suited for Bugesera district. Agronomic management options were tillage systems, Residues application as mulch with or without inorganic fertilizer.
Table 3: An example of some soil properties used for specifying APSIM simulations
Soil layer 1 2 3 4 5 6 7 8
Soil water parameters
Bulk density(km_3) 1.52 1.54 1.51 1.44 1.35 1.35 1.35 1.35 Saturated water content(m3m_3) 38.2 38.9 39.9 42.6 45.9 45.9 45.9 45.9 Field capacity(m3m_3) 30.9 32.3 35.8 41.2 44.3 44.3 44.3 44.3
Wilting point(m3m_3) 19.9 22.2 24.9 29.4 32 32 32 32
SWCON 0.45 0.3 0.3 0.3 0.3 0.3 0.3 0.3
Soil N parameters
Organic C (gkg_1) 0.89 0.825 0.57 0.47 0.31 0.31 0.31 0.31
F inertb 0.04 0.02 0.01 0.01 0.01 0.01 0.01 0.01
Table 4: Cultivar parameters
Parameter or variables Acronym Value Units
Emergence - end juvenile tt_emerg_to_endjuv 150 0C days
Flag leaf - Flowering tt_flag_to_flower 10 0C days
Flowering - Start grain filling tt_flower_to_start_grain 120 0C days
Flowering - Maturity tt_flower_to_maturity 660 0C days
Maturity - Harvest-ripe tt_maturity_to_ripe 1 0C days
Genetic
Cultivar name name katumani
Potential grain number per head head_grain_no_max 450 ginsgin−1
Potential grain growth te gin_gth_te 10.5 mghead−1day−1
Table 5: Initial Soil Organic Matter Status
Layer Hum-C Hum-N Biom-C Biom-N FOM-C FOM-N
(kg/ha) (kg/ha) (kg/ha) (kg/ha) (kg/ha) (kg/ha)
1 19823.7 1982.4 468.3 58.5 138.9 3.5
2 18908 1890.8 149.5 18.7 108.1 2.7
3 25795.4 2579.5 25.6 3.2 65.6 1.6
4 20302 2030.2 2 0.3 39.8 1
5 12553.8 1255.4 1.2 0.2 24.1 0.6
6 12553.8 1255.4 1.2 0.2 14.6 0.4
7 12553.8 1255.4 1.2 0.2 8.9 0.2
Totals 122490.5 12249 649.1 81.1 400 10
Management module
Maize module
The maize module simulates the growth of a maize crop in a daily time-step (on an area basis not single plant). Maize growth in this model responds to climate (temperature, rainfall and radiation from the input module), soil water supply (from the soilwat module) and soil nitrogen (from the soil N module). The maize module returns information on its soil water and nitrogen uptake to the soilwat and soiln modules on a daily basis for the reset of these systems. Information on crop cover is also provided to the soilwat module for calculation of evaporation rates and runoff. Maize stover and root residues are ‗passed' from maize to the residue and soiln module respectively at harvest of the maize crop. A list of the module outputs is provided in the ‗Maize module outputs' section below, but basically the module will predict leaf area development, N% and biomass of stover; depth, N% and biomass of roots; grain N% and biomass; grain yield and N%, grain size and grain number all on a daily basis.
Soil-water module (Soilwat)
Modifications adopted from PERFECT include:
i. The effects of surface residues and crop cover on modifying runoff and reducing potential soil evaporation,
ii. Small rainfall events are lost as first stage evaporation rather than by the slower process of second stage evaporation, and
iii. Specification of the second stage evaporation coefficient (cona) as an input parameter, providing more flexibility for describing differences in long term soil drying due to soil texture and environmental effects.
The module is interfaced with the RESIDUE and crop modules so that simulation of the soil water balance responds to change in the status of surface residues and crop cover (via tillage, decomposition and crop growth).
Fertilizer, Manure and Soil Organic Matter (Residue) Modules
3.8.3 APSIM Calibration and validation
APSIM calibration was based on parameters collected from field experiment in season A2014. For model validation, examination and comparison of measured versus simulated parameter values were based on all the 8 treatments as described in Table 1. Simulated crop parameters were grain yield and total above ground biomass as influenced tillage and residues application (Conventional tillage (CT) or no tillage (NT), and Residues applied (RA) with or without inorganic fertilizers (IF).
3.9 Statistical Analysis
CHAPTER FOUR
RESULTS AND DISCUSSION
4.1 Overview of results presentation
This chapter presents the research findings from experiment and long term simulation using APSIM. The results are presented systematically starting with rainfall distribution in RAB Karama research station (Section 4.2); the effects of tillage method, residues application and fertilizers on beans and maize yield (Section 4.3); followed by the effects of tillage method, residues application and fertilizers on soil properties (Section 4.4); then the effects of tillage method, residues application and fertilizers on infiltration rate, beans and maize water productivity (Section 4.5) and finally, simulated of the long term effects of residues application on maize yield and water productivity under reduced rainfall scenarios (Section 4.6).
4.2 Rainfall distribution in RAB Karama research station
Figure 3: Cumulative daily rainfall during the study period (season 2014A and 2014B). Source: RAB Karama research station .
4.3 Effect of tillage method, residues application and inorganic fertilizers on beans
and maize yield
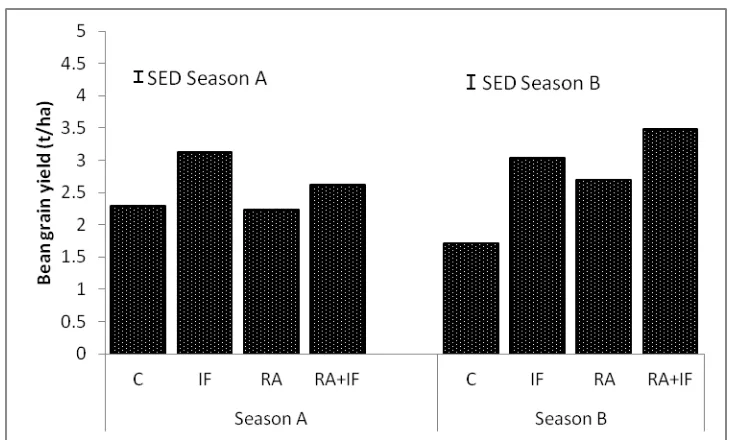
4.3.1 Effect of Residues application on beans grain and biomass yield
Figure 4: Effect of residues application on bean grain yield for season 2014A and season 2014B.
Where C=Control, RA= Residues applied, RA+IF=Residues applied with inorganic fertilizers, IF=Inorganic fertilizers
Figure 5: Effect of residues application on bean biomass yield for season 2014A and season 2014B.
Key: C=Control, RA= Residues applied, RA+IF=Residues applied with inorganic fertilizers, IF=Inorganic fertilizers
known to have high C/N ratio and its microbial decomposition can easily lead to nitrogen immobilization (Nicolardot et al., 2001; Bengtsson et al., 2003) caused by decomposing microorganisms using existing soil nitrogen thus depleting it in soils. According to Giller et al (2009), farmers without access to mineral fertilizer cannot compensate for such N deficiencies and are likely to suffer yield reductions. In the second season, the combination of residues and inorganic fertilizers resulted in 104% higher beans grain yield (3.478t/ha) compared to the control (1.708t/ha).
4.3.2 The effect of tillage method on grain and biomass yield of beans
There was a significant (P =0.027 ) effect of tillage method on bean grain and biomass yield in 2014 B where conventional tillage had 23% higher yield than no tillage (Table 6).
Table 6: The effect of tillage method on beans grain and biomass yield
Tillage practice Grain yield (t ha-1) Biomass yield (t ha-1)
2014A 2014 B 2014A 2014 B
Conventional Tillage 2.4a 3.01a 4.5a 5.6a
No tillage 2.7a 2.4b 5.02a 4.5b
SED 0.1762 0.1387 0.327 0.258
P value 0.21 0.027* 0.21 0.027*
2007; Giller et al., 2009; Giller et al., 2011) that the positive effect of conservation tillage (No tillage or minimum tillage) can be observed for long term experiments. But the study by Mupangwa and Jewitt, (2011) simulated the impact of no-till systems on field water fluxes and maize productivity under semi-arid conditions and observed 9% of simulated years cases of no tillage with higher grain yield compared to the conventional tillage system. Moreover Corbeels et al., (2014) highlighted that Conservation agriculture can increase crop yields but immediate yield benefits are highly variable, and are most likely to occur when crops are water-stressed like in Bugesera District.
4.3.3 The effect of tillage method and residues application on maize grain and
biomass yield
Table 7: The effect of tillage method and residues application on maize grain and biomass yield
Tillage Residues Grain yield Stover yield (t ha-1)
2014 A 2014 B 2014 A 2014 B
Conventional Tillage Control 1.8c 1.7a 3.1c 2.9a
IF 2.4b 1.3a 4b 2.2a
Residues 3.02a 2.3a 5.1a 3.9a
Residues+IF 2.1ab 2.4a 3.5ab 4.2a
No tillage Control 3.1ab 0.9a 5.2ab 1.6a
IF 3.3a 1.6a 5.6a 2.7a
Residues 2.3b 1.5a 3.9b 2.6a
Residues+IF 2.8ab 2.3a 4.8ab 3.9a
SED 0.2731 0.3252 0.465 0.554
P value 0.001* 0.145 0.001* 0.145
4.3.4 Effects of residues application on maize grain and biomass yield
There was a significant effect of residues application on maize grain and biomass yield in both seasons 2014A (p < 0.001) and 2014 B (p = 0.002) (Figure 6 and 7). Sole inorganic fertilizers had 16% increase of yield compared to control in season 2014A while residues application plus inorganic fertilizers had 77% higher maize grain yield compared to control for season 2014B. Control had the lowest yield of both grain and biomass, respectively in both 2014A and 2014 B.
Figure 6: Effect of residues application on maize grain yield for season 2014A and season 2014B
Figure 7: Effect of residues application on maize biomass yield for season 2014A and season 2014B.
Key: C=Control, RA= Residues applied, RA+IF=Residues applied with inorganic fertilizers, IF=Inorganic fertilizers
The increase in grain and biomass yield by 7% in inorganic fertilizers in no tillage suggests that, application of inorganic fertilizers in this poor soil availed plant nutrients which led to an increase yields under no till treatment. On the other hand, no tillage method can increase nutrients use efficiency due to soil moisture conservation attributed to permanent soil cover. Lower yield was observed in control for conventional tillage and in Residues application in no tillage.
The results observed were probably due to the effects of beans residues which has narrow C/N ratio compared to the maize stover thus; its decomposition is faster and leads to high nitrogen mineralization (Janssen, 1996; Nicolardot et al., 2001; Bengtsson et al., 2003). Tillage had a significant effect on maize yield whereby no tillage had high yield in the second season. This is contrary to most of the studies that indicate that conservation tillage will have a significant effect in long term (Araya et al., 2012; Mashingaidze et al., 2012). The early effects of tillage on yields can be attributed to the prevailing agro-ecological conditions in the study, hence the need for assessment and understanding the effects of conservation agriculture under different ecological and socio-economic conditions for smallholder farming in SSA (Giller et al., 2009) is justified.
4.3.5 The effect of tillage method on maize grain and biomass yield
Tillage significantly affected maize grain and biomass yield in both seasons A (p=0.003) and B (p=0.049) (Table 8). No tillage method recorded higher maize grain and biomass yield in season 2014A with 25% higher than conventional tillage method while in 2014B season conventional tillage had higher maize grain and biomass yield with 23% higher than no tillage method.
Table 8: The effect of tillage method on maize grain and biomass yield
Tillage practice Grain yield biomass yield (t ha-1)
2014A 2014 B 2014A 2014 B
Conventional Tillage 2.3b 1.9a 3.9b 3.3a
No Tillage 2.9a 1.6b 4.9a 2.7b
SED 0.0652 0.1123 0.111 0.191
P value 0.003* 0.049* 0.003* 0.049*
The effect of tillage observed on maize yield may be attributed to environmental conditions of the study site such as soil type, rainfall regime and previous agricultural practices. This is supported by Mupangwa and Jewitt, (2011) who simulated the impact of no-till systems on field water fluxes and maize productivity under semi-arid conditions and observed 9% of simulated years cases of no tillage with higher grain yield compared to the conventional tillage system.
interaction between Residues and tillage for maize grain and biomass yield whereby inorganic fertilizers increased yield in no tillage system while in conventional tillage system residues application with inorganic fertilizers had higher yield. This agreed with Bana and Prijono (2013) where tillage and mulching had increased significantly maize yield. Having higher yield in no tillage system with inorganic fertilizers gave an impression that no tillage can have greater yield in the first year of practicing but inorganic fertilizers must be added. This is in contrast to several studies that the effect of conservation tillage can be observed after long period of practice (Thierfelder and Wall, 2009; Rusinamhodzi et al., 2011).
4.3.6 The effect of residues application on beans and maize 1000 grain weight
Figure 8: Effect of residues application on beans 1000 grain weight for season 2014A and season 2014B
Key: C=Control, RA= Residues applied, RA+IF=Residues applied with inorganic fertilizers, IF=Inorganic fertilizers
Figure 9: Effect of residues application on maize 1000 grain weight for season 2014A and season 2014B
Key: C=Control, RA= Residues applied, RA+IF=Residues applied with inorganic fertilizers, IF=Inorganic fertilizers
in disagreement with (Khalid et al., 2014) who observed 1000-grain weight (g), and grain yield (kg ha−1) significantly higher in treatment with N input. However the high 1000 grain weight observed in residues applied with inorganic fertilizers is in line with the finding of the same author who observed the increase of 1000 grain weight of maize in no tillage treatments with retention of residues applied. According to Yadav and Meena (2014), 1000 grain weight can be increased with N application. Moreover, Gooding et al. (2003) highlighted that soil moisture also has a significant effect of grain quality. This suggests that the significant effect of Residues application on beans and maize 1000 grain weight may be associated with fertilizers application and soil moisture availability in conservation agriculture.
4.4 Effects of tillage method, residues application and inorganic fertilizers on soil
properties
4.4.1 Initial soil fertility status
Table 9: Soil fertility status before applying treatments
Parameter Units Baseline value
pH Water 5.96
Total N % 0.2
OC % 1.57
OM % 2.71
By 1 P ppm 3.16
CEC meq 7.7
sand % 62.18
silt % 17.1
clay % 15.72
Soil texture Sandy loam
Infiltration te cm/h 8.1
Bulk density gr/m3 1.46
4.4.2 Effect of tillage method and residues application on soil properties
4.4.2.1 Effect of tillage and residues application on organic carbon
Table 10: The effect of tillage method and residues application on organic carbon (%)
Tillage Residues Initial Final SA Changes SA T test Final SB Changes SB T test
CT Control 1.574 1.649a 0.0755 0.326NS 1.718ab 0.1445 0.044*
Residues 1.574 1.794a 0.2205 0.046* 1.764a 0.1905 0.013*
Residues+IF 1.574 1.719a 0.1455 0.382NS 1.555b -0.0185 0.838NS
IF 1.574 1.664a 0.0905 0.45NS 1.774a 0.2005 < 0.001**
NT Control 1.574 1.669a 0.0955 0.438NS 1.619a 0.0455 0.645NS
Residues 1.574 1.787a 0.2135 0.091NS 1.665a 0.0915 0.105NS
Residues+IF 1.574 1.911a 0.3375 0.005* 1.62a 0.0465 0.267NS
IF 1.574 1.694a 0.1205 0.26NS 1.654a 0.0805 0.012*
SED 0.178 0.0675
P 0.841 0.286
Increase of organic carbon in residues applied treatment is normal because of organic matter decomposition. This is confirmed buy results from Mehmood et al. (2014) who observed the significant effect of straw mulch and tillage on soil organic matter with a 22% increase in organic matter than in control in zero tillage. This is also in agreement with Khalid et al. (2014) who, however, according to his observation, in addition to the effect of residues, zero tillage alone accumulated higher organic matter than any other type of tillage.
Most of studies (Chivenge et al., 2007; Abrol and Sharma, 2012; Araya et al., 2012; Bayala et al., 2012) confirm the positive effect of residues on organic matter build up but (Ziadi et al., 2014) assessed the effect of tillage practices on soil organic carbon and recorded 17% of organic carbon accumulation in no tillage compared with conventional tillage. This is in contrast with Ziadi et al. (2014) who assessed tillage and synthetic fertilization affect on soil functioning and observed that synthetic fertilization increased the availability of nutrients, but no significant effect on the soil organic matter. Reasons for differing results can be due to differences in soil composition (texture and native organic matter content) as it is reported by Singh et al. (2014). Results of Hobbs (2007) suggest that no form of residue can increase soil organic carbon content as long as the soil is moldboard plowed. Hobbs (2007) argument is probably attributed to the fact that moldboard plowing leads to soil pulverization hence exposure of soil organic matter to oxidation process.
4.4.2.2 Effect of tillage method and residues application on CEC
tillage system was observed in inorganic fertilizers (5.3% higher than control) while in no tillage system the highest CEC was observed in residues (1.6% higher than control). Residues had the lowest CEC in conventional tillage while inorganic fertilizers had the lowest CEC in the season when the interaction was observed (2014B).
Table 11 highlights, as well, a high significant increase (p< 0.001) of CEC in all treatments. In season 2014A, in conventional tillage, the highest increase (p< 0.001) of CEC was in residues with inorganic fertilizers (+2.25meq) while the lowest increase of CEC was in inorganic fertilizers (+1.9meq). In season 2014A, in no tillage, the highest increase (p< 0.001) of CEC was in inorganic fertilizers (+2.525meq) while the lowest increase of CEC was observed in the control (+2.175).
Table 11: The effect of tillage method and residues application on CEC (meq)
Tillage Residues Initial Final SA Changes SA T test Final SB Changes SB T test
CT Control 7.7 9.725a 2.025 < 0.001** 9.1a 1.4 < 0.001**
Residues 7.7 9.725a 2.025 < 0.001** 8.95a 1.25 < 0.001**
Residues+IF 7.7 9.95a 2.25 < 0.001** 9.563a 1.863 0.005*
IF 7.7 9.6a 1.9 < 0.001** 9.588a 1.888 0.001*
NT Control 7.7 9.875a 2.175 < 0.001** 8.869b 1.169 < 0.001**
Residues 7.7 10.1a 2.4 < 0.001** 10.276a 2.576 < 0.001** Residues+IF 7.7 10a 2.3 < 0.001** 9.134b 1.434 < 0.001**
IF 7.7 10.225a 2.525 < 0.001** 8.719b 1.019 < 0.001**
SED Inter 0.4585 0.4411
P inter 0.848 0.032*
The highly significant increase in CEC can be associated by the increase in organic matter (organic carbon) this has also been discussed by Hastings et al. (2014). It is important to note that the role of tillage on soil nutrient levels is largely determined by the nature of each specific nutrient, and the impact that the changes in the soil environment have on its transformations (Selles et al., 2002). The contrasting results of CEC high in residues for no tillage and inorganic fertilizers in conventional tillage may be due to tillage-induced differences in thermal and physical conditions that affect root growth and distribution according to (Baker et al., 2007).
The amount of organic matter in a soil is often used as an indicator of the potential sustainability of a system. Soil organic matter plays a key role in nutrient cycling and can help improve soil structure. It has been discussed by Dorneles et al. (2015) that tillage and fertilization systems may affect soil fertility differently, as they observed the significant increase in CEC in no tillage treatment than in conventional tillage. The increase in CEC in residues is confirmed by Martinsen et al. (2014) who assessed the effect on crop yield and soil nutrients under conservation farming using carbonized biomass (biochar) and observed the increase in CEC in treatments with carbonized biomass.
4.4.2.3 Effect of tillage method and residues application on Nitrogen
depletion (-0.0686%) while residues with inorganic fertilizers treatment had the lowest depletion (-0.0561%) in season 2014A.
Table 12: The effect of tillage method and residues application on Nitrogen (%)
Tillage Residues Initial Final SA Changes SA T test Final SB Changes SB T test CT Control 0.1955 0.1269a -0.0686 < 0.001** 0.1338b -0.0617 < 0.001**
Residues 0.1955 0.1294a -0.0661 < 0.001** 0.1413b -0.0542 < 0.001** Residues+IF 0.1955 0.1394a -0.0561 < 0.001** 0.1344ab -0.0611 < 0.001** IF 0.1955 0.1331a -0.0624 < 0.001** 0.1456a -0.0499 < 0.001** NT Control 0.1955 0.1356a -0.0599 < 0.001** 0.1394a -0.0561 < 0.001** Residues 0.1955 0.1394a -0.0561 < 0.001** 0.1475a -0.0480 < 0.001** Residues+IF 0.1955 0.14a -0.0555 < 0.001** 0.1469a -0.0486 < 0.001** IF 0.1955 0.135a -0.0605 < 0.001** 0.1438a -0.0517 < 0.001**
SED Inter 0.00547 0.0034
P inter 0.584 0.06
The highly significant nitrogen decrease may be attributed to the crop N uptake as well as organic matter mineralization since it is required for both crop growth and microbial activities. The process is known as Nitrogen immobilization and have been described by (Verhulst et al., 2014) as the removal of inorganic N from the soil solution by microorganisms. These microorganisms break down crop residues with a high C/N ratio and satisfy their energy demands by utilizing the residue carbon components. However, microorganisms also use the available crop residue and fertilizer N to form proteins for their own growth.
It have has discussed by Giller et al. (2009) that large amounts of cereal residues with a high C:N ratio that are left on the soil surface temporarily result in a net immobilization of mineral N in the soil. This has been confirmed by Baudron et al. (2014) who discussed the negative effect on cotton yield by greater quantities of mulch without N fertilization due to N immobilization in the soil microbial biomass.
nitrogen based fertilizers in a conservation agriculture treatments. The no interaction between tillage and residues in this study contrast with Mehmood et al. (2014) who observed a significant interaction effect of tillage and mulch whereby in zero tillage straw mulch had 30% increase in nitrogen compared to control, while in minimum tillage straw mulch had 16% increase in nitrogen compared to control and in conventional tillage straw mulch had only 9% increase in nitrogen compared to control.
4.4.2.4 Effect of tillage method and residues application on Available phosphorous
There was no interaction effect of tillage and residues on available P (Table 13). There was a significant (p=0.034) decrease of available P in control (-0.53ppm), a significant increase (p=0.048) of available P in residues (+0.42ppm) and a highly significant increase (p<0.001) of available P in inorganic fertilizers (+0.70) in conventional tillage in season 2014A. Also in season 2014A in no tillage there was a significant increase (p=0.033ppm) of available P in residues with inorganic fertilizers (+0.75ppm) and a highly significant increase (p< 0.001) of available P in inorganic fertilizers (+1.67ppm). The decrease observed in control and in residues in no tillage, in season 2014A was not significant.
Table 13: The effect of tillage method and residues application on available P (ppm)
Tillage Residues Initial Final SA Changes SA T test Final SB Changes SB T test
CT Control 3.16 2.627b -0.53 0.034* 4.204a 1.05 0.007*
Residues 3.16 3.572ab 0.42 0.048* 4.82a 1.66 0.004*
Residues+IF 3.16 3.861ab 0.70 0.001* 4.542a 1.39 < 0.001**
IF 3.16 4.894a 1.74 < 0.001** 4.337a 1.18 0.009*
NT Control 3.16 3.041b -0.12 0.718NS 4.037ab 0.88 0.002*
Residues 3.16 2.956b -0.20 0.416NS 4.726a 1.57 0.004*
Residues+IF 3.16 3.91a 0.75 0.033* 4.537bc 1.38 0.001*
IF 3.16 4.822a 1.67 < 0.001** 3.692c 0.54 < 0.001**
SED Inter 0.4901 0.3175
P inter 0.265 0.265
The results show no significant interaction effect between tillage and residues application on available P. This was also reported by Mehmood et al. (2014) who however, observed an increase in available P in zero tillage without straw mulch which is not the case in this study. The significant increase in available P in residues and residues with inorganic fertilizers is in close agreement with Dorneles et al. (2015) who evaluated tillage, fertilization systems and chemical attributes of a Paleudult and observed the increase of available P with organic fertilization (which can be compared to residues retention) than with mineral fertilizers.
According to Veenstra et al. (2006) conservation tillage usually improves the availability of surface phosphorus by converting it into organic phosphorus. The same author observed also the increase of available P in conservation tillage with residues retention which is in agreement with the results of this study. The results of this study contrasted with López-Fando and Pardo (2009) who evaluated Changes in soil chemical characteristics with different tillage practices in a semi-arid environment and observed high concentration of P in no tillage when compared with conventional tillage.
4.4.2.5 Effect of tillage method and residues applicationon soil pH
Table 14: The effect of tillage method and residues application on soil pH
Tillage Residues Initial Final SA Changes SA T test Final SB Changes SB T test
CT Control 5.96 6.101ab 0.136 0.003* 6.283b 0.318 0.023*
Residues 5.96 6.271a 0.306 0.003* 6.072b 0.107 0.249NS
Residues+IF 5.96 6.183a 0.218 0.026* 6.605a 0.640 < 0.001**
IF 5.96 5.913b -0.052 0.584NS 6.218b 0.253 0.009*
NT Control 5.96 6.1a 0.135 0.109NS 6.367a 0.402 0.022*
Residues 5.96 6.255a 0.290 0.013* 6.444a 0.479 0.249NS
Residues+IF 5.96 5.926a -0.039 0.638NS 6.334a 0.369 0.002*
IF 5.96 6.07a 0.105 0.228NS 5.978a 0.013 0.92NS
SED Inter 0.0984 0.1237
P inter 0.086 <.001**
The results showed a significant interaction between residues and tillage on soil pH. This is confirmed by the findings of Dorneles et al. (2015) who observed the same interactions. However they also observed increase in soil pH in plots under mineral fertilization which is contrary with current results. Having high soil pH in residues is in agreement with Ogbodo (2011) who observed the increase in rice straw mulch and in Burnt Rice Husk when compared to the control or no residues application.
It is clear that residues have an effect on soil pH and this is supported by the results of Zhou et al. (2014). It has been observed by Rahman et al. (2008) that there is no significant differences in soil pH among no tillage and conventional tillage practices. However, Kirkegaard et al. (2014) observed the significant increase of soil pH in no tillage when compared to conventional tillage. According to Conant et al. (2011) soil properties that affect rate of residue decomposition such as texture, moisture content, temperature, available N, SOC and initial pH control the effect of residue on soil pH.
4.4.3 Effect of residues application on soil properties
In season 2014A, residues had significantly (p<.001) affected available P (Table 15) whereby available P was high in residues with inorganic fertilizer (71% higher than control) and low in control (2.834). In the same season 2014A also, the residues had significantly (p=0.013) affected pH whereby the highest soil pH was in residues (2.6% higher than control) and the lowest was in inorganic fertilizers (5.991).
Table 15: Effect of residues application on soil properties for 2014A and 2014 B Residues
application
Organic C (%) Total N (%) CEC (meq) Available P (ppm) pH
2014A 2014B 2014A 2014B 2014A 2014B 2014A 2014B 2014A 2014B