OPTICAL EXCITATION AND SENSING
OF
STRUCTURAL VIBRATION
A thesis submitted by
A L E K S E I R Y B K I N
for
the degree of
Master of Science
Optical Technology Research Laboratory
Victoria University of Technology
"4 Y8AB3..! "M*
'••> * #>
/, Aleksei Rybkin, declare that the thesis titled,
REMOTE OPTICAL EXCITATION AND SENSING OF STRUCTURAL
VIBRATION, is my own work and has not been submitted previously, in whole or
in part, in respect of any other academic award.
I would most like to thank my supervisor, former Director of Optical Technology
Research Laboratory at Victoria University of Technology, Professor David Booth,
for guidance, support and discussion in all matters of this research. I would like to
thank my former supervisor Dr. Nigel Perry for guidance and encouragement at the
early stage of this work. I wish to thank all the other academics, technicians,
administrative staff and fellow postgraduate students in the department for their
willing assistance and friendship.
1 am grateful to Victoria University of Technology for the provision a Postgraduate
Scholarship.
Finally, I would like to pay tribute to my family for their understanding and support
This thesis is concerned with non-contact techniques for optical excitation of
mechanical vibrations in structures and with the use of non-contact fibre optic
interferometers for the measurement of parameters which characterise these
mechanical vibrations. Taken together, the excitation and sensing systems provide
a method for fully remote non-destructive testing (NDT) of structures, which can
sense changes in any parameter which affects the vibrations. The technique is
applicable to a wide range of structures but is particularly suitable for use with
delicate structures or structures for which the use of conventional excitation and
sensing techniques would load the structure and modify the parameters being
measured. The ultimate usefulness of this NDT technique depends on the accuracy
with which important vibrational parameters such as resonant frequency and
damping can be measured.
In this thesis, transverse mechanical vibrations are thermoelastically excited in
structures using sinusoidally modulated 800 nm laser diodes with peak-to-peak
powers of the order of 25 mW. The vibrations are sensed using a modified form of
a fibre optic Mach-Zehnder interferometer, which uses a 2 mW He-Ne laser source.
The interferometer senses changes in optical path between the partially reflecting
unpolished surface of the vibrating structure and the end of an optical fibre placed
cantilever) under three separate environmental noise conditions. Data was collected for the resonant frequency and also for the related loss-dependent parameters of half-power bandwidth and damping factor for the first 5 vibrational modes. A number of ways of making these measurements were tried and the
advantages and disadvantages of each were identified. The thesis identifies the accuracy with which each of the vibrational mode parameters can be determined
Page
Declaration i
Acknowledgments n
Abstract m
Table of Contents v
Chapter 1: Introduction
1.1 Non-destructive testing of structures 1-2
1.2 Vibration analysis in N D T 1-3
1.3 T h e excitation of mechanical vibrations using laser sources 1-6
1.4 T h e A i m of the research 1-8
Chapter 2:Review of previous work and vibration analysis
background
2.1 Introduction 2-2
2.2 S u m m a r y of previous works 2-3
2.3 Sensing systems 2-10
2.4 Thermoelastic bending of a structure 2-17
2.5 Vibration analysis background 2-19
2.5.1 Differential equation of motion for elastic bar 2-22
2.5.1.1 Resonance frequency and temperature shift 2-28
2.5.2 Equation of motion for Single Degree of Freedom structure 2-29
2.5.2.1 Response function for Single Degree of Freedom system.... 2-34
Page
3.1 Introduction 3-2
3.1.1 T h e set-up diagram and description 3-2
3.2 Optical excitation system 3-4
3.2.1 Diode Laser for photothermal excitation of vibrations 3-4
3.2.2 P o w e r Supply and Temperature Controller 3-5
3.3 Optical detection system 3-8
3.3.1 Interferometric sensor and h o m o d y n e technique 3-9
3.3.2 Signal processing 3-14
3.3.3 Detection electronics circuitry and feedback control
operation 3-15
3.4 T h e Interferometer calibration procedure and performance 3-19
Chapter4\ Experimental results and discussion
4.1 Introduction 4-2
4.1.1 Response function in vibration analysis and processing of
measured data 4-3
4.1.2 The accuracy of resonant frequency measurement 4-4
4.2. Description of the procedure used for measurements 4-6
4.3 Response measurements with a rigid cantilever securely fastened
to the mounting bench 4-10
4.3.1 Response measurements under favourable laboratory
(Conditions A ) 4-11
4.3.1.1 Resonance measurements for M o d e l 4-12
4.3.1.2 Resonance measurements for M o d e s 2-5 4-19
4.3.1.3 Vibration parameters obtained using Lorentzian fits for
M o d e s 1-5 4-24
4.3.1.4 Decay time measurements by waveform sampling:
changes 4-35 4.3.2 Daytime measurements under less favourable laboratory
conditions (Conditions B a n d C ) 4-36 4.4 Measurements with increased damping 4-44
4.5 S u m m a r y 4-50
Chapter5: Conclusion
5.1 Conclusion 5-2
List of symbols
S1INTRODUCTION
Content: Page
1.1 Non-destructive testing of structures 1-2
1.2 Vibration analysis in N D T 1-3
1.3 Excitation of mechanical vibrations using laser sources 1-6
1.1 Non-destructive testing of structures
Components of machines, vehicles and structures are frequently subjected to
repeated loads, also called cyclic loads, and the resulting cyclic stresses can lead to
microscopic physical damage to materials involved. Even at stresses well below a
given material's ultimate strength, this damage can accumulate with continued
cycling until it develops into a crack or other damage that leads to failure of the
component. This process of accumulating damage and finally failure due to cyclic
loading is called fatigue (Dowling 1993).
The costly and common causes of mechanical failure in industry are excessive
deformation and cracking in components due to material inhomogeneities. When
viewed at a sufficiently small scale, all materials are anisotropic and
inhomogeneous. As a result of such non-uniform microstructure, stresses are
distributed in a non-uniform manner and regions of most severe stress are usually
the points where fatigue damage starts. It is frequently necessary to check and test
the article during its service life in order to monitor changes, such as possible
fatigue damage.
The types of test used can be broadly classified into two categories:
(a) Tests to establish the properties of the material, and
(b) Tests to determine the structural integrity of the material or component.
The tests in the first category are generally of a destructive type. They are
performed on samples of a material and the test-piece is damaged or broken in the
used to detect the presence of internal or surface flaws in a material or a
component. By their very nature, these tests do not damage the parts being tested.
The rapid growth in the use of non-destructive testing methods and techniques in
the past years has resulted from demands by industry for improved quality. Nearly
every property of the materials to be inspected has been made the basis for some
method or technique of non-destructive testing. The coin-tap test (McGonnagle,
1961) is probably the best known local method of non-destructive testing. The
region of structure to be tested is tapped with the coin and the operator listening to
the resulting sound can detect the difference in 'ringing' between good and
defective structures. The defective areas sound duller than good areas due to
resonant frequency shifts and more rapid sound decay due to acoustic losses and
stiffness changes at the defect.
1.2 Vibration analysis in NDT
Objects have a set of natural resonant mechanical vibration frequencies. These
natural frequencies are functions of the size, shape, mass, elastic properties, and
mode of vibration produced in the specimen. For specimens of simple shape, it is
possible to derive relations between the various dimensional and structural
parameters and the frequencies for simple modes of vibration. When the specimen
has a complex shape, such relations cannot be derived mathematically and an
empirical relationship is normally found (Bray and McBride 1992).
Vibrational analysis for non-destructive testing purposes is called modal analysis.
Many of the techniques developed in the field of modal analysis and dynamic
modal frequencies of a structure accurately and to explain observed shifts in those
frequencies in terms of defect or damage to the structure. There are two practical
limitations in the usual application of modal analysis for non-destructive testing
(Ewins, 1995):
(a) Imprecise impulsive excitation techniques (traditionally, impulsive heating,
impact or shaking) which allow the energy delivered to the test structure to
vary between successive trials.
(b) Invasive vibration sensing or excitation methods which significantly load
lightweight structures by physical contact during vibration. These can
require special preparation or modification of the structure's surface and can
alter the modal frequencies being measured.
The natural mechanical vibration frequencies are a function of shape, physical
properties and boundary conditions. The dependence on shape includes the
geometrical design of structure and the dimensional factors such as length, width
and thickness. The relevant physical properties include modulus of elasticity,
density and Poisson's ratio for the material of the structure. Boundary conditions
refer to the type of support or the way in which the structure is constrained.
Changes in any of the above properties of a structure will generally cause a change
in natural frequency of the modal vibrations. Detection of these frequency shifts
can be used to reveal underlying changes in one or more of these structural
Many types of flaws, defects and damage in structures of different shapes directly
affect its stiffness or elasticity (Duggan 1964). A loss of stiffness is detectable, as a
decrease in the observed resonance frequency of the structure for modes, which do
not have a node at the damage location.
The NDT technique, in which the test structure is caused to vibrate in one of its
natural or resonant mechanical modes, is known as resonance vibration testing.
This resonance vibration testing generally involves measurement of either the
natural frequencies of the structure being evaluated or the rate of attenuation (or
damping) of vibrations in the structure (Bray and McBride 1992). The data
obtained from these tests are a function of the physical configuration and
composition of the sample and can therefore be analysed for property determination
and flaw detection purposes. Conventionally the excitation is usually
accomplished by mechanical coupling of the test structure to a subsidiary vibrator,
such as a piezoelectric transducer or an electromagnetic (or electrodynamic)
vibrator. The electromagnetic methods are convenient for exciting small vibrations
in magnetic materials, and the induced current methods are useful for non-magnetic
metals having good conductivity. Since no physical contact is required between
the test structure and excitation system, the structure is free to vibrate at its own
natural frequency. For magnetic material, the region of maximum vibration
amplitude is positioned to bridge the poles of an electromagnetic coil carrying
alternating current. The resonant frequency may be found by varying the frequency
of the alternating current to obtain maximum vibration amplitude. Non-magnetic
current through a coil placed near the test sample. The small induced currents in
the sample produce a reaction between the magnetic field of the coil and that of the
induced current. Tthis reaction produces an alternating force on the test sample
and causes it to vibrate. Continuous excitation has several advantages for resonant
vibration testing of materials. It permits:
a) Detection of the natural frequency of vibration in structures (including those
having high damping)
b) Examination of the mode of vibration with sound or vibration pick-ups
c) Excitation of a single natural frequency at one time so that the fundamental
frequency is not masked by other modes or overtones
d) Less critical attention to the damping introduced to the supports.
Piezoelectric accelerometers, capacitance and strain gauges are the most commonly
used conventional devices to measure vibration parameters (Allocca and Stuart
1984).
1.3 Excitation of mechanical vibrations using laser sources
The advent of the laser has produced a light source of high enough power that
considerable heating effects have been generated when the light is absorbed.
Lasers have the ability to produce a very wide range of powers, pulsewidths and
lasers provide very flexible sources of localised excitation and heating. When a
laser beam of high power density (~107 W/cm2) impinges on an opaque metal
surface, the light energy is absorbed in a thin layer of material. The absorbed light
causes a rapid rise in the surface temperature to its vaporisation temperature in a
time short compared to the pulse duration. A small portion of the surface material
is rapidly ejected as a molten spray and vapour (Ready J.F., 1965). This results in
an impulsive reaction to the irradiated structure, which causes it to oscillate. The
disadvantages of the ablative laser excitation are that significant damage can be
done to the surface of the structure and the impulse generated by the excitation may
not be repeatable if there is cumulative damage.
Philp and Booth (1994) found that the simple structure could be excited by a laser
beam of sub-ablative power density without any damage to the irradiated surface at
all. It has been shown that the heat generated at the surface due to the absorption of
light even lower than the material ablation threshold causes a localised thermal
expansion, which in turn causes a localised bending moment. This localised
bending moment is sufficient enough to induce time dependent angular
displacement or flexure of a structure along the biggest dimension. The vibration
amplitude of the structure is normally smaller than the amplitude excited by the
ablative technique because the absorbed energy is simply lower. The relatively
large structure (as a 300 mmxl2 mmx3 mm cantilever) has been successfully
driven to mechanical vibration using repetitive pulses from a low-power diode
laser. It was shown that the structure could be set in steady state forced vibration if
resonance frequencies of the structure. This required that the excitation point at
the surface be positioned at an antinode of the bending moment profile for the
selected vibration mode.
Since the magnitude of structural response depends critically on the difference
between the excitation and resonant frequency, by measuring the displacement
amplitude as function of driving frequency in the resonance region the response
curve of the vibration mode can be plotted. The resonance frequency is identified
as a peak of the response curve with maximum amplitude, which corresponds to
the natural resonance frequency of a particular mode for structure. The half-power
bandwidth can be also determined from the response curve of a particular mode by
obtaining the damping ratio. The accuracy of this technique depends on how
accurately the peak magnitude can be measured and the frequency resolution of
equipment obtainable for the measurement. The optical excitation and optical
sensing technique permits:
(a) Remote non-contact excitation and detection of very small displacements
(b) Low cost support instrumentation.
1.4 The Aim of the research
The purpose of the work described in this thesis is to extend the work of Philp
(1993) by carrying out a more careful set of measurements of the modal
modal frequencies can be determined using a well-designed experimental system.
The accuracy with which modal frequencies can be measured will ultimately
determine the limitations of the optical excitation and sensing technique for
non-destructive testing applications.
Philp's modal frequency measurements were found to be limited by the accuracy of
the simple oscillator used to drive the laser diode excitation system (± 0.5 Hz).
The experimental arrangement used in this thesis will use a very high stability
oscillator to try to remove this limitation and then try to see exactly what physical
effects are responsible for any limitation to the ultimate modal frequency
resolution, which can be achieved. Such limitations could arise from the
fundamental Q of the mechanical resonance being excited (dependent on
vibrational energy loss) or could arise from extraneous environmental vibrational
noise effects, such as those produced by building vibration, acoustic noise and air
currents, which can shift or broaden the measured mechanical resonance
frequencies.
Clearly the limitations will be a function of not just the magnitude of the noise but
also the magnitude of the signal (ie signal to noise ratio) and the overall sensitivity
of the measurement system. Rather than attempt to improve performance by brute
force methods such as using laser powers which are orders of magnitude greater
than those used by Philp, we have chosen to continue to use moderate power laser
diodes for excitation as these are cheap, simple to use and compatible with highly
practical experimental systems. We have, however, chosen to increase the
clearly capable of significant improvement without any change to the basic
practicality of the system. A new interferometer system has been constructed
which is based on the more common shorter-wavelength He-Ne transition at 633
nm and uses couplers designed for this wavelength together with lower noise
silicon detectors. The change of wavelength alone gives an increase in
displacement sensitivity of more than a factor of two compared to the 1523 nm
laser source used by Philp. The interferometer has also been improved by the use
of lower noise electronic circuitry. The overall effect of these changes has been to
improve the noise equivalent displacement of the system by roughly an order of
magnitude while at the same time increasing the bandwidth by a similar factor.
The specific aims of this research are to assess the suitability of low-power
resonant optical excitation and sensing systems for modal analysis applications by:
• Constructing an optical system suitable for making non-contact measurements
of the modal frequencies and other modal oscillation parameters of transverse
mechanical vibrations in small to medium sized structures. This system will
comprise:
(a) A modulated optical beam with an accurately controllable modulation
frequency.
(b) A sensitive fibre optic interferometer.
• Investigating the advantages and disadvantages of alternative ways of making
measurements of modal oscillation parameters, which can be used to
characterise a structure (modal frequency, resonance bandwidth and damping).
• Using the optical system to determine the accuracy with which measurements
can be made of modal oscillation parameters for a high-<2 structural resonance.
• Determining the origin of the effects, which are responsible for the ultimate
limitations with which modal oscillation parameters can be measured.
This optical excitation technique may be used to supplement the resonance
REVIEW OF PREVIOUS WORK
AND
VIBRATION ANALYSIS BACKGROUND
Content Page
2.1 Introduction 2-2
2.2 Summary of previous works 2-3
2.3 Sensing systems 2-10
2.4 Thermoelastic bending of a structure 2-17
2.5 Vibration analysis background 2-19
2.5.1 Differential equation of motion for elastic bar 2-22
2.5.1.1 Resonance frequency and temperature shift 2-28
2.5.2 Equation of motion for Single Degree of Freedom structure 2-29
2.5.2.1 Response function for Single Degree of Freedom system.... 2-34
2.1 Introduction
Bell (1880) first discovered that when a periodically interrupted beam of sunlight
shines on a solid in an enclosed cell, an audible sound could be heard by means of
a hearing tube attached to the cell. In the time the photoacoustic effect was
regarded as a curiosity of no practical value. More than 70 years later the advent of
the laser with diverse heating effects has revived interest of the phenomenon.
Since White (1963) first suggested the generation of acoustic pulses by laser
irradiation of metal surface, a variety of workers (Rosencwaig and Gersho 1976;
Scruby et al. 1980; Charpentier et al. 1982; Aadmont and Murphy 1982) have
made contributions towards understanding the generation process and
characterising the resultant field. It was shown by Rosencwaig and Gersho (1976)
that the primary source of the acoustic signal arises from the periodic heat flow
from the solid to the surrounding gas as a result of extremely rapid light absorption
by solid, which causes an oscillatory motion of a narrow layer of gas at the
solid-gas boundary, that produces detected acoustic signal. It was found that the
photoacoustic signal depends on the amount of absorbed light energy and thermal
properties of the solid, and it is ultimately governed by the magnitude of thermal
diffusion length normal to sample surface. Since the thermal diffusion length
depends on the chopping frequency, the photoacoustic technique enables one to
obtain optical absorption spectra on any type of solid or semisolid material,
whether it be crystalline, powder, amorphous, gel, etc. This capability is based on
the fact that only the absorbed light is converted to sound. A one-dimensional
model for thermal depth profiling was developed by Opsal and Rosencwaig (1982),
for the thermoelastic response beneath the surface. Furthermore Aamodt and
Murphy (1982) reported the specific cases where 3-D thermal diffusion effects are
important.
2.2 Summary of previous works
With rapid growth of interest in photoacoustic spectroscopy, the photoacoustic
technique has been applied to a large range of problems, in particular, to measure
accurately thermal diffusivity of different materials (Charpentier et al. 1982). The
observation of unwanted phenomena was reported, which related to transverse
thermal expansion and temperature gradient through the thickness of the sample
(rear surface excitation). The mechanical vibration due to thermoelastic bending
(called the "drum effect)" was observed in the thermal diffusivity measurement of a
clamped plate sample. In the experiments the sample (0.5 mm thin metal plate)
mounted horizontally on the top of the cell was uniformly illuminated by a 450W
Xe-arc lamp. The polychromatic beam was modulated by a frequency-stabilised
mechanical chopper, whose frequency could be varied from a few Hertz to a few
kHz. A capacitive microphone was used in measurements, with a sensitivity of 50
mV/Nm" . A lock-in amplifier was used to analyse the magnitude and the phase of
the detected signal. Mechanical resonance was observed at several frequencies for
many samples of different metals. It was found that at frequencies greater than the
characteristic frequency fe (defined as the inverse of thermal diffusion time), the
signal decreases very fast with increasing frequency and the "drum effect" can
The influence of thermoelastic bending on photoacoustic signal generation was
examined theoretically and experimentally in connection with the thermal
diffusivity measurement of metals (Rousset et al. 1983). In the experiment, the
sample, which was sensitive to thermoelastic bending only, was simply supported
between two rigid circular knife edges illuminated by a mechanically modulated (a
few Hz - a few kHz frequency-stabilised chopper) Xe source. The modulated light
was absorbed by the sample (thin plate-0.5 mm), instantly converted into thermal
energy and induced thermoelastic bending. The deflections of the sample surface
due to the "drum effect" were measured by detecting the deviation of a He-Ne laser
beam. The probe beam deviation was read on a position sensor (silicon detector)
placed at a distance from the sample. The signals were processed by a lock-in
amplifier and recorded. It was found that for the geometrically thin uniformly
illuminated sample the response of structure to thermal excitation is characterised
by the frequency^, which is the inverse of thermal diffusion time. It was shown
that the amplitude of thermoelastic bending is independent of modulation
frequency at low frequencies (thermally thin sample), while at higher frequencies
(thermally thick sample) the amplitude decreases as an inverse of frequency. The
theoretical model was developed, which analytically explained thermoelastic
bending of solids, using the thermoelasticity equations, the effect is essentially due
to a temperature gradient inside of the sample and normal to the side of the greatest
dimension of the sample. It was shown that the effect of thermoelastic bending can
be used to obtain values of thermal diffusivity for metals directly. Later Rousset et
al. (1985) developed the technique for non-destructive detection of delamination in
layered materials based on photothermal bending effect. In experiments the surface
to a few degrees above the ambient temperature. The induced thermoelastic
displacement was detected by a laser interferometer. It was shown that the
detectability of defects depends on the relative dimensions of the laser radius, the
size of the delamination and the layer thickness.
Hane et al. (1988) developed a photothermal probing technique for detection of
flexural vibration caused by thermoelastic bending. The vibration of a clamped
plate sample was generated by a focused irradiation of modulated laser light. The
flexural vibration caused by thermoelastic bending was sensed by the deflection of
the probe beam. A 12 mm diameter, 80 um thick glass plate was fixed around its
circumference. The front surface was coated by sputtering with 30 nm thick
chromium. A 25 mW of maximum power, 830 nm wavelength diode laser (heating
laser) was used to generate the thermal wave. The laser diode was modulated by
the rectangular wave signal. The laser beam was focused on the front surface of
the plate through the microscopic objective (10x, 0.25 N.A.) with the spot size of
the beam -25 um. The deflection of probe beam was measured by a position
sensor. The signal was processed by a lock-in amplifier (NF-U575). As found
thermoelastic bending is proportional to temperature moment, and its amplitude
was saturated at modulation frequency lower than characteristic frequency, while at
higher than characteristic frequency it decreases as inverse of modulation
frequency. They found that the thermoelastic bending effect can be useful for
non-destructive testing of platelike samples using vibration analysis technique.
The thermoelastic bending effect of a layered plate was further examined
wave propagation (Hane and Hattori 1990). In experiments the front surface of the
sample was irradiated spatially uniformly by chopped laser light. A 25 mW, 830
nm laser diode was modulated rectangularly. The extremely rapid sub-surface
conversion of the absorbed light into heat causes the non-uniform temperature
distribution across the sample thickness, which induces thermoelastic bending of a
sample. The flexural bending of a sample was measured by deflection of a probe
beam. It was shown that the thermoelastic bending is proportional to the
temperature moment and depends on the modulation frequency. The amplitude of
bending moment Mt (measured for two-layer system: 15 um aluminium sheet and
100 (im thick borosilicate glass) decreases nearly as inverse of modulation
frequency f~l for frequencies higher than characteristic frequency fc while
increases almost linearly with the decreasing of modulation frequency below/c, and
has a very gentle slope around the value fc. The amplitude and phase signals
around fc and in the region lower than fc change considerably with increasing
thickness of aluminium layer.
Since Venkatesh and Culshaw (1985) reported the vibrations of microresonant
structures optically activated and detected, the effects of photothermal excitation of
silicon microresonators have being actively investigated for potential use with fibre
optics sensors (Andres etal. 1986; Greenwood 1988; Zhang et al. 1989; Walsh and
Culshaw B. 1991). As resonance frequency of silicon microresonators vary in
response to changes in environmental parameter of the interest (such as pressure,
temperature etc), it can be used as output signal of a sensor. The modulated signal
The advantages include immunity to both fluctuations in the intensity transmittance
of the link from the sensor and electromagnetic interference, yet structures are
intrinsically safe and chemically inert. The structures are extremely small and
could be readily interfaced with a fibre optic link by bonding to the fibre tip. For
this reason it is necessary that the length of microresonator is to be close to the
diameter of the cladding (about several hundreds of micrometers). The width of
typical microresonator is about 5-10 um, which coincides with the core diameter of
the single mode fibre (Churenkov 1993). Therefore, the microresonator width is
equal to or less than the illuminated spot size, that is time dependent temperature
distribution can be described by the one-dimensional heat flow equation. The
photothermal drive mechanism and the dependence of resonant frequency of
layered microresonators on temperature was investigated by Churenkov (1993) and
Walsh and Culshaw (1991). The temperature stability was found to be a major
problem of microresonator sensors. On the one hand, the variations of the
temperature of illuminated region of a microresonator excite a transverse
oscillation. On the other hand, the variations of the temperature at which the
transducer works cause drift of the longitudinal beam tension, which consequently
causes a shift of the natural frequency of the microresonator. The difference in
linear expansion coefficients of a bulk resonator beam, the coating and the
mounting can result in resonance frequency drift with variations of the ambient
temperature. The resonance frequency is also dependent on the temperature
changes of Young's modulus, density and linear sizes. It was shown that the
fundamental frequency has been reduced with increase of incident power, and also
the metal film thickness deposited upon silicon beams had increased the
sensitive and versatile, allowing the measurement of a variety of variables such as
pressure, acceleration, mass, viscosity etc (Lee et al. 1994; Tudor et al. 1988).
In the experiments with single and dual laser irradiation of structures Philp et al.
(1995) found that the excitation of transverse mechanical vibrations was effective
when the period of the thermoelastic excitation approximates the period of the
natural resonant frequencies of the structure. The resulting vibrations of the
samples were detected using small non-contact fibre optic sensor and recorded by
Digital Signal Analyser (DSA 602 Tektronics). The shifts in resonant frequencies
resulted from the structural defects (small slots which simulated cracks and surface
flaws) have been demonstrated using Modal Analysis technique. It was shown that
the laser excitation technique used in conjunction with fibre optic sensors offers the
potential for an NDT application with totally non-contact excitation and sensing of
vibration signatures (Philp and Booth 1991; Philp et al. 1995). Later Philp and
Booth (1994) reported successful experiments where low power laser diodes and an
optical fibre interferometer were used for remote optical excitation and sensing of
mechanical vibrations. An unpolished 300 mmxl2 mmx3 mm cantilever was used
as a test structure. It was clamped by one end in a vice jaws and it was allowed to
vibrate in horizontal plane, that its weight would not affect the characteristics of
vibration. The small portion of light reflected from the natural surface of a
cantilever was used by interferometric sensor and there was only requirement that
the surface of the cantilever has to be aligned approximately perpendicular to the
interferometer beam. The first five resonance frequencies of a cantilever in the
range of 26-1469 Hz were excited and measured. The measurement accuracy of
oscillator used. It was found that the efficiency of optical excitation has been
maximised at characteristic frequency fc> which is the modulation frequency of laser
with period of oscillation cycle sufficient for the temperature difference between
the front and rear surfaces of the structure just to reach its maximum value when
the laser is on, and just to relax to zero when the laser is off. The characteristic
frequency/,, for a thin plate of thickness h and thermal diffusivity k is given by
fc ~ h2
The calculated characteristic frequency fc of the aluminium cantilever (with
thickness h=3 mm) is approximately 10 Hz. However, for the cantilever chosen,
all resonance frequencies were greater then 10 Hz. For that reason the response of
the system was decreased rapidly for frequencies of excitation above the
characteristic frequency fc of the structure. This problem can be partially overcome
using multiple laser diodes for excitation. The practical application of the
technique can be used for complex structures: firstly, by using higher power laser
diodes, secondly, by improving the sensitivity of the technique operating the
interferometer at 632.8 nm and thirdly, by reducing the noise level in the detection
electronic by using silicon detectors.
Recently this technique (Philp and Booth 1994) has been successfully applied for
determining of mechanical stress in vacuum-deposited thin metallic films on glass
substrates (Askraba et al. 1996). The test samples, thin circular glass plates
(42 mm diameter, 0.1 mm thick) were coated with chromium and attached by
gluing to a thin metal rod in the centre. The interferometer (1523 nm wavelength)
diode (15 mW 810 nm) was square wave modulated by a TTL driver to excite
vibration of the sample. Since the stress in the glass-metal film structure affects
the curvature, which in turn causes the shift in resonance frequencies of a wafer, it
can be accurately determined by measuring this shift in resonance frequencies. It
was found that the resonance frequency shift is directly proportional to "the product
of stress by thickness of a metal film."
2.3 Sensing systems
Most vibration measuring systems are based on the sensing devices, which are
called transducers. Transducers convert the measurand into a useable electrical
signal. There have been developed many methods used in vibration measurements.
Examples include strain gauges (Ready 1974), capacitance variation with proximity
(Adams and Bacon 1973), microphones (Adams and Coppendale 1976),
piezoelectric transducers or accelerometers (Nagy et al. 1978). Currently the
piezoelectric type of transducer is by far the most popular and widely used means
of measuring the parameters of interest in modal analysis. It does not normally
matter which quantity the displacement, the velocity or the acceleration is actually
measured, because these quantities are interrelated by simple differentiating and
integrating operations. The current tendency to prefer the use of acceleration
sensitive devices has two reasons: accelerometers can be made mechanically
smaller and their frequency range is wider. If the measured result is wanted in
terms of velocity or displacement, rather than in terms of acceleration, use can be
made of electronic integrators at the output of the accelerometer. It should be
noted that for given application the accelerometer must be chosen with as high
heavier the transducer. But the addition of even a small transducer to the structure
imposes additional and unwanted forces on the structure. Therefore a mechanical
transducer mounted on a test structure may significantly affect the accuracy of
vibration properties measurements, because of weight and lack of sensitivity. The
optical transducers by nature are non-contact and of high accuracy. Many optical
techniques have been developed for detection of structural vibrations; examples
include: Doppler velocimetry (Buchhave 1975; Laming et al. 1986), the
holography technique (Aprahamian and Evensen 1970), laser probe beam
deflection (Hane et al. 1988; Jenkins et al. 1995) a variety of non-interferometric
fibre optic sensors (Chitnis et al. 1989; Philp et al. 1995) and a number of the
interferometric techniques (Deferrary and Andrews 1966; Deferrary et al. 1967;
Pernick 1973; Jackson et al. 1980; Lewin et al. 1985; Philp and Booth 1994)
Jenkins et al. (1995) used the method of optical beam deflection to measure the
modal shapes of a cantilever. The cantilever of length 23,5 mm, width 2 mm and
thickness 0.5 mm was clamped to a micrometer-driven stage with 25mm of
travelling range. The cantilever was driven into resonant oscillatory motion using
Figure 2.01: The end view of the optical arrangement
the PZT actuator, bonded to the aluminium surface of the cantilever. The laser spot
from a diode laser at 670nm was focused onto the surface of the cantilever beam
and the position sensitive detector was placed so that the diverging laser beam
nearly fills the detector. The PZT amplified signal from the photodetector was
sampled by analog-digital converter and analysed using Fast Fourier transform.
The displacement was measured by the lock-in-amplifier at each point along the
cantilever length. Using this method, the modal shape of each of the cantilever's
first four vibration modes were investigated by driving the piezoelectric actuator at
the modal frequency previously determined. The method is experimentally simple
and non-intrusive, it permits a high degree of spatial resolution along the cantilever
length (limited by the wavelength of the laser beam) and its displacement
resolution was ultimately limited by shot noise of the detector. The main
disadvantage of the technique is that it cannot differentiate between the
displacement of the cantilever and its localised curvature.
A fibre optic vibration sensor (proximity sensor) was developed as a non-invasive
non-contact alternative to the strain gauges and accelerometer (Philp et al. 1995).
The intensity modulated proximity sensor was constructed from a 50/125 um
multimode communication grade directional coupler, modulated 820 nm LED light
source and a PIN photodiode detector module. The sensor was designed to detect
small proximity variations between the unpolished reflective surface and the end of
the sensing fibre. Vibrations of amplitude greater than 1mm for mirrored surfaces
and 4mm for unpolished aluminium or steel were detected when the sensor was
located approximately 50mm from the vibrating surface. The sensor output was
illuminated by the sensor was approximately 7x10" mm2, which is very much
smaller than that of the strain gauge bridge (-100 mm2). Hence the fibre sensor
allowed much greater spatial resolution and more accurate resonance frequency
determination. This optical proximity sensor was used to investigate the modal
frequencies of cantilevers in an electromagnetically noisy environment, which
restricted the use of some standard electrical detectors.
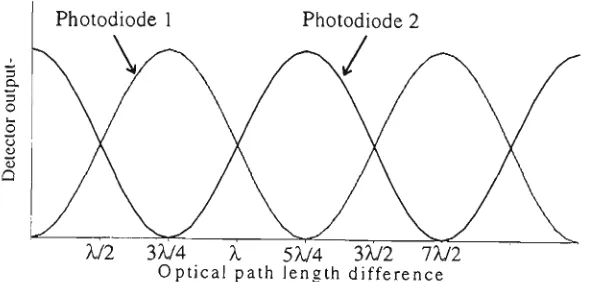
Bulk and fibre-optic interferometric sensors are extremely sensitive devices since
they respond to optical path changes, which are the small fractions of a wavelength
(Dakin and Culshaw 1989). The basic concept is in the optical phase modulation
resulted from the interference of signal and reference beams, which is converted
into a time varying irradiance function, observable as a fringe pattern. A
photodetector monitors the light intensity variation at a point in the pattern and
provides electrical signals for subsequent processing. Since the photodetector
signal is proportional to the normalised light intensity, the linear displacement
amplitude can be determined from the temporal frequency characteristics of the
output signal. Two signal processing techniques have been actively used in optical
interferometry: homodyne and heterodyne. An optical configuration involving the
interference of two light beams with essentially the same optical frequency is called
a homodyne system. The homodyne method is particular simple and inexpensive
for measurement of vibration displacements of simple harmonic motion. The
heterodyne method is more complex and suitable for measurement of
Deferrary et al. (1967) described four homodyne experimental methods for
measuring vibration displacements at a point on a transducer face in air or water.
The technique utilised a Michelson interferometer with CW laser light source.
This method has the advantages: the ability to make displacement measurements in
the range 0.1-6000 A and higher, in frequency range 100 Hz-20 KHz; the capability
to probe into otherwise an inaccessible area over which are desired; the ability to
scan an area by making measurements at points whose diameter could be on the
order of 0.1 mm; no added mass owing to instrumentation as is the case with an
accelerometer; no interference with the acoustic field as might happen for example
with a capacitance device; the capability for making displacement measurements of
a point, on a diffuse surface. A simplified model considered the current measured
at the output of the photomultiplier tube as a result of the homodyning action
between the two split portions of one monochromatic ray in a Michelson
interferometer with perfectly reflecting mirrors that were lined up optically without
error. The term homodyne efficiency was introduced to account for:
a) The finite diameter of the laser beam
b) The lack of monochromaticity of the actual laser source
c) The slight, but typical misalignment of optics in the practical set-up.
It was found that a diffuse surface has much lower Signal-to-Noise ratio S/N for a
given laser intensity. In order to prevent the decrease of homodyne efficiency one
would normally choose a polished surface for small vibration displacements. The
vibration isolation and quiet surroundings are required for measurements of small
displacements as phototube shot noise is the ultimate limitation of sensitivity of the
Linear vibration motion yields a phase change that is spatially uniform but
harmonic in time. Unfortunately, phase changes induced by other extraneous
effects (such as non-sinusoidal or rotational motion) may considerably disturb the
homodyne measurement. In order to verify the measurement of linear vibration
amplitude Pernick (1973) developed a new self-consistent technique (modified
over the methods mentioned above). This technique was based upon a comparison
among a number of independent simultaneous optical phase measurements at
neighbouring frequencies which are proportional to the Bessel functions of
different orders. As the refraction index n is arbitrarily chosen the value of the
phase change and associated displacement can be directly established. Independent
measurements of phase change were obtained by using several choices for n
together with associated filtered output signals at the harmonic frequencies of
(n-l)-CQo, ncoo, (n+l)-(Q0. With such an experimental system the amplitude
measurement could be read directly.
The sensitivity, particularly with fibre interferometers, produces its own problems
in that fluctuations in ambient parameters (particularly temperature: Musha et al.
1982) randomly affect path difference between the two beam paths of the
interferometer and the output signal undergoes unpredictable fading (Dandridge
1991; Jackson and Jones 1989; Sheem et al. 1982). As long as the phase shift due
to the measurand is detected, the changes in source intensity and frequency, the
polarisation states of the interfering beams also cause unpredictable variations
In order to detect surface vibrations induced by low power diode laser excitation of
structure, an improvement in detection sensitivity of about three orders of
magnitude over that of the proximity sensor was required. To achieve this
improvement, a stabilised fibre-optic interferometer was constructed by Philp and
Booth (1994) which exhibited a resolution of a few nanometres (see Figure 3.04 for
experimental arrangement). A 1523 nm He-Ne laser source was chosen for
interferometer because it has a very long coherence which is suitable for the use
with long air paths and because its compatibility with standard 1550 nm
single-mode couplers. The light from the laser was launched into one input arm of a
single-mode 2x2 directional coupler, which divided into signal and reference
branches. The beam reflected from the vibrating surface was coupled back into the
coupler to give modulated light in the signal arm. The optical power in the
reference arm was attenuated using a few small radius turns of the fibre to match
the optical power to that of the signal arm and thus formed high-contrast
interference. Any change in separation between the sensing fibre tip and the
vibrating surface varied the path length of the signal branch with respect to the
reference branch, causing intensity modulation of the output. A fibre-air-fibre
optical path was incorporated into interferometer design to enable non-contact
surface vibration detection. The optical path from fibre to open-air, and back again
into a fibre after specular reflection, significantly reduced optical power in the
signal arm (reducing the SNR) and so limited the output sensitivity to 1.2xl0"2 rad
2.4 Thermoelastic bending of a structure
As stated earlier light absorbed by the solid is partly converted into heat by
interaction with electrons. The light energy absorbed by an electron is distributed
and passed on to the lattice in the same processes, which govern the transfer of heat
(Carslaw and Jaeger 1959). The distribution occurs so rapidly that we can regard
the optical energy as being instantaneously turned into heat at the point at which
the light was absorbed. The heated region undergoes thermal expansion and
thermoelastic stresses generate elastic waves which propagate deep within the
sample. The differential equation for heat flow in a semi-infinite slab (half-space)
of material with a boundary plane at z=0 (the metal surface) was given by
v
;
T(
w,o4^^ = -^|^, 2.01.
k at K
where T(x,y,z,t) is the temperature distribution, U(x,y,z,t) is the heat produced per
unit volume per unit time, k and K are the thermal diffusivity and thermal
conductivity, respectively (Ready 1971). If it is assumed that the absorbed flux
density is a function of radial position r, measured in the x-y plane from the z axis,
and that it is Gaussian in nature Ready (1971) has shown that the solution of Eq.
2.01a is:
where U is the absorbed power per unit area at the centre of the Gaussian spot of
the radius rs, w(t) is the normalised laser pulse shape and r radial position of
absorbed flux density.
For many cases of practical interest, the problem can be regarded as one
compared to the depth to which heat is conducted during the time of the laser pulse.
Then the dependence on the x and y coordinates drops out and the heat flow
equation becomes (Ready, 1971)
„
!r,
A' ar(z.O u{z.t)
The light is absorbed at the surface of a metal with an absorption coefficient as.
The heat production for one-dimensional case was given by
U(z,t) = I(t) e~a"z, 2.03
K°J
where I(t) is (1-F) times the irradiance incident on the surface (where T is the
surface reflectivity) and the spatial pulse shape is uniform. For metals the real part
of the dielectric constant e is negative, and the penetration depth 8 is related to the
skin depth Ss for penetration of an electric field into the metal by
8=5/2=c/2coc0(-£) I/2
, 2.04
where c and coc0 are, respectively, the velocity and angular frequency of the light.
For a typical metal, with absorption coefficient of the order of IO5 to 106 cm"1, if
the laser pulse is flat in time and uniform over the x-y plane, temperature
distribution can be written:
r(o,r)=
(lh\kt\i
2.05Kx J
V K j\
Eq. 2.05 is useful in estimating approximate surface temperature rises for a broad
variety of cases.
The mechanical effect resulted from the heating of the front surface of cantilever
was found that the thermal expansion produces a thermal strain es(%) given by
£s(X)=AL/L=atAT(x), 2.06
where L is the length of the cantilever beam, AL, is the linear thermal expansion, a,
is thermal expansion co-efficient, AT(%) is the temperature of each layer above the
temperature of the rear surface. The equivalent force P{%) which would produce
the same bend and strain as this thermal expansion is
P(x) = £.Xx)bE8h, 2.07
for a cantilever of given length (L), width (b), thickness (h) and Young's modulus
(E). The moment of this force M{%,t) about the mid-plane is
M(x.t) = XP(x) = cx,bE8hxAT{x,t). 2.08
Then the total thermally-induced bending moment M(t) for the entire beam is
h
2
M,(t) = arbEJAT(x,t)xdx, 2.09
_h 2
where a, is the thermal expansion co-efficient, AT(x,t) is the temperature of a layer.
2.5 Vibration analysis background
A treatment of structural vibration and modal analysis is contained in very many
standard texts (Main 1993, Nashif et al. 1985, Vierck 1979) and most of the details
need not be repeated in this thesis. However, some of the concepts and results are
critical to an understanding of this thesis and hence need to be discussed. The
treatment below is intended to summarise the major relevant parts of the theory in a
way, which provides a basis for discussing the experimental results, which follow
mechanical vibrations of a structure.
Any structure with mass and elasticity possesses one or more natural frequencies of
vibration. The natural frequencies are the result of cyclic exchanges of kinetic and
potential energy within the structure. The kinetic energy associated with velocity
of structural mass, while the potential energy is associated with storage of energy in
the elastic deformations of a resilient structure. The rate of energy exchange
between the potential and kinetic forms of energy determines the natural frequency.
A linear structure is one in which the deformation is proportional to load, or
whatever excitation is causing the structure to vibrate. In a linear structure this
proportionality applies regardless of the direction, magnitude or distribution of the
load. For a linear structure, it can be shown that the natural resonant vibration
frequency of the structure is independent of the amplitude of vibration (Blevins
1979). There is always some damping (energy loss) in real structures, which will
make free vibrations decay with time, and there is some amplitude beyond which
the structure no longer behaves linearly. For real structures the concept of natural
resonant frequency must be tempered by some knowledge of the differences
between the ideal mathematical model and the actual structure. The discrepancies
between a linear model and a real structure are often due to neglected linear and
non-linear effects. Some linear effects (which are often neglected) are the effect of
shearing deformation in slender structures and the effect of surrounding fluid.
Non-linear effects (which are often neglected) are plasticity due to yielding and the
vibration amplitude dependence on damping (Blevins 1979). The simple linear
conditions, under which the experimental part of this work was carried out, in
particular, the optical excitation of transverse vibration with very small
displacements of the order of tens of nanometres. Another point, which needs to be
made clear is that optical excitation of a structure in the thermoelastic
(non-ablative) regime causes vibration by inducing the structure to bend. Thus the
vibration is most appropriately described in terms of thermally-induced bending
moments and angular displacements rather than the more usual discussion based on
forces and linear displacements (Philp 1993). However, the interferometric
vibration detection system detects linear displacements at a point and it is more
convenient to use this in the discussion of experimental results. The measured
linear displacements are of course proportional to the angular ones and the two
treatments are completely analogous (both give rise to second order differential
equations but the physical meaning of the various constants are different in the two
cases). In the discussion which follows in this section, a treatment in terms of
forces and displacements is used to illustrate the essential physics as this is simpler,
more familiar to most readers and can more easily be referred to in standard texts.
The results derived are quite general and apply equally well to vibrations induced
by bending moments. Experiments described in subsequent chapters were carried
out using simple cantilever beams as these are convenient targets for which the
various modal vibration properties are easily calculated. For this reason, the
discussion below is described mostly in terms of these structures. During
transverse vibration, the beam flexes perpendicular to its own axis to alternately
store potential energy in the elastic bending of the beam and then release it into the
kinetic energy of transverse flexural vibrations. The general assumptions used in
(a) The beam is uniform along the span;
(b) The beam is composed of a linear, homogeneous, isotropic elastic material;
(c) The beam is slender - the dimensions of the beam cross section are much less
than the length of the beam or the distance between vibration nodes; shear
deformation is not considered;
(d) Only deformations normal to the undeformed beam axis are considered, plane
sections remain plane;
(e) No axial loads are applied to the beam;
(f) The centre of the beam cross section coincides with the centre of mass (ie., the
plane of vibration is also a plane of symmetry of the beam) so that rotation and
translation of the beam are uncoupled.
When a beam is subjected to externally applied transverse forces, both shearing
forces and bending moments will exist; the result is that the beam will deflect.
Deflection will occur due to both the shearing force and the bending moment, but
in practical cases the deflection due to shear can generally be neglected compared
with that due to bending.
2.5.1 Differential equation of motion for elastic bar
The general equation for transverse free vibration of a uniform prismatic beam has
been derived by Timoshenko et al. (1974). A prismatic beam has been drawn in
the x-y plane, which is assumed to be a plane of symmetry for any cross section. If
y represents the transverse displacement of a typical segment of the beam dx, x is
the distance of dx from the left-hand end. Fig. 2.02 shows a free body diagram of
p is the density of material, E is the Young's modulus of the material, IJx) is the
moment of inertia of the cross section of the beam A, with reference to its neutral
axis, the transverse shear force Vs(x) is positive upward, the bending moment M(x)
is positive clockwise. The dynamic equilibrium conditions for the element of the
y
o
A
X
<
dx
I
5,
x
A
M V. M + dx
dx
dV ,
Figure 2.02: The forces and moments of a vibrating cantilever
beam between x and x+dx can be written for vertical forces and for the moments:
f
V.- V+-z—dx
dx J
- pAdx -r-T" = 0 • at'
2.12
And the moment equilibrium condition gives:
dM dx M +-z—dx = M +Vdx + pAdx —
dx 2.
2.13
By neglecting the higher-order term (dx)2 and substituting V, from Eq. 2.12 into Eq.
--y-dx---pAdx—y. 2.14 dx' dt'
From flexural theory
M = EIr-^-, 2.15
ox'
and using this expression in Eq. 2.14, we obtain
df_
dx:
EI
-i-i
dx jdx = -pAdx—%-. 2.16 df
Eq. 2.16 is the general equation for transverse vibration of a beam. The flexural
rigidity EIr does not vary for the prismatic beam with x and Eq. 2.16 can be written
in the form:
d4y d2y
Ef -r-^dx = -pAdx-T-T . 2.17
This equation may also be rewritten as
d4y 1 d2y dx* a2 dt'
where a = J—-f-. 2.19 V PA
When a beam vibrates transversely in one of its natural modes, the deflection at any
location varies harmonically with time:
t (x, t) = Yn (x)(c,„ cos co J + C2n sin cont). 2.20
Substituting Eq. 2.20 into Eq. 2.18 results in
d4Y(x) (o2
—±l--%Yn(x) = 0, 2.21
ax a'
and by introducing the notation —f- = kAn , it can be rewritten as:
d%(x)
dx
-k%{x) = 0. 2.22
The general form of the solution for Eq. 2.22 is
Yn(*) = €,.€*•* + Clne' k
»x + C,ne Jk
"x + CAne~** ,
which may be written in the equivalent form
Yn(x)=Cln sinknx + Cln cos knx + C,n sinhknx + C4ncoshknx
2.23
2.24
This expression represents a normal function for transverse vibration of prismatic
beam, which describes the relative displacement of any point on the structure as the
structure vibrates in a single mode. This function is also called a Mode shape (or
Eigenvector) and is associated with each natural frequency (Eigenvalue) of a
structure. It is useful to write the general expression for a normal function Eq. 2.24
in the equivalent form:
Yn(x) = Cln(cos&nA: + cosh/cnx)-i- C2n
(cos£:„;t-cosh£„;c)-i-+ C3„ (sin/c„.x: + sinh &,,*)+ C4n(smknx-smhknx). 2.25
The constants Cjn, C2n, Cjn and Q„ in Eq. 2.25 can be determined in each
particular case from the boundary conditions at the ends of the beam. Assuming
that the left end is built in for the clamped-free cantilever then:
at the fixed end the deflection and slope are equal to zero
fcMLo=
0
'
dYdx
n(x)'=
0,
A-=oand at the free end the bending m o m e n t and the shearing force both vanish, so
r j2
d%(x)
dx
f j3
=
0,
A=o
d%(x)
dx
3=
0.
Jx=L
Y
n W = Ctn (cos Kx - cosh k„x) + C4n (sin knx - sinh knx). 2.26
The remaining two conditions give the following frequency equation:
cos knL- cosh knL = -\, 2.27
it can be rewritten by denoting pn=knL:
cos/3„ -cosh/?,, =-1.
The consecutive roots of this equation are (Thomson 1993):
P,=1.875; $2=4.694; p3=7.855; /34=W.996; $5=17.279.
The frequency of vibration of any mode will be:
r^AAtlK OOO
h
~ In
IKL
1i n '
l-
1*
where /?„ is a dimensionless parameter, which is a function of the boundary
conditions applied to the beam, L is the length of the beam and ji=pA is the mass
per unit length of the beam. If the structure vibrates only in the nth mode, the
deflection can be written as
'^ = cosh &£-cos ^*
cosh
Pn+cospn(^uPnx ^Pnx
K^J
L L sinh fin + sin j3nsinh-^ sin^s- , 2.29
L L )
cosh/?,, +cos/3n
introducing o = — — , 2.30 sinh pn+ sin #,
Eq. 2.29, which is the characteristic function, can be simplified
^ hP„x Pnx . Bnx . 0nx = c o s h — — - c o s — — - oi s i n h — — - s i n — —
L/ Li V JL^ J—*
2.31
A s shown (Eq. 2.20) the vibration function is:
Yn(x,t) = Yn{x)(cincoscont + C2n sincont),
where Yn(x) is the Mode shape, that is a function only of length of a beam , and
transverse deformation is the sum of the modal deformations:
N
Y(x,t) = JJAnYn(x)Sin(27ifnt + <t)n), 2 33 n=\
where Yn (x) is the transverse displacement associated with the n th
vibration mode,
and (Don, An and 0„ are the natural frequency, amplitude and phase of that mode. An
and <pn are determined by the means used to set the beam in motion (Blevins, 1979).
For the case of forced vibration of a prismatic bar the differential equation of
motion can be written (Volterra and Zachmanoglou 1965):
d*Y(x,t) d2Y(x,t)
r
—dV
4—
= p^
x'' ~
p—dt
2—'
234Assuming that the general solution of this equation is of the form
Y{x,t) = f_Yn(x)fn(t), 2.35
where the function Yn(x) is the normal function satisfying the differential equations
EIr
^h^ = °^pAY"W' (* = l'2' • -}' 236
and the four boundary conditions at the ends of the bar. Substituting of Eq. 2.35
into Eq. 2.34 gives
Ehl^fS')-
P(x.
t)-pA±r^)^M. 2.37
n=\ ax „=1 atIn view of Eq. 2.36, Eq. 2.37 can be written
to>Mx)m = ^p{xj)-±YSx)^^. 2.38
n=\ p A n=] atMultiplying both sides of Eq. 2.38 by Ym (x), (m = 1,2,..), and integrating between 0
relations (Volterra and Zachmanoglou 1965):
" =-r for n=m
Eq. 2.38 reduces to
d'fAt) o x / \ 2 , .
- j ^ + 0)oJn(t) = — Pn(t) (n = U , . . ) , 2.40
L
where Pn (t) = j p(x, t)Yn (x)dx, 2.41
p(x,t) is generally a function of both x and t. Eq. 2.41 is essentially the same as the
differential equation for forced vibration of an undamped system with one degree
of freedom.
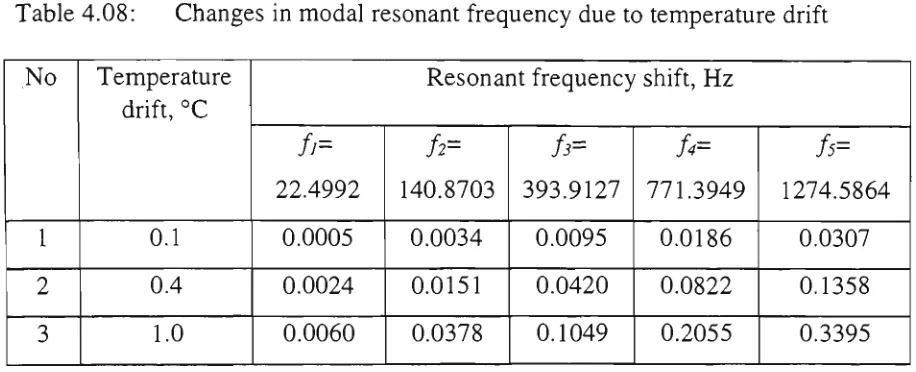
2.5.1.1 Resonance frequency a n d temperature shift
It can be seen from Eq. 2.28, that Modal frequency is proportional to magnitude of
Young's modulus E and on the other hand is inversely proportional to squared
length of a cantilever L2 and square root of material density Jp . It can be shown
that the length and density changes of the structure due to thermal drift have
negligible effect on the value of resonance frequency of a structure, but Young's
modulus dependence on temperature may be considerable in terms of obtainable
measurement accuracy. The relation of Young's modulus to the temperature
change was given by (Kaye and Laby 1973):
E = E0(\-ccE-AT), 2.42
where E0 is Young's modulus at temperature of 15°C, aE is temperature
co-efficient, and AT is temperature change. By differentiating Eq. 2.28 and Eq. 2.42
^
(E)
=l^=f§
Ar
= = 4j7Tf^'/.<
£
>^ 2-43
Not only frequency is so sensitive to tiny changes of Young's modulus (E) due to
the temperature changes, damping factor is also strongly dependent on stiffness of
the structure and thus on Young's modulus.
2.5.2 Equation of motion for Single Degree of Freedom structure
A mechanical vibratory system, which requires only one coordinate to define
motion is called a single-degree-of-freedom system. For SDOF a free vibration
analysis yields its natural frequency, mode shape and damping factor by solving the
differential equations of motion. In order to characterise the vibration properties of
a straight elastic cantilever beam under the general assumptions above and with
extremely small displacements it can be approximated as a single
degree-of-freedom system, for which the displacement at any instant can be specified by a
single coordinate y. For SDOF the equation of forced oscillatory motion with
viscous damping is given by
my + cy + ky = N0 sin cof t, 2.44
where m is the mass of the vibrating structure, c is a damping constant, K is the
stiffness constant, cof the angular frequency of the driving force and N„ the
amplitude of this force.
The solution is the sum of a transient term y, and a steady state forced term yf
y = y, + yf. 2.45
The transient term is obtained by solving Eq. 2.44, when the right hand side is zero.