STAFFORD, H. A. 1962. Histochemical and biochemical dif- ferenccs between lignin-like materials in Phleum pratense L. Plant Physiol. 37:643-649.
STEEL, G. D., AND J. H. TORRIE. 1960. Principles and pro- cedures of statistics. McGraw-Hill Book Co., Inc., New York. 481 p.
STENQUIST, N. J. 1968. Digestibility of reconstituted corn. Ph.D. Diss. Colorado State Univ., Fort Collins. 64 p. STREETER, C. L. 1969. A review of techniques used to esti-
mate the in vivo digestibility of grazed forage. J. Anim. Sci. 29:757-768.
SULLIVAN, J. T. 1955. Cellulose and lignin in forage grasses and their digestion coefficients. J. Anim. Sci. 14:710-717. SULLIVAN, J. T. 1959. A rapid method for the determina-
tion of acid-insoluble lignin in forages and its relation to digestibility. J. Anim. Sci. 18: 1292-1298.
TOPPS, J. H. 1962. Studies of natural herbage of the sub- tropics: I. The digestibility of herbage grazed by cattle. .J. Agr. Sci. 58:387-391.
TOWERS, G. H. N., AND R. D. GIBBS. 1953. Lignin chemis- try and the taxonomy of higher plants. Nature 172:25-26. TROELSEN, J. E., AND J. B. CAMPBELL. 1959. Nutritional quality of forage crops adapted to southwestern Saskatche- wan as determined by their digestibility and dry matter intake when fed to sheep. Canadian J. Plant Sci. 39: 417-430.
VAN DYNE, G. M. 1963. Forage intake and digestion by cattle and sheep on a common dry foothill annual range. Ph.D. Diss. Univ. Calif., Davis. 399 p.
VAN DYNE, G. M. 1965. Probabilistic estimates of range forage intake. Western Sect. Amer. Sot. Anim. Sci., Proc., 16: I-G.
4%
Estimating Yields of Gambel Oak
from Foliage Cover and Basal Area1
SELAR S. HUTCHINGS AND LAMAR R. MASON
Principal Plant Ecologist, Intermountain Forest and Range Experiment Station, Forest Service, USDA, Ogden, Utah,
and Range Conservationist, Soil Conservation Service, USDA, Salt Lake City, Utah.
Highlight
This study of Gambel oak (Quercus gumbelii Nutt.)
shows that annual yields of foliage and twigs can best be
estimated from measurements of foliage and basal area.
Equations for predicting yield of oakbrush foliage are
given for various range sites and range condition classes.
Foliage yields and yield equations are different for each
site and each condition class. Yield tables illustrate the
relation of foliage production to foliage area and basal
area.
Yields of all vegetation,
including
large brush
species such as Gambel
oak (Qzcercus
gambelii
Nutt.), are necessary to fully evaluate native range-
l Received August 19, 1969; accepted for publication Novem- ber 12, 1969.
VAN DYNE, G. M. 1969. Measuring quantity and quality of the diet of large herbivores, p. 54-94. In F. B. Golley and H. K. Buechner [eds.] A practical guide to the study of the productivity of large herbivores. Blackwell Scien- tific Publications, Oxford, Great Britain.
VAN DYNE, G. M., AND G. P. LOFGREEN. 1964. Comparative digestion of dry annual range forage by cattle and sheep. J. Anim. Sci. 23:823-832.
VAN DYNE, G. M., AND J. H. MEYER. 1964. A method for measurement of forage intake of grazing livestock using microdigestion techniques. J. Range Manage. 17:204-208. VAN SOEST, P. J_ 1963. The use of detergents in the analysis
of fibrous feeds: II. A rapid method for the determina- tion of fiber and lignin. J. Ass. Offic. Agr. Chem. 46: 829-835.
WAITE, R., M. J. JOHNSON, AND D. G. ARMSTRONG. 1964. Evaluation of artificially dried grass as a source of energy for sheep: I. The effect of stage of maturity on apparent digestibility of ryegrass, cocksfoot, and timothy. J. Agr. Sci. 62: 391-398.
WALLACE, J. D. 1969. Nutritive value of forage selected by cattle on sandhill range. Ph.D. Diss. Colorado State Univ., Fort Collins. 224 p.
WALLACE, J. D., AND A. H. DENHAM. 1970. Digestion of range forage by sheep collected by esophageal fistulated cattle. J. Anim. Sci. 30:605-608.
WALLACE, J. D., K. L. KNOX, AND D. N. HYDER. 1970. The energy and nitrogen value of sandhill range forage selected by cattle. J. Anim. Sci. 31:298-403.
WATKINS, W. E. 1955. Digestibility of range grasses and grass-legume mixtures. New Mexico Agr. Exp. Sta. Bull. 400. 21 p.
9
land site potential.
Total annual shrub yield esti-
mation is time consuming
and requires
constant
training and checking to insure accuracy.
A yield
prediction
formula,
utilizing
one or two simple
measurements,
can save time and increase accuracy.
Data for this study, collected in 1964, 1965, and
1966 indicate
that reliable
yield estimates,
com-
puted from measurements
of foliage area, are more
accurate when measurements
of basal stem area are
included.
Such estimates can be made rapidly and
without personal bias.
Methods
Study areas were located on five different Utah range sites: high mountain loam; mountain loam; mountain shal- low loam; mountain stony loam; and upland loam. All study areas were at elevations between 5,500 and 8,000 feet. Average annual precipitation ranged between 14 and 26 inches. Study locations, concentrated in Iron, Sanpete, and Wasatch Counties, represented the southern, central, and northern portions of this species’ distribution in Utah. No samples were taken near the boundaries of the oakbrush zone.
ESTIMATING
ANNUAL
YIELDS
431
on l/100-acre belt transects, 4.356 feet wide and one hun- dred feet long.
On each plot, oakbrush foliage was separated into small clumps or segments that had unbroken foliage canopies. Foli- age width, length, and height of each clump were measured to the nearest 0.5 foot. Scattered patches of oakbrush foliage with broken canopies were measured separately, or patches of foliage were pulled together to eliminate crown open- ings. Average stem height in each clump was measured to the nearest 0.5 foot, and average stem diameter at ground level, to the nearest 0.1 inch. The number of stems in each clump also was recorded. Foliage on a stem over 6 feet high was recorded separately. A single branch or small area of foliage was selected as a standard for estimating or counting weight units on each clump. When all measurements were recorded, foliage, acorns, and annual twig growth were clipped from the weight unit, air-dried 3 or 4 weeks, and weighed. Total air-dry weight was computed by multiply- ing sample unit weight by the number of weight units in each oakbrush clump. Foliage area and basal stem area were computed as follows: foliage area = width x length; basal area = average stem diameter squared x number of stems.
Range Sites and Condition
Classes
Oak production was sampled within three climatic zones. The terms “high mountain,” “mountain,” and “upland” refer to specific climatic characteristics associated with eleva- tion and topography.
High Mountain Zone
Climate is cool and humid; winters are cold and snowy, summers are cool; average annual precipitation ranges be- tween 22 and 26 inches. Areas sampled ranged from 7,000 to 9,500 feet elevation. Soils are similar to those in the mountain loam range site, except that they contain more organic material, are better developed, and have a moisture- holding capacity of 8 to 9 inches in a 6-foot profile. Oak is limited in distribution in this zone. The five plots examined on high mountain loam were classified as poor condition.
Mountain Zone
Climate is cool and subhumid; summers are fairly cool to warm, winters are cold and snowy. Summer precipitation, combined with winter soil moisture, is sufficient for plant growth through most of the summer, especially on deep soils that occur in this zone. Average annual precipitation ranges from 17 to 21 inches. This zone lies between elevations of 6,500 and 8,000 feet.
Mountain Zoum.-Soils are deep (over 60 inches). Surface soil (0 to 10 inches) texture ranges from sandy loam to clay loam. The soil profile usually is free of coarse fragments, but occasionally 25% to 30% of the volume is made up of such material. Subsoils are loams to clay loams and may include 40y0 coarse fragments. Parent materials are sand- stone, limestone, siltstone, and some ‘granite. Subsoils are noncalcareous throughout and are slightly acid to mildly basic (pH 6.8 to 7.5). Their moisture-holding capacity aver- ages 7 to 8 inches, but ranges from 6 to 9 inches in a 6-foot profile. More data were taken on this site than on any other. Four range condition classes were studied: excellent (15 plots), good (22 plots), fair (22 plots), and poor (15 plots).
A4ountain shallow loam.-Soils are similar to mountain loam, but are shallow (10 to 20 inches) over bedrock. The soil profile may contain up to 25y0 coarse fragments by
volume. Moisture-holding capacity is only 2 to 2.5 inches, but plants get some additional moisture from cracks in the bedrock. Five plots in poor condition were studied on this site.
Mountain stony loam.-Soils resemble those of mountain loam, but are gravelly, stony, or cobbly and contain over 50% coarse fragments by volume. Parent materials are sand- stone, shale, limestone, quartzite, schist, gneiss, and various igneous rocks. Moisture-holding capacity averages 3.5 to 4 inches, and has a range of 3 to 5 inches in a 6-foot pro- file. Data were taken from three different range-condition classes: good (10 plots), fair (15 plots), and poor (15 plots).
Upland Zone
This zone, at 5,500- to 7,000-foot elevation, has cold, snowy winters and hot, dry summers. Average annual pre- cipitation is 12 to 16 inches, but samples were taken in areas where precipitation averaged 14 to 16 inches. Upland loam soils are deep (24 to 60 inches). Parent material is loamy alluvium from mixed sedimentary and igneous rocks, but on most sample areas parent material was primarily sand- stone and limestone. Surface soils range from loams to clay loams, with varying amounts of coarse fragments-usually less than 40% by volume. Subsoils (10 to 40 inches) are mostly loams, but range from gravelly fine loams and clays to cobbly sandy clay loams. Soil reaction is mildly alkaline in the surface and moderately alkaline in the substratum (pH 7.2 to 8.3). Although mostly noncalcareous in the sur- face, these soils are strongly calcareous in the substratum. Coarse fragments may occupy 3.5% of the soil profile, but generally occur in much smaller amounts. Moisture-holding capacity of upland loam soils averages 6 to 7 inches, but ranges from 5 to 9 inches in a 6-foot profile. Two range- condition classes, fair (10 plots) and poor (5 plots), were sampled.
Results
In preliminary
tests, several variables were evalu-
ated for their reliability
in foliage production esti-
mates. Evaluated, singly and in combination,
were:
foliage width; foliage length; foliage height; foliage
area; foliage volume; tree height; stem diameter;
number of tree stems; and basal area. Of these,
foliage area, foliage volume, basal area, and the
logarithms
of these variables
provided the most
valid data for production predictions.
Variance ac-
counted for by the different variables is given in
Table 1.
On most sites, foliage area was associated more
closely with foliage production
than either foliage
volume or basal area. A multiple
regression
of
foliage area and basal area provided the best pre-
diction equation.
Over 75% of the variance
on
most sites was accounted for using these two vari-
ables.
Logarithmic
values did not improve
the
prediction
equations significantly,
but-since
they
force the curves through zero-they
fit low yield
data better than linear equations.
Table 1. Foliage yield variance accounted for (r2) by foliage and tree measurements of oak.
Site and range condition
Yield Log of yield
Foliage Foliage Foliage Foliage
area volume area volume
and and and and
Foliage Foliage Basal basal basal Foliage Foliage Basal basal basal area volume area area area area volume area area area
High mountain loam Excellent
Good Fair Poor All
__
__
__
0.50
.50
__
__
__
__
__
__
0.74 0.88
.74
.88__
_-
__
_-
0.78.78
__
__
0.93 .93
_-
__
0.92 .92
0.87 .87
__
__
__
0.74-74
__
__
__
-_
__
__
0.90 0.89
.90 .89
Mountain loam
Excellent .78 .70 .61 .86 .84 .86 .86 .66 .87 .86
Good .81 .66 .60 .84 .73 .80 .89 .74 .85 .90
Fair .76 .50 .27 .77 .55 .70 .81 .43 .75 .81
Poor .66 .63 .52 .73 .72 .67 .70 .58 .74 .71
All .67 .56 .52 .72 .67 .79 .86 .64 .84
.86
Mountain shallow loam
Excel lent
__
__
-_
Good
__
__
__
Fair
__
__
_-
Poor .80 .74 .19
All
.80
.74 .19_-
__
.80 .80
_-
__
__
.75 .75__
.87 .87
__
.82 .82__ __ __ .65 .65
__ -_ __ __ __ __ .88 .84 .88 .84
Mountain stony loam Excellent
Good Fair Poor All
.72 .57
.82
.76
__
__
.73 .53 .62 .34 .87 .45 .79 .45
.77 .65 .84 .78
__
.73 .64 .88 .79.79
.51 -77 .71
__
__ .78 .51 .59 .51 .81 .40 .74 .55__ __ .81 .78 .67 .69 .80 .81 .78
.76
Upland loam Excellent Good Fair Poor All
__
-90
.82 .81
__
__
__
_-
.61 .88.74
.68 .62 .73_-
__
__
__
__ __ ___-
.93
.87 .85
__
_-
__
__.89 .88 .84 .74
.80 .90 .88
.73
.77 .78 .78 .72
_- __ .92 .86 .92 .90 -84 -82
Total all trees .59 .44 .47 .64 .56 .76 .80 .60 .81 .81
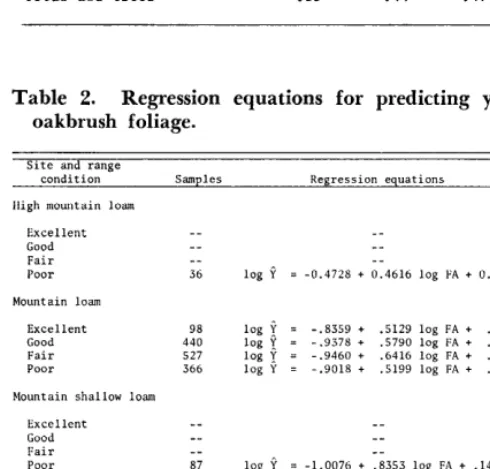
Table 2. Regression equations for predicting yields of
oakbrush foliage.
within approximately
Best precision was obtained
15% of the mean (P .05).
on areas where oak-
Site and range
condition Samples
brush size varied least.
Regression equations
Foliage yield was associated more closely with
High mountain loamfoliage area than with basal area, except on poor-
Excellent Good Fair Poor
__ _-
condition range on high mountain loam. Oak on
__ _-
_- __
36 log P = -0.4728 + 0.4616 log FA + 0.3899 log BA
high mountain
loam was a fairly dense stand of
Mountain loam
Excellent Good Fair
large trees. Equations
for estimating
foliage pro-
duction on oak are given in Table 2.
Poor
98 log? = -.8359 + .5129 log FA + .1293 log BA 440 log y = -.9378 + .5790 log FA + .2758 log BA
527 logy = -.9460 + .6416 log FA + .2130 log BA
Yields of oakbrush
foliage per square foot of
366 1ogY = -.9018 + .5199 log FA + .2531 log BAfoliage cover were two to three times greater on
Mountain shallow loam
poor-condition
range on high mountain loam than
Excellent __ _-
on poor-condition
range on upland loam (Tables
3 and 4). Lowest yields per unit of cover and basal
Good __ __
Fair
__
_-
Poor 87 log? = -1.0076 + .8353 log FA + .I485 log BA
area were found on excellent-condition
range on
Mountain stony loam
mountain loam (Table 5).
Excellent Good
-_ __
234 log! = -1.0094 + .6755 log FA + .1216 log BA
In several study locations
on high mountain
Fair 195 log y = -1.0955 + .3529 log BA + .4954 log FAPoor 148 1ogY = -1.0757 + .7241 log FA + .1682 log BA
loam, mountain
shallow loam, and upland loam
Upland loam
range sites in poor condition,
oak constituted
over
Excellent __ __
90% of the total plant composition.
Yields of
Good Fair Poor
__ _-
24 logi = -1.1204 + .6702 log FA + .1975 log BA
ESTIMATING
ANNUAL
YIELDS
433
Table 3. Production (lb, air dry) of oak foliage on poor-
condition range on high mountain loam by foliage area
(ft”) and basal area (inch2).
Table 5. Production (lb, air dry) of oak foliage on excel-
lent-condition range on mountain loam by foliage area
(ft”) and basal area (inch2).
i.011agc Basal area
arca 0.50 1.00 5.ou 10.00 20.00 30. 00 40.00
-- _.
Foliage Basal area
area 0.50 1.00 5.00 10.00 20.00 30.00 40.00 50.00
0.50
1.00
5.00
10.00
20.00
30.00
40.00
50.00
60.00
.26 .34
.54 .71 .41 .‘l5 ‘.5uj
.5s .64 . 70
0.52
7
1.83 2.39 3.13
2.51 3.29 4.31
3.03 3.97 5.20
3.461 4.54 5.94
‘1.11
5.65
6.82
7.79
8.63
9.39
.74 1 0.77 3.67
5.05
6.09
6.96
.68
j
.s4 .91 1.00i
1.231.61
3.84 5.03 6.59 7.72
5.47 7.17 8.39
Log Y = -0.47278 + 0.46158 log FA + 0.38989 log BA (r7= 0.90) Log i = -0.83587 + 0.51294 log FA + 0.12925 log BA (rz= 0.87)
ranges deteriorate.
On mountain stony loam, oak-
brush yields on fair- and poor-condition
range were
much lower than on good-condition
range. Appar-
ently, other plants, such as big sagebrush
(Artemisia
tridentata)
and cheatgrass
(Bromus tectorum),
in-
creased or invaded areas to replace oakbrush and
depleted palatable grasses and forbs.
Discussion
Oakbrush yields and cover were greatest on poor-
condition
range, except on the mountain
stony
loam site. Yields on poor-condition
range were
almost equal for mountain
loam, mountain
shal-
low loam, and upland loam, although foliage cover
ranged from 48 y0 to 70%. Yields per square foot
of foliage cover were 0.05, 0.08, and 0.07 lb., respec-
tively (Table 6). Oak yields on poor-condition
high
mountain
loam were double those on any other
site. Heavier stands and higher yields of oakbrush
apparently develop on poor-condition
range follow-
ing loss of palatable herbaceous vegetation.
Yearly variations in foliage yield were not evalu-
ated. Yield data should be obtained for all range-
condition
classes over a period of several years to
evaluate yearly fluctuations
in production.
Predic-
tion equations
derived from this study will be
checked in the field to determine
their reliability.
Foliage production
estimates
probably
can be
improved by grouping oak cover into foliage classes
based on denseness or compactness
of foliage-as
was done with juniper foliage (Mason and Hutch-
ings, 1967)-and
by sampling oak foliage by clones
instead of by belt transects, which cut across clonal
areas.
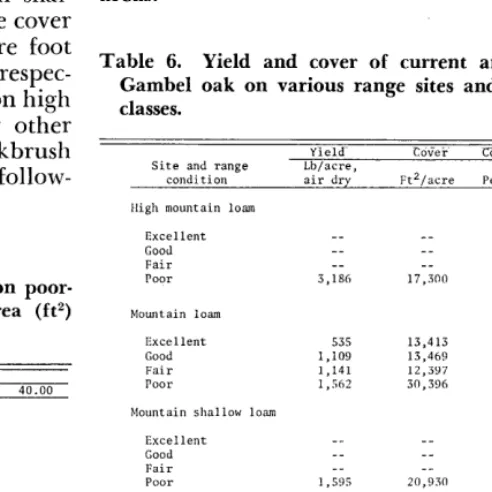
Table 6. Yield and cover of current annual growth of
Gambel oak on various range sites and range-condition classes.
Site and range condition
Yield Lb/acre, air dry
Covei- CCveF YiCId
Ft’/acre Percent Lb/ft 2
High mountain loam
Excellent __ _- _- __
God __ __ _- _-
Fair __ __ __ __
Poor 3,186 17,300 40 0.18
Table 4. Production (lb, air dry) of oak foliage on poor-
condition range on upland loam by foliage area (ft”)
and basal area (inch2).
Mountain loam
Excellent 535 13,413 31 .04
Good 1,109 13,469 31 .08
Fair 1,141 12,397 28 .09
Poor 1,562 30,396 70 .ns
Foliage
area 0.50 1.00
Basal area
5.00 10.00 20.00 30.00 40.00
0.50
1.00
5.00
10.00
20.00
30.00
40.00
50.00
60.00
0.10
.15
.38
.56
Mountain shallow loam
iMountain stony loam
Excellent Good Fair P00r
__ _
__
__
1,269 21,270 49 .06
756 16,440 38 .05
811 13,874 32 .06
2.03
2.39
2.71
3.00
Upland loam
Excellent Good Fair Poor
__ _- __ _-
_- _- _- __
728 16,220 37 .04
1,594 22,580 52 .07
Summary
Reliable
estimates of oakbrush foliage and twig
yield can be made from measurements
of foliage
cover and basal stem area. Based on samples from
30 to 50 oakbrush areas, predictions
can be made
that are within 10% of the actual average yield.
Logarithmic
equations
provided the best correla-
tions for this study. Separate equations are needed
for different
sites and range-condition
classes. Al-
Relationship of Organic Reserves
to Herbage Production in
Crested Wheatgrassl
JAY D. McKENDRICK2 AND LEE A. SHARP
Research Associate and Professor of Range Management, College of Forestry, Wildlife and Range Sciences,
University of Idaho, Moscow, Idaho.
Highlight
The weight of etiolated growth stimulated in the field
by excluding sunlight from crested wheatgrass plants was
measured and used as a quantitative index to the organic
reserves of plants prior to spring growth. Subsequent
herbage yields and vegetative/reproductive tiller composi-
tion were measured and statistically compared with the
etiolated growth. Etiolated growth, basal area per plant,
and number of tillers per unit surface area were all highly
correlated to the subsequent herbage production. Protec-
tion from grazing for one growing season is apparently
sufficient time for crested wheatgrass plants to nearly re-
plenish their organic reserves. The use of etiolated growth
in predicting herbage yields may be applicable when
organic reserves are the most limiting growth factor.
A rapid and relatively simple method for assess-
ing the effects of grazing treatments on plant vigor
and productivity
is needed if range managers are
to successfully
intensify the management
of large
areas of rangeland.
About
1.2 million
acres of
rangeland in Idaho (Sharp, 1965) have been artifi-
cially seeded to adapted species, principally
crested
wheatgrass
(Agropyron
cristatum
and
Agropyron
desertorum).
Because of the importance
of crested
wheatgrass to the Idaho range livestock industry, a
physiological basis for judging the impact of grazing
treatments
on this species is badly needed.
This
paper presents the results of a field technique used
to relate organic reserves of crested wheatgrass to
herbage production.
l Received October 25, 1969; accepted for publication March 5, 1970.
2 Present address: Research Assistant, Department of Agron- omy, Kansas State University, Manhattan, Kansas 66502.
though data were gathered during three field sea-
sons, yearly differences in yield were not evaluated.
Prediction
equations and yield tables developed
from this study should be checked for application
in the field.
Literature
CitedMASON, LAMAR R., AND SELAR S. HUTCHINGS. 1967. Esti- mating foliage yields on Utah juniper from measurements of crown diameter. J. Range Manage. 20:161-166.