O R I G I N A L R E S E A R C H
A Single-Centre Review of Transfusion Practices and
Blood Wastage in Liver Transplantation
This article was published in the following Dove Press journal: Clinical Audit
Jo Han Gan 1
Kelly Nwankiti 2
Zoka Milan 1
1Department of Anaesthesia, King’s College Hospital NHS Trust, London SE5 9RS, UK;2Blood Transfusion, King’s College Hospital NHS Trust, London SE5 9RS, UK
Background: Liver transplantation is associated with massive blood loss due to a combination of coagulopathy, portal hypertension, and multiple vascular transection and
anastomoses. Multiple blood transfusions over a short time frame may result in significant
blood and component wastage due to over-ordering of blood products and component time expiry. Blood wastage in the setting of liver transplantation is yet to be reviewed. We reviewed transfusion practices during liver transplantation and audited blood component and product wastage.
Methods:We performed a single-center retrospective review of all adult patients aged >16 years over a period of a year. A total of 181 cases were included in the review.
Results:Eighty-seven percent of liver transplants werefirst transplants and were mainly due to chronic liver failure. Our cohort had a median blood loss of 4249 mL (IQR 2830, 6576) per transplant. Patients having redo procedures or have acute liver failure as a presenting
aetiology bled significantly more. Nearly all our patients received blood products during the
perioperative period. Fresh frozen plasma (FFP) was transfused in 91.2% of our cohort, followed by packed red cells (PRC, 64.2%), platelets (52.5%) and cryoprecipitates (32.0%). A total of 142 units of blood and blood product were wasted. This equates to a wastage rate of 4.6%. This is higher than the target of 3% set by our institution. Highest wastage rates were seen in FFP (8.6%), followed by PRC (2.2%), cryoprecipitates (1.0%) and
plate-lets (0.9%). The commonest cause of wastage was“time expired”. The total cost of wastage
is £9800, which represents 3.3% of the total cost of blood products transfused.
Conclusion:Changing blood component ordering habits, staff training, and awareness may help reduce wastage of this precious commodity.
Keywords:liver transplantation, blood wastage, transfusion practice, bleeding
Introduction
Liver transplantation is the treatment of choice for patients with acute and chronic liver failure when all other options have been exhausted. Despite advances in anaesthetic and surgical techniques, it is associated with massive blood loss due to a combination of coagulopathy, portal hypertension, and multiple vascular transection and anastomoses. The volume transfused has declined over the years,
but may still require one blood volume transfusion which places a significant
demand on transfusion services.1
Blood components and products arefinite resources. Current wastage levels range
from 1% to 5% in most countries but can be as high as 25% in other centres.2,3This is primarily due to time expiry as platelets have a shelf life of 5–7 days. Blood wastage in the setting of liver transplantation is yet to be reviewed, where there is a very high
Correspondence: Jo Han Gan Department of Anaesthesia, King’s College Hospital NHS Trust, London SE5 9RS, UK
Tel +44 78 9422 8485 Email johan.gan@nhs.net
Clinical Audit
Dove
press
open access to scientific and medical research
Open Access Full Text Article
Clinical Audit downloaded from https://www.dovepress.com/ by 118.70.13.36 on 20-Aug-2020
blood utilisation over a short time frame and a potential for a break in the cold chain resulting in significant wastage. We reviewed transfusion practices during liver transplantation and audited blood component and product wastage during the perioperative period.
Methods
King’s College Hospital is one of the largest liver trans-plant centres in Europe. We routinely transtrans-plant over 200 patients a year and have ~100 patients on the transplant waiting list at any one time.4
We performed a single-centre retrospective review of all adult patients (aged >16 years) who had a liver transplant in the period from 1/1/2017 to 31/12/2017. Patients were
iden-tified from our liver transplant database. Anaesthetic and
surgical records were reviewed and relevant demographic, blood loss, and transfusion data were extracted. Blood loss was determined by a combination of swab weights, volume in suction devices, and visual estimation while clotting derangement is detected through the use of thromboelasto-metry and clinical observation of bleeding wound edges and operative site. Patients were transfused to correct coagulo-pathy and achieve euvolaemia with a target haemoglobin concentration of 10 g/dL at the end of the procedure.
Data on blood component and product consumption and wastage were cross-referenced to data obtained from the BloodTrack® Database and WinPath. Blood and blood component wastage was categorised according to the
cause of wastage (Table 1). BloodTrack is a blood
inven-tory and transfusion management system that physically secures and electronically verifies and monitors the
hospi-tal’s blood supply chain while WinPath is our laboratory
information system. The cost of blood products was obtained from Transfusion Services.
Data are expressed as median and interquartile range or mean ± standard deviation. Categorical data are expressed as
percentages. Mann–Whitney U-test was used to compare
blood loss in redo procedures and in acute liver failure. A p-value of <0.05 is accepted as being significant.
Ethics Committee approval was waived by Medical Research Council (MRC), based on the facts that 1) patients in our study were not randomized to different groups, 2) our study protocol did not require a change in treatment or patient care from usual practice, and 3) data were collected retrospectively. This decision was made based on guidance by the MRC online decision tool.4This study is classed as an audit and quality improvement project and registered with
the Audit Department at King’s College Hospital. All data
have been anonymized to ensure patient confidentiality.
Results
Patient Characteristics
A total of 190 liver transplants were performed in adult patients over the study period. Five patients were excluded as they had multiple procedures, ie, a liver transplant in combination with renal transplantation or subtotal colectomy. A further four patients were excluded due to incomplete
dataset. A total of 181 patients were included in the final
analysis.
Baseline characteristics for our group of patients are described inTable 2.
Transplant Characteristics
Eighty-seven percent of liver transplants were primary transplants while the remainder were redo procedures. The main indication was due to chronic liver disease, which comprises 91% of our cohort. The rest were due to acute liver failure. This is in keeping with data
pub-lished nationally by NHS Blood and Transplant
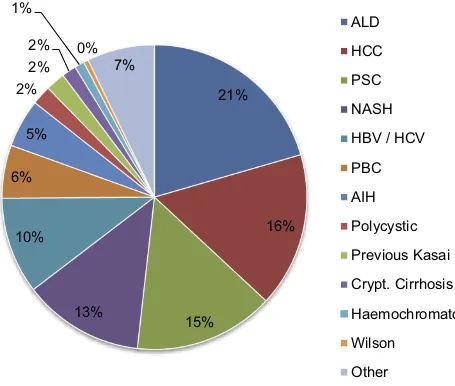
(NHSBT).5 The breakdown of presenting aetiology due
to chronic liver disease is shown inFigure 1.
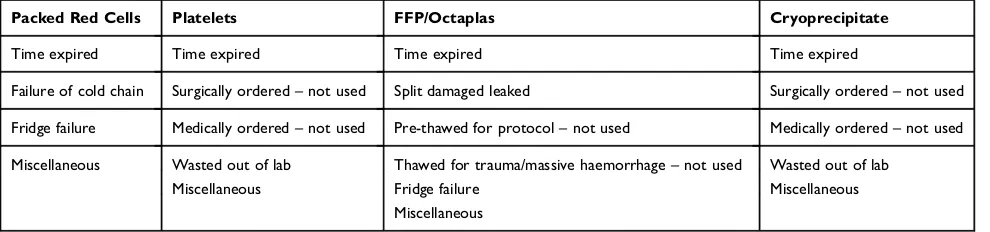
Table 1Blood Product and Blood Component Wastage Categorization
Packed Red Cells Platelets FFP/Octaplas Cryoprecipitate
Time expired Time expired Time expired Time expired
Failure of cold chain Surgically ordered–not used Split damaged leaked Surgically ordered–not used
Fridge failure Medically ordered–not used Pre-thawed for protocol–not used Medically ordered–not used
Miscellaneous Wasted out of lab Thawed for trauma/massive haemorrhage–not used Wasted out of lab
Miscellaneous Fridge failure Miscellaneous
Miscellaneous
Clinical Audit downloaded from https://www.dovepress.com/ by 118.70.13.36 on 20-Aug-2020
Alcoholic liver disease (20%) is the commonest cause of chronic liver disease necessitating transplantation followed by
hepatocellular carcinoma (16%). About 31% of the patients had two or more presenting aetiologies for liver transplant. The majority of organs were harvested from Donation after Brainstem Death (DBD) donors (75.0%), while the rest came from Donation after Cardiac Death (DCD) donors (24.5%) and Living-related Donor (LD, 0.5%).
Transfusion Characteristics
Our cohort had a median blood loss of 4249 mL (IQR 2830, 6576) per transplant with a range from 300 to 36,000 mL. Patients having a redo procedure bled significantly more than patients having their first transplant, median blood loss of 6540 mL (IQR 4141, 14,000) vs 4000 mL (IQR 2675, 6084) (p=0.0205),Table 3. Patients having a transplant due to acute liver failure also have a higher median blood loss (5450 mL; IQR 3981, 8699), compared to those with chronic liver failure
Table 2Baseline Characteristics
Variable
Gender (male), % 59.7
Age, mean (SD), years 52.1 (13.5)
BMI, mean (SD), kg/m2 26.8 (5.62)
Starting HB value, mean (SD), g/L 113 (25)
Starting INR value, mean (SD) 1.84 (1.5)
Starting platelet count, mean (SD), ×109/L 115 (71) Starting creatinine value, mean (SD),μmol/L 91 (59) Starting bilirubin value, mean (SD),μmol/L 104 (150)
MELD score, mean (SD) 14.5 (10.1)
UKELD score, mean (SD) 55 (6.4)
Abbreviations:BMI, body mass index; HB, haemoglobin; INR, international nor-malised ratio; MELD, Model of End-Stage Liver Disease; UKELD, United Kingdom Model for End-Stage Liver Disease.
21%
16%
15%
13%
10%
6%
5%
2%
2%
2%
1%
0%
7%
ALD
HCC
PSC
NASH
HBV / HCV
PBC
AIH
Polycystic
Previous Kasai
Crypt. Cirrhosis
Haemochromatosis
Wilson
Other
Figure 1Presenting aetiology due to chronic liver disease.
Abbreviations:ALD, alcoholic liver disease; HCC, hepatocellular carcinoma; PSC, primary sclerosing cholangitis; NASH, non-alcoholic steatohepatitis; HBV, hepatitis B virus; HCV, hepatitis C virus; PBC, primary biliary cirrhosis; AIH, autoimmune hepatitis.
Clinical Audit downloaded from https://www.dovepress.com/ by 118.70.13.36 on 20-Aug-2020
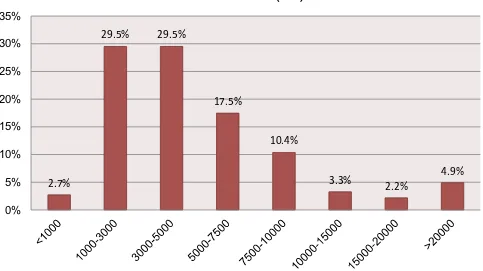
(4000 mL; IQR 2656, 6430) (p=0.0465). Sixty percent of our
patients had a total blood loss in the 1000–5000 mL range
(Figure 2).
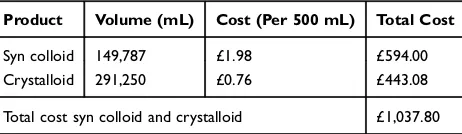
Synthetic colloids were used in 94.2% of all our trans-plants with a median volume transfused (1500 mL; IQR 1000, 2000). On the other hand, crystalloids were only used in 51.6% of our cohort with a median volume of 1000 mL (IQR 589, 2000).
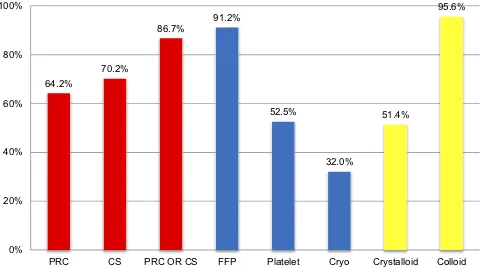
We transfused significantly more blood components and
products than crystalloids or colloids. Sixty-four percent of our patients had a transfusion of packed red cells (PRC,Figure 3). The median PRC transfused is 560 mL (IQR 0, 1400) (Figure 4). Over 70% of the patients received cell salvage blood with a median volume transfused of 623 mL (IQR 0, 767). The use of cell salvage avoided an allogeneic blood
transfusion in 22.2% of the patients who needed a blood transfusion. Thirteen percent of patients did not require any PRC transfusion.
Fresh frozen plasma (FFP) was used extensively in our cohort of patients with 91.2% of the patients receiving a transfusion. The median volume transfused was 1796 mL (IQR 1061, 3125). Platelets and cryoprecipitates were trans-fused in 51.1% and 31.6% of our patients, respectively. Only six patients did not receive any blood or blood product transfusion.
Transfusion Wastage
A total of 147 units of blood and blood products were wasted on a background of 3103 units used during the study period. This equates to a wastage rate of 4.7%. We recorded the highest wastage in FFP, followed by PRC, cryoprecipitates,
and platelets (Table 4). A total of 131 components were
wasted due to“time expired”. This is when a blood compo-nent expires whilst it is issued to a patient. The remaining 16 units were wasted due to the failure to observe the cold chain. This is when there is a period of more than 30 mins where the product has not been within temperature control and therefore cannot be used for another patient.
Table 3 Blood Loss Comparison in Acute or Chronic Liver Failure and in First or Redo Transplantation
ALF CRF P-Value
Blood loss 5450 4000 0.0465
First Transplant Redo Transplant P-Value
Blood loss 4000 6540 0.0205
Abbreviations:ALF, acute liver failure; CRF, chronic liver failure.
2.7%
29.5% 29.5%
17.5%
10.4%
3.3% 2.2% 4.9%
0% 5% 10% 15% 20% 25% 30% 35%
Blood Loss (ml)
Figure 2Distribution of blood loss.
Clinical Audit downloaded from https://www.dovepress.com/ by 118.70.13.36 on 20-Aug-2020
64.2%
70.2%
86.7%
91.2%
52.5%
32.0%
51.4%
95.6%
0% 20% 40% 60% 80% 100%
PRC CS PRC OR CS FFP Platelet Cryo Crystalloid Colloid
Figure 3Percentage of patients transfused.
Abbreviations:PRC, packed red cells; CS, cell salvage blood; FFP, fresh frozen plasma.
0 2000 4000 6000 8000 10000 12000 14000
PRC FFP Platelet Cryo
Product Transfused (ml)
Figure 4Blood and blood products transfused.
Clinical Audit downloaded from https://www.dovepress.com/ by 118.70.13.36 on 20-Aug-2020
In monetary terms, the total cost of a blood component transfusion was £302,000 for our cohort during the study period. This is the cost associated with using blood com-ponents in hospitals and includes storage, issue, transport and administration of the product. This is in contrast to the cost of crystalloids and synthetic colloids, which amounted to £1040. A breakdown of the hospital cost, which includes laboratory service surcharge, of blood
compo-nents is mentioned in Tables 5 and6. The cost of blood
product wastage is £10,800, which comprises 3.6% of our transfusion budget.
Discussion
Our data showed that there was a median blood loss of
4249 mL. This is reflected in our median transfusion rate
of 3242 mL for combined blood and blood products. We transfuse a median of 560 mL of PRC, which is equivalent to 2 units of PRC. Our transfusion requirement and blood loss rate are lower than those reported by other studies. A German group who performed 413 liver transplants over a 5-year period showed an average transfusion of 8.1 (SD
8.1) PRC and 9.5 (SD 7.4) FFP units per case.6Similarly,
a Taiwanese group reported an average blood transfusion
of 4350 mL (SD 6230) for 388 patients per transplant.7
Our significant utilisation of blood products is slightly concerning as increased transfusion requirements are cor-related with worsened outcomes, higher rates of surgical reinterventions, more frequent septic episodes, and pro-longed lengths of stay.8–10 In particular, Massicotte et al showed that a transfusion of 4 units or more of PRC or FFP only reduced the 1-year survival to 62.5% and 76.9%,
respectively, from a baseline of 81.9%.8They also found
that 1-year survival was 97.4% in patients without any transfusion. Despite having a high transfusion rate of PRC and FFP, our 1-year survival is 95%, one of the highest in the country.5 It is likely that other anaesthetic and surgical factors contribute more significantly to survi-val outcomes than blood transfusion per se.
Our usage of FFP is much higher than other studies reported in the literature. Over 90% of our patients received FFP during the intraoperative period. In our practice, FFP is used to correct coagulopathy. evidenced
by thromboelastometry and/or detected clinically.
Although the mean INR and platelet count of 1.84 and
115 do not suggest significant coagulopathy, laboratory
tests are inaccurate in assessing coagulopathy in liver patients as they do not take into account the rebalancing of pro-coagulation and anti-coagulation factors. This is reflected by the fact that 52% of the patients who received FFP had an initial pre-operative INR of <1.5. We will need
to review our data on thromboelastometry to confirm if
clinical suspicion of coagulopathy is justified and also
review the effect of FFP transfusion on patient outcomes.
Blood Wastage
There is currently no data on blood product wastage in the setting of liver transplant. Blood wastage in major trauma studies can range from 0% to 9% for RBCs and from 0% to 7% for plasma and platelets. Cryoprecipitates have the highest wastage rates (7–33%).11In the perioperative set-ting, red blood cell wastage was 4.0% for all surgeries
with the highest rates (8.3%) seen in cardiac surgery.12
A certain level of blood component wastage is difficult to
Table 4Breakdown of Blood Wastage
Blood Wastage Wasted, Units (%) Used, Units
Packed red cells 22 (2.3%) 957
● Time expired 6
● Failure to observe cold chain 16
Platelets 2 (0.9%) 214
● Time expired 2
FFP/Octaplas 116 (6.7%) 1741
● Time expired 116
Cryoprecipitates 7 (3.7%) 191
● Time expired 7
Abbreviation:FFP, fresh frozen plasma.
Table 5Cost of Blood and Blood Components
Product Units Cost Per Unit Total Cost
PRC 957 £142.64 £136,506.50
FFP 1558 £44.34 £69,081.72
Octaplas 183 £86.85 £15,893.55
Platelet 214 £198.06 £42,384.84
Cryo 191 £201.30 £3,8448.30
Total cost of all products £302,314.90
Abbreviations:PRC, packed red cells; FFP, fresh frozen plasma; Cryo, cryoprecipitate.
Table 6Cost of Synthetic Colloid and Crystalloid
Product Volume (mL) Cost (Per 500 mL) Total Cost
Syn colloid 149,787 £1.98 £594.00
Crystalloid 291,250 £0.76 £443.08
Total cost syn colloid and crystalloid £1,037.80
Abbreviation:Syn, synthetic.
Clinical Audit downloaded from https://www.dovepress.com/ by 118.70.13.36 on 20-Aug-2020
avoid when a large number of blood components are dispensed and transfused. Our trust aims to have transfu-sion wastage of less than 3%.
In our study, FFP wastage of 8.6% is much higher than other products. This is due to issues pertaining to thawing time, short post-thaw shelf life and the limited patient groups that unused products can be recycled for.13Studies reviewing the in vitro characteristics of FFP coagulation factors between 24 and 72 hrs found that coagulation factors (V, VII, and protein S) remained above 70% of normal up to 120 hrs post-thaw, except factor VIII which diminished
depend-ing on ABO group by up to 40%.13This was varied across
ABO groups. Protein S and C levels remained stable as pathogen deactivation is not used in UK-sourced FFP. Factor VIII levels were 68% of the normal value (the highest) in group A FFP, hence the British Society of Haematology (BSH) recommendation to use group A FFP as the universal group for plasma in trauma and major haemorrhage. The extended shelf life of NHSBT-sourced FFP is only recom-mended for trauma patients, meaning that these products could not be recycled for liver transplant patients. In addition, the use of ABO-specific FFP in liver patients means that any FFP not used cannot always be recycled to trauma patients.
The lengthy thaw process of 25–35 mins for frozen
components often leads to overmature or premature ordering as clinicians are concerned that delays may occur in product
availability.11 The NHSBT service and Octapharma®, the
main providers of FFP, have introduced initiatives to improve overall wastage, including increasing post-thaw shelf life, but these changes are difficult to implement and are often only targeted at particular patient groups, not including liver transplantation, due to the concerns relating to the stability of coagulation factors.13,14
One solution may be to begin the thawing process for FFP only when the transplant has started and identifying patients who may be at a higher risk of bleeding as opposed to holding the same quantity of products for all patients. Issues with thawing times could be improved by introducing rapid thaw devices at a cost, but would still depend on a change in clinical behaviour. The demo-graphics of patients that require FFP will not change, but by addressing education relating to local product availabil-ity, turnaround time and appropriate use of components, it may help to improve ordering behaviour.
The overall wastage of PRC (2.2%) and platelets (0.9%) is low in our liver transplantation setting as there are patient blood management initiatives in place. When wastage does occur, it is often due to short-dated components and poor
product recycling.15 Failure to observe the cold chain
resulted in the wastage of some components which should be easily addressed through training. Even though 0.9% of platelets were wasted, 43% of all issued platelets were returned to stock. It reflects a picture of over-ordering but with low wastage outcomes. This is due to the large trauma, haematology, and cardiac department with patients that can receive platelets that are unused.
A change in anaesthetic practice may help reduce wastage and cost of blood products through the reduction of transfusion requirements. By applying the principles of low central venous pressure (CVP), intraoperative
phlebot-omy, avoidance of FFP and use of antifibrinolytics
demon-strated by Massicotte et al, a significant reduction in blood loss may be achieved and consequently a smaller need for
blood replacement.16 Depending on the clinical
circum-stance, it may be possible to reduce FFP transfusion by correcting coagulopathy using prothrombin complex concen-trate (PCC) and using synthetic colloid and crystalloids for volume replacement instead. PCC is a plasma-derived con-centrate of vitamin K–dependent clotting factors II, VII, IX, and X. Some preparation may also continue Protein C and Protein S. Experience using PCC in liver transplant is limited to a few small studies but appears to be safe.17Utmost care must be taken to ensure that outcomes are not adversely affected by any change of practice.
Lastly, the maximum surgical blood ordering schedule (MSBOS) for liver transplantation will need to be reviewed as it does not take into account patient and surgical factors. Current practice involves cross-matching 6 units of PRC and thawing 4 units of FFP in all cases. However, the number and composition of blood product utilised varies significantly as it is dependent on surgical complexity and pre-existing coa-gulopathy. We aim to review our data to determine risk factors for massive transfusion and update MSBOS for different patient sub-groups in liver transplantation and determine if it improves our wastage rates.
Limitations
Our review is limited by its retrospective design. The data we obtained from our study were based on anaesthetists' and surgeons' estimates of blood loss, which may vary consider-ably from the actualfigure.18These effects are mitigated by reviewing individual sources of blood loss such as from swab weights and suction devices. Inaccuracies in recording volume of blood or non-blood products transfused are reduced by comparing the volume documented to the elec-tronic record of blood dispensed by BloodTrack.
Clinical Audit downloaded from https://www.dovepress.com/ by 118.70.13.36 on 20-Aug-2020
Conclusion
Liver transplantation is associated with significant intrao-perative bleeding and transfusion of multiple blood pro-ducts. Over 95% of the patients in our cohort required transfusion of at least one blood product. The commonest
causes for blood wastage are “time expired”and“failure
to observe cold chain”. Changing blood component
order-ing habits, staff trainorder-ing and awareness, and anaesthetic practice may reduce wastage of this precious commodity.
Acknowledgment
We would like to thank Dr Louise Gent and Ms Shirin Khorsandi for assisting with data collection.
Disclosure
Dr Zoka Milan is Editor-in-Chief for Clinical Audit Journal. The authors report no other conflicts of interest in this work.
References
1. Rana A, Petrowsky H, Hong JC, et al. Blood transfusion requirement during liver transplantation is an important risk factor for mortality.J Am Coll Surg.2013;216(5):902–907. doi:10.1016/j.jamcollsurg.2012.12.047 2. Javadzadeh Shahshahani H, Taghvai N. Blood wastage management in a regional blood transfusion centre.Transfusion Med.2017;27(Suppl 5):348–353. doi:10.1111/tme.12433
3. Kurup R, Anderson A, Boston C, Burns L, George M, Frank M. A study on blood product usage and wastage at the public hospital, Guyana.BMC Res Notes.2016;9:307. doi:10.1186/s13104-016-2112-5 4. MRC NHS Research Ethics. Committee online decision tool. Available from:http://www.hra-decisiontools.org.uk/ethics/. Accessed September 10, 2019.
5. NHS Blood and Transplant. Annual report on liver transplantation 2018. Available from: https://nhsbtdbe.blob.core.windows.net/ umbraco-assets-corp/12250/nhsbt-liver-transplantation-annual-report
-2017-2018.pdf. Accessed February 27, 2019.
6. Schumacher C, Eismann H, Sieg L, et al. Use of rotational throm-boelastometry in liver transplantation is associated with reduced transfusion requirements. Exp Clin Transplant.2018. doi:10.6002/ ect.2017.0236
7. Huang CJ, Chang CH, Cheng KW, et al. Correlation between blood transfusion and blood glucose levels in adult living donor liver transplantation.Transplant Proc.2018;50(9):2645–2647. doi:10.101 6/j.transproceed.2018.02.203
8. Massicotte L, Sassine M-P, Lenis S, et al. Survival rate changes with transfusion of blood products during liver transplantation. Can J Anaesth.2005;52:148. doi:10.1007/BF03027720
9. Hendriks HG, van der Meer J, de Wolf JT, et al. Intraoperative blood transfusion requirement is the main determinant of early surgical re-intervention after orthotopic liver transplantation.Transplant Int.
2005;17(11):673–679. doi:10.1007/s00147-004-0793-5
10. Findlay JY, Rettke SR. Poor prediction of blood transfusion require-ments in adult liver transplantations from preoperative variables. J Clin Anaesth.2000;12(4):319–323.
11. Dunbar NM, Olson NJ, Szczepiorkowski ZM, et al. Blood compo-nent transfusion and wastage rates in the setting of massive transfu-sion in three regional trauma centers.Transfusion.2016;57(1):45–52. doi:10.1111/trf.13880
12. Whitney GM, Woods MC, France DJ, et al. Reducing intraoperative red blood cell unit wastage in a large academic medical center. Transfusion.2015;55(11):2752–2758. doi:10.1111/trf.13214 13. Cardigan R, Green L. Thawed and liquid plasma–what do we know?.
Vox Sang.2015;109:1–10. doi:10.1111/vox.2015.109.issue-1 14. Cardigan R, Green L. Summary Sheet: review of the shelf of frozen
plasma components following thawing, Joint UKBTS Professional Advisory Committee.JPAC.2015;15–89.
15. Yates N, Wilding S. Approaches to assessing and minimising blood wastage in the hospital and blood supply chain. ISBT Sci Ser.
2011;12010:111.
16. Massicotte L, Denault AY, Beaulieu D, et al. Transfusion rate for 500 consecutive liver transplantations: experience of one liver transplan-tation center.Transplantation.2012;93(12):1276–1281. doi:10.1097/ TP.0b013e318250fc25
17. Kirchner C, Dirkmann D, Treckmann JW, et al. Coagulation manage-ment with factor concentrates in liver transplantation: a single-center experience.Transfusion.2014;54(10 Pt 2):2760–2768.
18. Rothermel LD, Lipman JM. Estimation of blood loss is inaccurate and unreliable. Surgery. 2016;160(4):946–953. doi:10.1016/j.surg. 2016.06.006
Clinical Audit
Dove
press
Publish your work in this journal
Clinical Audit is an international, peer-reviewed, open access journal focusing on the processes and outcomes of clinical audit in any area of healthcare. All aspects of patient care are addressed within the journal and practitioners from all disciplines are invited to submit their work. Areas covered include: Publication of audits; How an audit has changed practice; Practical tips on how to do audits and to
avoid pitfalls; How audits have changed patient care; Calls and justifications for new audits. The manuscript management system is completely online and includes a very quick and fair peer-review system, which is all easy to use. Visit http://www.dovepress.com/ testimonials.php to read real quotes from published authors.
Submit your manuscript here:https://www.dovepress.com/clinical-audit-journal
Clinical Audit downloaded from https://www.dovepress.com/ by 118.70.13.36 on 20-Aug-2020