Cancer Management and Research
Dove
press
O R I G I N A L R E S E A R C H
open access to scientific and medical research
Open Access Full Text Article
Association of mRNA expression of TP53 and
the TP53 codon 72 Arg/Pro gene polymorphism
with colorectal cancer risk in Asian population:
a bioinformatics analysis and meta-analysis
Zhiyong Dong1,2,*
Longzhi Zheng2,*
Weimin Liu1
Cunchuan Wang1
1Department of Gastrointestinal
Surgery, The First Affiliated Hospital of Jinan University, Guangzhou, China;
2Department of Surgery, The Affiliated
Hospital of Putian University, Putian, China
*These authors contributed equally to this work
Background:The relationship between TP53 codon 72 Pro/Arg gene polymorphism and colorectal cancer risk in Asians is still controversial, and this bioinformatics analysis and meta-analysis was performed to assess the associations.
Methods:The association studies were identified from PubMed, and eligible reports were included. RevMan 5.3.1 software, Oncolnc, cBioPortal, and Oncomine online tools were used for statistical analysis. A random/fixed effects model was used in meta-analysis. The data were reported as risk ratios or mean differences with corresponding 95% CI.
Results:We confirmed that TP53 was associated with colorectal cancer, the alteration frequency of TP53 was 53% mutation and 7% deep deletion, and TP53 mRNA expression was different in different types of colorectal cancer based on The Cancer Genome Atlas database. Then, 18 studies were included that examine the association of TP53 codon 72 gene polymorphism with colorectal cancer risk in Asians. The meta-analysis indicated that TP53 Pro allele and Pro/Pro genotype were associated with colorectal cancer risk in Asian population, but Arg/Arg genotype was not (Pro allele: odds ratios [OR]=1.20, 95% CI: 1.06 to 1.35, P=0.003; Pro/Pro genotype: OR=1.39, 95% CI: 1.15 to 1.69, P=0.0007; Arg/Arg genotype: OR=0.86, 95% CI: 0.74 to 1.00, P=0.05). Interestingly, in the meta-analysis of the controls from the population-based studies, we found that TP53 codon 72 Pro/Arg gene polymorphism was associated with colorectal cancer risk (Pro allele: OR=1.33, 95% CI: 1.15 to 1.55, P=0.0002; Pro/Pro genotype: OR=1.61, 95% CI: 1.28 to 2.02, P<0.0001; Arg/Arg genotype: OR=0.77, 95% CI: 0.63 to 0.93, P=0.009).
Conclusion: TP53 was associated with colorectal cancer, but the different value levels of mRNA expression were not associated with survival rate of colon and rectal cancer. TP53 Pro allele and Pro/Pro genotype were associated with colorectal cancer risk in Asians.
Keywords:colorectal carcinoma, TP53 codon 72, gene polymorphism, mutation, bioinformat-ics analysis, meta-analysis
Introduction
Colorectal cancer, associated with multiple genetic alterations, is the third most com-mon cancer diagnosis and the second and third leading cause of cancer mortality in men and women, respectively.1,2 However, the majority of colorectal cancer cases is
the result of sporadic tumorigenesis via the adenoma–carcinoma sequence. Although the survival rate of patients with colorectal cancer has improved, it is still lower than that of patients with other types of cancer.3 Finding a gene marker that can allow for
better screening and earlier diagnosis of colorectal cancer could improve outcomes. Correspondence: Cunchuan Wang
Department of Surgery, The First Affiliated Hospital of Jinan University, No. 613 Huangpu Avenue West, Guangzhou 510630, China
Tel/Fax +86 20 3868 8610 Email [email protected]
Journal name: Cancer Management and Research Article Designation: ORIGINAL RESEARCH Year: 2018
Volume: 10
Running head verso: Dong et al
Running head recto: TP53 Pro allele and Pro/Pro genotype with colorectal cancer risk DOI: http://dx.doi.org/10.2147/CMAR.S164892
Cancer Management and Research downloaded from https://www.dovepress.com/ by 118.70.13.36 on 20-Aug-2020
For personal use only.
Dovepress
Dong et al
The tumor protein p53 gene (TP53), located on chromo-some 17p13, contains homozygous mutations in 50%–60% of human cancers.4,5 About 90% of these mutations encode
mis-sense mutant proteins that span ~190 different codons local-ized in the DNA-binding domain of the gene and protein.5
TP53 Arg72Pro mutation (rs1042522), a transversion of CGC to CCC (Arg to Pro), creates three different genotypes: CGC/CGC (Arg/Arg), CGC/CCC (Arg/Pro), and CCC/CCC (Pro/Pro). These forms of p53 differ in their ability to induce growth arrest and apoptosis.6 These mutations produce a
protein with a reduced capacity to bind to a specific DNA sequence that regulates the p53 transcriptional pathway.6
Several studies reported that the mutation or alterations of TP53 gene have an effect on the prognosis and treatment of cancer.7–11 TP53 codon 72 Pro/Arg gene polymorphism has
also been reported to be associated with colorectal cancer outcome.12–29
Therefore, determining the relationship of TP53 gene polymorphism and mutation with colorectal cancer will provide important clinical insight. Overall survival, muta-tion, and correlation analysis of TP53 were made using the Oncolnc, Oncomine, and cBioPortal online tools based on The Cancer Genome Atlas (TCGA) database. A meta-analysis was also conducted to assess these associations.
Methods
Bioinformatics analysis
TCGA (http://cancergenome.nih.gov/) provides researchers with extraordinary amounts of molecular data with cancer information. The cBioPortal (online tool, www.cbioportal. org, based on TCGA database) and the Oncomine (online tool, www.oncomine.org/, based on TCGA database) were used to identify and confirm the correlation of TP53 with cancers or colorectal cancer.30,31 cBioPortal was also used
to identify the mutation status of TP53 gene. The Oncolnc (online tool, http://www.oncolnc.org, based on TCGA data-base) was conducted to perform the survival analysis of TP53 in colorectal cancer. Column analyses (Scatter) and T-test were performed using GraphPad Prism version 6.0 (Graph-Pad Software, La Jolla, CA, USA, www.graphpad.com).
Meta-analysis
Search strategy
The search was conducted in the databases of PubMed on October 1, 2017, and the relevant investigations were included. The retrieval strategy of “(colorectal cancer OR colorectal carcinoma) AND polymorphism AND TP53” was entered into the PubMed database.
Inclusion criteria were as follows: 1) the outcome must be colorectal cancer; 2) the study included two comparison groups (case group vs. control group); and 3) the report should give the data of TP53 genotype distribution.
Exclusion criteria were as follows: 1) Case reports, editorials, and review articles; 2) preliminary result not on TP53 gene polymorphism or colorectal cancer; and 3) investigating the role of TP53 gene expression in colorectal cancer risk.
Data extraction
For the full-text articles that were retrieved, two investigators independently reviewed and checked the included reports to assess the available data and randomization. First author’s surname, year of publication, ethnicity, source of the control group, and the number of cases and controls for TP53 were extracted from each recruited investigation. Frequencies of allele of TP53 were calculated for case group and control group.
Statistical analysis
RevMan 5.3 was used for this meta-analysis. For dichoto-mous data, we calculated odds ratios (ORs) corresponding to 95% CI. The heterogeneity was evaluated by the Q-test and I2 statistic. The I2 statistic ranges from 0% to 100%, a
value of 0% indicated no observed heterogeneity and larger values show increasing heterogeneity. If I2<50% and P-value
≥0.1, we considered heterogeneity was not significant, and the fixed-effects model was used for analysis. Otherwise, the potential inconsistency among all included studies was analyzed carefully. If the heterogeneity was not excluded, we used the random-effects model.32
Results
The relationship of TP53 with colorectal
cancer and TP53 mRNA expression in
colorectal cancer
The information on TP53 genes was freely available in Onco-mine online tool. It was confirmed that TP53 was associated with colorectal cancers based on TCGA datasets (Figure 1A). The TP53 mRNA expression was shown in different types of colorectal cancer based on TCGA colorectal cancer datasets (237 samples, 20,423 measured genes; Figure 1B). It indicated that there was much more alteration frequency of mutation and deep deletion in rectal adenocarcinoma. The top three significant mRNA expressions were colon mucinous adenocarcinoma (P=1.11E−5, fold change=1.668, 22 samples), rectal adenocarcinoma (P=6.31E−6, fold
Cancer Management and Research downloaded from https://www.dovepress.com/ by 118.70.13.36 on 20-Aug-2020
Dovepress TP53 Pro allele and Pro/Pro genotype with colorectal cancer risk
change=1.633, 60 samples), and cecum adenocarcinoma (P=4.55E−4, fold change=1.827, 22 samples) compared with normal samples (22 samples; Figure 1C). It suggested that TP53 mRNA expression was different in different types of colorectal cancer. Figure 1D shows that TP53 mRNA expres-sion rate was highly expressed in colorectal cancer tissues relative to normal colorectal tissues, and it has statistical significance between the two groups (95% CI [−0.9922 to −0.0705], P=0.007).
The characters of the gene set of TP53
altered in 212 samples
We used cBioPortal to display the following information about TP53 based on TCGA (Nature 2012) database. The total mutations, cancer type detail, overall survival, mutation fusion amp homdel, and heat map are shown in Figure 2A. There are three types of colorectal cancer (rectal adenocarci-noma [ERAD], colon adenocarciadenocarci-noma [COAD], and colorec-tal adenocarcinoma) shown. The alteration frequency of
Figure 1 (A) The association of TP53 with colorectal cancer; the redder the square, the more related with cancer. (B) The mutation and deletion frequency in rectal cancer. (C) The log2 median-centered ratio of the different types of colorectal cancer compared with normal samples. (D) The mRNA expression rate of TP53 in colorectal cancer and normal samples.
Analysis type by cancer
A B
C D
Bladder cancer
Cancer vs. Normal
Cancer vs. cancer
Cancer histology Multi-cancer
Brain and CNS cancer Breast cancer Cervical cancer Colorectal cancer Esophageal cancer Gastric cancer Head and neck cancer Kidney cancer Leukemia Liver cancer Lung cancer Lymphoma Melanoma Myeloma Other cancer Ovarian cancer Pancreatic cancer Prostate cancer Sarcoma
15 8 5
5 2 3
Rectal ad enocarcinom
a
Colon ad enocarcinom
a
Color ectal adenocarcinom
a
Alteration frequency (%
)
0 10 20 30 40 50 60 70
80 Cancer type detailed summary
Mutation Deep deletion
1
1 2
1
5 1 1
1 1
1
1 1
3
1
443 750 271
Significant unique analyses Total unique analyses
Total unique analyses
–2.5
0 1 2 3
1 5 10 10 5
% 1
4 5 6 7
Normal Colorectal cancer
–6 –4 –2 0 2
TP53 mRNA
expression
–2.0 –1.5 –1.0 –0.5 0.0 0.5
log
2
median-centered ratio
1.0 1.5 2.0
Cancer Management and Research downloaded from https://www.dovepress.com/ by 118.70.13.36 on 20-Aug-2020
Dovepress
Dong et al
TP53 is shown in Figure 2A, 53% (112/212 sequenced cases/ patients) was mutation and 7% was deep deletion (Figure 2A). The overall survival range was from 1.94 to 69.98 months (Figure 2A). The heatmap shows the mRNA expression level of TP53 in 212 sequenced cases. The network contains 51 nodes, including TP53 gene and the 50 most frequently altered neighbor genes (50/222), and the top three (APAF1, APC, ASF1A) are marked with round symbols (Figure 2B). This indicated that TP53 alteration was closely related to these neighbor genes. Figure 2C shows the overall survival Kaplan–Meier estimate of cases with or without alterations (Logrank Test P-value=0.179). It suggested that there is no significant difference in overall survival in the two groups.
The Kaplan plot and RNA expression
level for TP53
The survival information of TP53 gene was freely available in Oncolnc online tool (Based on TCGA database, 440 patients in COAD, and 159 patients in ERAD). It was found that the
low RNA expression of TP53 group was worse than high expression in overall survival for COAD (Logrank P=0.253), and the mortality of the low expression group was 22/110, compared to 19/110 in the high group (P>0.05; Figure 3A). However, low RNA expression of TP53 is better than high expression in overall survival of READ (Logrank P=0.525). The mortality of the low expression group was 4/39, compared to 5/39 in the high expression group (P>0.05; Figure 3B). But, there was no statistically significant difference in the survival rate of high and low expression groups in both COAD and READ. This suggested that the different expression levels of mRNA might have little correlation with the survival rate.
Association of TP53 codon 72 Pro/Arg
gene polymorphism with colorectal
cancer risk
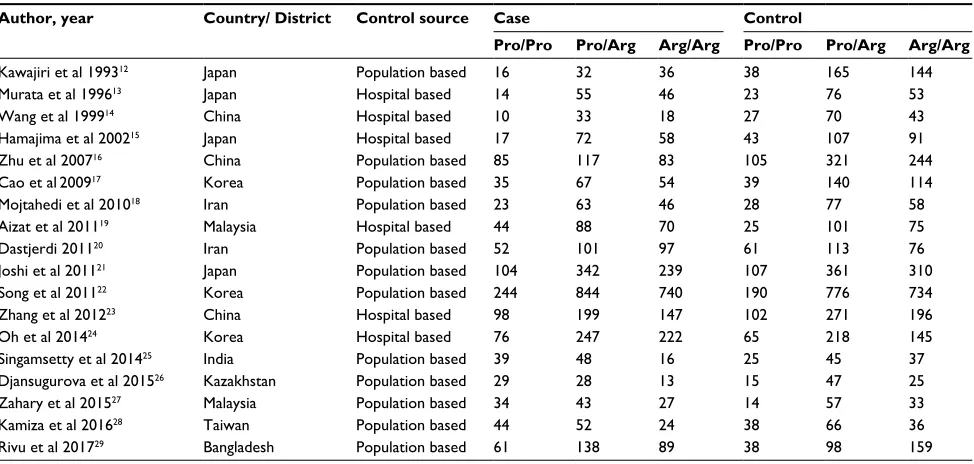
Eighteen studies about the relationship between TP53 codon 72 Pro/Arg gene polymorphism and colorectal cancer risk were included in this meta-analysis (Table 1). We found
Figure 2 (A) The mutation, cancer type, overall survival, and heatmap in TP53. (B) The frequently altered neighbor genes of TP53. (C) The overall survival of TP53 alteration compared with nonalteration.
Abbreviation: N/A, not applicable. Total mutations
A
B C
Cancer type detailed Overall survival (months)
TP53 53%
No alterations
Rectal adenocarcinoma Colon adenocarcinoma Colorectal adenocarcinoma
N/A
N/A
0
Months survival (n)
Cases with alteration(s) in query gene(s) Cases without alteration(s) in query gene(s) Logrank test P-value: 0.179
0 10 20 30 40 50 60 70
10 20 30 40 50 60 70
Surviving
80 90 100 0
–3 3
69.98
Deep deletion Truncating mutation (putative driver) Missense mutation (putative driver)
9921 TP53
Genetic alteration
Total mutations
Cancer type detailed
Overall survival (months)
Heatmap
Cancer Management and Research downloaded from https://www.dovepress.com/ by 118.70.13.36 on 20-Aug-2020
Dovepress TP53 Pro allele and Pro/Pro genotype with colorectal cancer risk
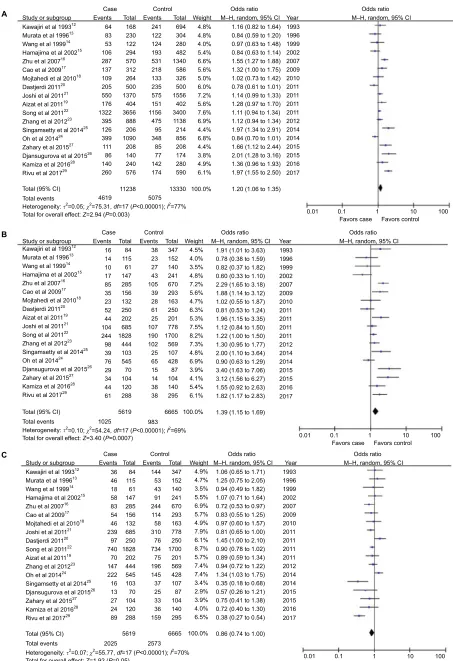
that TP53 Pro allele and Pro/Pro genotype were associated with colorectal cancer risk, but Arg/Arg genotype was not (Pro allele: OR=1.20, 95% CI: 1.06 to 1.35, P=0.003; Pro/ Pro genotype: OR=1.39, 95% CI: 1.15 to 1.69, P=0.0007; Arg/Arg genotype: OR=0.86, 95% CI: 0.74 to 1.00, P=0.05; Table 2; Figure 4A–C).
Association of TP53 codon 72 Pro/Arg
gene polymorphism with colorectal
cancer risk according to the control
source
The controls in 12 population-based studies of the relation-ship between TP53 codon 72 Pro/Arg gene polymorphism
and colorectal cancer risk were included in this meta-analysis. We found that TP53 codon 72 Pro/Arg gene poly-morphism was associated with colorectal cancer risk (Pro allele: OR=1.33, 95% CI: 1.15 to 1.55, P=0.0002; Pro/Pro genotype: OR=1.61, 95% CI: 1.28 to 2.02, P<0.0001; Arg/ Arg genotype: OR=0.77, 95% CI: 0.63 to 0.93, P=0.009; Table 2).
The controls in six hospital-based studies of the relation-ship between TP53 codon 72 Pro/Arg gene polymorphism and colorectal cancer risk were included in this meta-analysis. We found that TP53 codon 72 Pro/Arg gene polymorphism was not associated with colorectal cancer risk (Pro allele: OR=0.98, 95% CI: 0.84 to 1.14, P=0.77; Pro/Pro genotype:
Figure 3 (A) The overall survival of RNA expression of TP53 in COAD.(B) The overall survival of RNA expression of TP53 in READ.
Abbreviations: COAD,colon adenocarcinoma; READ, rectal adenocarcinoma.
100
A
B
Low
N=110 N=110High Logrank P-value=0.525 (COAD)
Low
N=39 N=39High Logrank P-value=0.253 (READ)
80
60
% Surviving 40
20
0
100
80
60
% Surviving 40
20
0
0 500 1000 1500 2000
Days 2500 3000 3500 4000
0 500 1000 1500 2000
Days 2500 3000 3500 4000
Cancer Management and Research downloaded from https://www.dovepress.com/ by 118.70.13.36 on 20-Aug-2020
Dovepress
Dong et al
OR=1.03, 95% CI: 0.75 to 1.41, P=0.88; Arg/Arg genotype: OR=1.09, 95% CI: 0.94 to 1.26, P=0.27; Table 2).
Discussion
In this informatics analysis, we confirmed that TP53 was associated with colorectal cancer, the alteration frequency of TP53 was 53% mutation and 7% deep deletion, and TP53 mRNA was highly expressed in colorectal cancer tissues compared with normal colorectal tissues. Additionally, the different expression levels of mRNA might have no correla-tion with the survival rate either in the COAD group or READ group (P>0.05). It seems that in the READ group, the group with a lower level of mRNA expression had a higher overall survival. TP53 alteration frequency was different in different types of colorectal cancer, so we hypothesized that mutation or alteration of TP53 may play a key role in colorectal cancer.
TP53 Arg72Pro mutation (rs1042522), one of the mutations in TP53, creates three different genotypes: Arg/Arg, Arg/ Pro, and Pro/Pro. It is reported that the mutation or altera-tions of TP53 gene have a certain effect on the prognosis and treatment of cancer.7–11 Dahabreh et al33 indicated that
TP53 Arg72Pro gene polymorphism has no relationship with colorectal cancer in White (4961 cases, 5647 controls) and East Asian populations (968 cases, 2031 controls). Abder-rahmane et al34 also reported that there was no significant
association between TP53 Arg72Pro and colorectal cancer in the Algerian population. However, a HuGE review and meta-analysis (18,718 case and 21,261 controls) showed that the TP53 Arg72Pro gene polymorphism increases risk of cancer in Asians and Americans only.35 There is still controversy.
In this study, meta-analysis was conducted to see which genotype was more associated with colorectal cancer risk in
Table 1 Characteristics of the studies evaluating the effects of p53 codon 72 Arg/Pro gene polymorphism on colorectal cancer risk Author, year Country/ District Control source Case Control
Pro/Pro Pro/Arg Arg/Arg Pro/Pro Pro/Arg Arg/Arg
Kawajiri et al 199312 Japan Population based 16 32 36 38 165 144
Murata et al 199613 Japan Hospital based 14 55 46 23 76 53
Wang et al 199914 China Hospital based 10 33 18 27 70 43
Hamajima et al 200215 Japan Hospital based 17 72 58 43 107 91
Zhu et al 200716 China Population based 85 117 83 105 321 244
Cao et al200917 Korea Population based 35 67 54 39 140 114
Mojtahedi et al 201018 Iran Population based 23 63 46 28 77 58
Aizat et al 201119 Malaysia Hospital based 44 88 70 25 101 75
Dastjerdi 201120 Iran Population based 52 101 97 61 113 76
Joshi et al 201121 Japan Population based 104 342 239 107 361 310
Song et al 201122 Korea Population based 244 844 740 190 776 734
Zhang et al 201223 China Hospital based 98 199 147 102 271 196
Oh et al 201424 Korea Hospital based 76 247 222 65 218 145
Singamsetty et al 201425 India Population based 39 48 16 25 45 37
Djansugurova et al 201526 Kazakhstan Population based 29 28 13 15 47 25
Zahary et al 201527 Malaysia Population based 34 43 27 14 57 33
Kamiza et al 201628 Taiwan Population based 44 52 24 38 66 36
Rivu et al 201729 Bangladesh Population based 61 138 89 38 98 159
Table 2 Meta-analysis of the association of the effects of p53 codon 72 Arg/Pro gene polymorphism on colorectal cancer risk Genetic
contrasts
Number of studies
Q-test
P-value
Model selected
OR (95%CI)
P-value
Pro allele vs. Arg allele 18 <0.00001 Random 1.20 (1.06 to 1.35) 0.003
Pro/Pro vs. (Pro/Arg+Arg/Arg) 18 <0.00001 Random 1.39 (1.15 to 1.69) 0.0007
Arg/Arg vs. (Pro/Arg+Pro/Pro) 18 <0.00001 Random 0.86 (0.74 to 1.00) 0.05
Population
Pro allele vs. Arg allele 12 <0.00001 Random 1.33 (1.15 to 1.55) 0.0002
Pro/Pro vs. (Pro/Arg+Arg/Arg) 12 0.0002 Random 1.61 (1.28 to 2.02) <0.0001
Arg/Arg vs. (Pro/Arg+Pro/Pro) 12 <0.0001 Random 0.77 (0.63 to 0.93) 0.009
Hospital
Pro allele vs. Arg allele 6 0.08 Random 0.98 (0.84 to 1.14) 0.77
Pro/Pro vs. (Pro/Arg+Arg/Arg) 6 0.04 Random 1.03 (0.75 to 1.41) 0.88
Arg/Arg vs. (Pro/Arg+Pro/Pro) 6 0.42 Fixed 1.09 (0.94 to 1.26) 0.27
Abbreviation: OR, odds ratio.
Cancer Management and Research downloaded from https://www.dovepress.com/ by 118.70.13.36 on 20-Aug-2020
Dovepress TP53 Pro allele and Pro/Pro genotype with colorectal cancer risk
Figure 4 (A) The forest plot of the association between Pro allele and colorectal cancer risk. (B) The forest plot of the association between Pro/Pro genotype and colorectal
Kawajiri et al 199312 Murata et al 199613 Wang et al 199914 Hamajima et al 200215 Zhu et al 200716 Cao et al 200917 Mojtahedi et al 201018 Dastjerdi 201120 Joshi et al 201121 Aizat et al 201119 Song et al 201122 Zhang et al 201223 Singamsetty et al 201425 Oh et al 201424 Zahary et al 201527 Djansugurova et al 201526 Kamiza et al 201628 Rivu et al 201729
Kawajiri et al 199312 Murata et al 199613 Wang et al 199914 Hamajima et al 200215 Zhu et al 200716 Cao et al 200917 Mojtahedi et al 201018 Joshi et al 201121 Dastjerdi 201120 Song et al 201122 Aizat et al 201119 Zhang et al 201223 Oh et al 201424 Singamsetty et al 201425 Djansugurova et al 201526 Zahary et al 201527 Kamiza et al 201628 Rivu et al 201729 Kawajiri et al 199312 Murata et al 199613 Wang et al 199914 Hamajima et al 200215 Zhu et al 200716 Cao et al 200917 Mojtahedi et al 201018 Dastjerdi 201120 Aizat et al 201119 Joshi et al 201121 Song et al 201122 Zhang et al 201223 Singamsetty et al 201425 Oh et al 201424 Djansugurova et al 201526 Zahary et al 201527 Kamiza et al 201628 Rivu et al 201729 Study or subgroup
A
B
C
Study or subgroup
Case Control Events 64 168 230 122 294 570 312 264 500 1370 404 3656 888 206 1090 208 140 240 576 241 122 124 193 531 218 133 235 575 151 1156 475 95 348 85 77 142 174 694 304 280 482 1340 586 326 500 1556 402 3400 1138 214 856 208 174 280 590 13330 4.8% 1993 1996 1999 2002 2007 2009 2010 2011 2011 2011 2011 2012 2014 2014 2015 2015 2016 2017 0.01 0.1
Favors case 1Favors control10 100
0.01 0.1
Favors case1Favors control10 100
0.01 0.1
Favors case 1Favors control10 100 1993 1996 1999 2002 2007 2009 2010 2011 2011 2011 2011 2012 2014 2014 2015 2015 2016 2017 1993 1996 1999 2002 2007 2009 2010 2011 2011 2011 2011 2012 2014 2014 2015 2015 2016 2017 1.16 (0.82 to 1.64) 0.84 (0.59 to 1.20) 0.97 (0.63 to 1.48) 0.84 (0.63 to 1.14) 1.55 (1.27 to 1.88) 1.32 (1.00 to 1.75) 1.02 (0.73 to 1.42) 0.78 (0.61 to 1.01) 1.14 (0.99 to 1.33) 1.28 (0.97 to 1.70) 1.11 (0.94 to 1.34) 1.12 (0.94 to 1.34) 1.97 (1.34 to 2.91) 0.84 (0.70 to 1.01) 1.66 (1.12 to 2.44) 2.01 (1.28 to 3.16) 1.36 (0.96 to 1.93) 1.97 (1.55 to 2.50)
1.20 (1.06 to 1.35)
1.91 (1.01 to 3.63)
1.06 (0.65 to 1.71) 1.25 (0.75 to 2.05) 0.94 (0.49 to 1.82) 1.07 (0.71 to 1.64) 0.72 (0.53 to 0.97) 0.83 (0.55 to 1.25) 0.97 (0.60 to 1.57) 0.81 (0.65 to 1.00) 1.45 (1.00 to 2.10) 0.90 (0.78 to 1.02) 0.89 (0.59 to 1.34) 0.94 (0.72 to 1.22) 1.34 (1.03 to 1.75) 0.35 (0.18 to 0.68) 0.57 (0.26 to 1.21) 0.75 (0.41 to 1.38) 0.72 (0.40 to 1.30) 0.38 (0.27 to 0.54)
0.86 (0.74 to 1.00) 0.78 (0.38 to 1.59) 0.82 (0.37 to 1.82) 0.60 (0.33 to 1.10) 2.29 (1.65 to 3.18) 1.88 (1.14 to 3.12) 1.02 (0.55 to 1.87) 0.81 (0.53 to 1.24) 1.96 (1.15 to 3.35) 1.12 (0.84 to 1.50) 1.22 (1.00 to 1.50) 1.30 (0.95 to 1.77) 2.00 (1.10 to 3.64) 0.90 (0.63 to 1.29) 3.40 (1.63 to 7.06) 3.12 (1.56 to 6.27) 1.55 (0.92 to 2.63) 1.82 (1.17 to 2.83)
1.39 (1.15 to 1.69) 4.8% 4.0% 5.4% 6.6% 5.6% 5.0% 6.0% 7.2% 5.6% 7.6% 6.9% 4.4% 6.8% 4.4% 3.8% 4.9% 6.1% 100.0% 11238 83 53 106 287 137 109 205 550 176 1322 395 126 399 111 86 140 260 4619 16 14 10 17 85 35 23 52 44 104 244 98 39 76 29 34 44 61 36 46 18 58 83 54 46 239 97 740 70 147 222 16 13 27 24 89 2025 84 115 61 147 285 156 132 685 250 1828 202 444 545 103 70 104 120 288 5619 2573 144 53 43 91 244 114 58 310 76 734 75 196 145 37 25 33 36 159 347 152 140 241 670 293 163 778 250 1700 201 569 428 107 87 104 140 295 6665 84 115 61 147 285 156 132 250 202 685 1828 444 103 545 70 104 120 288 38 23 27 43 105 39 28 61 25 107 190 102 25 65 15 14 38 38 347 152 140 241 670 293 163 250 201 778 1700 569 107 428 87 104 140 295 6665 4.5% 4.0% 3.5% 4.8% 7.2% 5.6% 4.7% 6.3% 5.3% 7.5% 8.2% 7.3% 4.8% 6.9% 3.9% 4.1% 5.4% 6.1% 4.9% 4.7% 3.5% 5.5% 6.9% 5.7% 4.9% 7.9% 6.1% 8.7% 5.7% 7.4% 7.4% 3.4% 2.9% 3.9% 4.0% 6.5% 100.0% 100.0% 5619 1025 Total (95% CI)
Total events
Total for overall effect: Z=3.40 (P=0.0007)
Heterogeneity: t2=0.10; c2=54.24, df=17 (P<0.00001); I2=69% Total (95% CI)
Total events
Total for overall effect: Z=2.94 (P=0.003)
Heterogeneity: t2=0.05; c2=75.31, df=17 (P<0.00001); I2=77%
Total (95% CI) Total events
Total for overall effect: Z=1.92 (P=0.05)
Heterogeneity: t2=0.07; c2=55.77, df=17 (P<0.00001); I2=70% 983 5075
Total Events Total Weight
Odds ratio
Year M–H, random, 95% CI
Odds ratio M–H, random, 95% CI
Odds ratio M–H, random, 95% CI
Odds ratio M–H, random, 95% CI Case Control
Events Total Events Total Weight
Odds ratio
Year M–H, random, 95% CI
Study or subgroup
Case Control
Events Total Events Total Weight
Odds ratio
Year M–H, random, 95% CI
Cancer Management and Research downloaded from https://www.dovepress.com/ by 118.70.13.36 on 20-Aug-2020
Dovepress
Dong et al
the Asian population. Finally, we found that TP53 Pro allele and Pro/Pro genotype were associated with colorectal cancer risk, but Arg/Arg genotype was not, in the Asian population. In the subgroup analysis, we found that TP53 codon 72 Pro/ Arg gene polymorphism was associated with colorectal cancer risk in the meta-analysis of controls from the population-based trials. However, TP53 codon 72 Pro/Arg gene poly-morphism was not associated with colorectal cancer risk in the meta-analysis of controls from the hospital-based trial.
TP53 is the most frequently mutated tumor promoting gene in cancer.36,37 It was reported that p53-deficiency leads
to a high rate of spontaneous tumors in mice. Moreover, dele-tion of p53 and mutadele-tion of TP53 lead to tumor cell death and promote tumor progression.38 Our study also showed
that there is a high overall survival rate in the READ group ( Figure 3B). It might be because there is much more alteration frequency (mutation, deep deletion) of TP53 in the READ group (Figure 1B). If we could change the TP53 mutation or deletion, it may trigger tumor cell abolition.39 Loes et al40
reported the mutations of KRAS and BRAF to be a strong prognostic parameter in patients with metastatic colorectal cancer after treatment with partial liver resections, but not TP53. Chen et al41 suggested that TP53 and BAX inhibitions
were closely related with STEDB1. Histone methyltransfer-ase SETDB1 inhibits the expression of TP53 to promote the progression of colorectal cancer, so TP53 may play a role by regulating the other genes in colorectal cancer. Our results showed that APAF1, APC, and ASF1A may be three of the most frequently altered neighbor genes. Further research about this association is necessary.
In a previous study, Tian et al42 performed a meta-analysis
aimed to shed new light on the precise association between TP53 variants and colorectal cancer, including 14 studies in Asian population. They reported that TP53 Arg72Pro poly-morphism CC genotype may contribute to an increased risk of colorectal cancer among Asians.43 In our meta-analysis,
we included more studies and found that Pro allele and TP53 Pro/Pro genotype were also associated with colorectal cancer risk, but Arg/Arg genotype was not, in Asian population. The results from our meta-analysis might be more robust. Then, we used the fixed effects model of meta-analysis to pool the OR for the association between TP53 Arg/Arg genotype and colorectal cancer in Asians, and we found that TP53 Arg/Arg genotype was associated with colorectal cancer in Asians. However, Asadi et al43 reported that TP53 Arg/Arg gene
polymorphism is not a risk factor for colorectal cancer in the Iranian Azari population. This suggests that risks associ-ated with mutation of TP53 are relassoci-ated to ethnicity. In brief,
whether TP53 gene polymorphism or gene mutation has a relationship with age, sex, and pathological type of colorectal cancer is still unknown, and further research is needed.
Conclusions
TP53 is associated with colorectal cancer, but the different value levels of mRNA expression might have no association with survival rate of colorectal cancer. TP53 Pro allele and Pro/Pro genotype were associated with colorectal cancer risk in Asian population. More alteration or mutation research should be designed to confirm these findings in the future.
Acknowledgments
We would like to thank Caroline Maureen Darch (Feinberg School of Medicine, Northwestern University) for her help in reviewing and editing this paper. The authors’ salary was paid by the First Affiliated Hospital of Jinan University.
Disclosure
The authors report no conflicts of interest in this work.
References
1. Donovan MG, Selmin OI, Doetschman TC, Romagnolo DF.
Mediter-ranean diet: prevention of colorectal cancer. Front Nutr. 2017;4:59.
2. Torre LA, Bray F, Siegel RL, et al. Global cancer statistics, 2012. CA
Cancer J Clin. 2015;65(2):87–108.
3. Kim BR, Jeong YA, Na YJ, Ferlay J, Lortet-Tieulent J, Jemal A. Genipin suppresses colorectal cancer cells by inhibiting the Sonic Hedgehog
pathway. Oncotarget. 2017;8(60):101952–101964.
4. Baugh EH, Ke H, Levine AJ, Bonneau RA, Chan CS. Why are there
hotspot mutations in the TP53 gene in human cancers? Cell Death
Differ. 2018;25(1):154–160.
5. Rivlin N, Brosh R, Oren M, Rotter V. Mutations in the p53 tumor sup-pressor gene: important milestones at the various steps of tumorigenesis.
Genes Cancer. 2011;2(4):466–474.
6. Naccarati A, Polakova V, Pardini B, et al. Mutations and polymorphisms
in TP53 gene–an overview on the role in colorectal cancer. Mutagenesis.
2012;27(2):211–218.
7. Zhang J, Yan S, Liu X, et al. Gender-related prognostic value and genomic pattern of intra-tumor heterogeneity in colorectal cancer.
Carcinogenesis. 2017;38(8):837–846.
8. Muller PA, Vousden KH. Mutant p53 in cancer: new functions and
therapeutic opportunities. Cancer Cell.2014;25(3):304–317.
9. Bellini MF, Cadamuro AC, Succi M, Proença MA, Silva AE. Alterations
of the TP53 gene in gastric and esophageal carcinogenesis. J Biomed
Biotechnol. 2012;2012:891961.
10. Olivier M, Hollstein M, Hainaut P. TP53 mutations in human cancers:
origins, consequences, and clinical use. Cold Spring Harb Perspect
Biol. 2010;2(1):a001008.
11. Petitjean A, Achatz MI, Borresen-Dale AL, Hainaut P, Olivier M. TP53 mutations in human cancers: functional selection and impact on cancer
prognosis and outcomes. Oncogene. 2007;26(15):2157–2165.
12. Kawajiri K, Nakachi K, Imai K, Watanabe J, Hayashi S. Germ line polymorphisms of p53 and CYP1A1 genes involved in human lung
cancer. Carcinogenesis. 1993;14(6):1085–1089.
13. Murata M, Tagawa M, Kimura M, Kimura H, Watanabe S, Saisho H. Analysis of a germ line polymorphism of the p53 gene in lung
cancer patients; discrete results with smoking history. Carcinogenesis.
1996;17(2):261–264.
Cancer Management and Research downloaded from https://www.dovepress.com/ by 118.70.13.36 on 20-Aug-2020
Dovepress
Cancer Management and Research
Publish your work in this journal
Submit your manuscript here: https://www.dovepress.com/cancer-management-and-research-journal
Cancer Management and Research is an international, peer-reviewed open access journal focusing on cancer research and the optimal use of preventative and integrated treatment interventions to achieve improved outcomes, enhanced survival and quality of life for the cancer patient. The manuscript management system is completely online and includes
a very quick and fair peer-review system, which is all easy to use. Visit http://www.dovepress.com/testimonials.php to read real quotes from published authors.
Dove
press
TP53 Pro allele and Pro/Pro genotype with colorectal cancer risk
14. Wang NM, Tsai CH, Yeh KT, Chen SJ, Chang JG. P53 codon 72Arg polymorphism is not a risk factor for carcinogenesis in the Chinese.
Int J Mol Med. 1999;4(3):249–252.
15. Hamajima N, Matsuo K, Suzuki T, et al. No associations of p73 G4C14-to-A4T14 at exon 2 and p53 Arg72Pro polymorphisms with the risk of
digestive tract cancers in Japanese. Cancer Lett. 2002;181(1):81–85.
16. Zhu ZZ, Wang AZ, Jia HR, et al. Association of the TP53 codon 72
polymorphism with colorectal cancer in a Chinese population. Jpn J
Clin Oncol. 2007;37(5):385–390.
17. Cao Z, Song JH, Park YK, et al. The p53 codon 72 polymorphism
and susceptibility to colorectal cancer in Korean patients. Neoplasma.
2009;56(2):114–118.
18. Mojtahedi Z, Haghshenas MR, Hosseini SV, Fattahi MJ, Ghaderi A. p 53 codon 72 polymorphism in stomach and colorectal adenocarcinomas
in Iranian patients. Indian J Cancer. 2010;47(1):31–34.
19. Aizat AA, Shahpudin SN, Mustapha MA, et al. Association of Arg72Pro of P53 polymorphism with colorectal cancer susceptibility risk in
Malay-sian population. Asian Pac J Cancer Prev. 2011;12(11):2909–2913.
20. Dastjerdi MN. TP53 codon 72 polymorphism and P53 protein
expression in colorectal cancer specimens in Isfahan. Acta Med Iran.
2011;49(2):71–77.
21. Joshi AM, Budhathoki S, Ohnaka K, et al. TP53 R72P and MDM2 SNP309 polymorphisms and colorectal cancer risk: the Fukuoka
Colorectal Cancer Study. Jpn J Clin Oncol. 2011;41(2):232–238.
22. Song HR, Kweon SS, Kim HN, et al. p53 codon 72 polymorphism in patients with gastric and colorectal cancer in a Korean population.
Gastric Cancer. 2011;14(3):242–248.
23. Zhang Y, Liu L, Tang Y, et al. Polymorphisms in TP53 and MDM2 con-tribute to higher risk of colorectal cancer in Chinese population: a
hos-pital-based, case-control study. Mol Biol Rep. 2012;39(10):9661–9668.
24. Oh J, Kim JW, Lee BE, et al. Polymorphisms of the pri-miR-34b/c promoter and TP53 codon 72 are associated with risk of colorectal
cancer. Oncol Rep. 2014;31(2):995–1002.
25. Singamsetty GK, Malempati S, Bhogadhi S, et al. TP53 alterations and colorectal cancer predisposition in south Indian population: a
case-control study. Tumour Biol. 2014;35(3):2303–2311.
26. Djansugurova L, Zhunussova G, Khussainova E, et al. Association of DCC, MLH1, GSTT1, GSTM1, and TP53 gene polymorphisms with
colorectal cancer in Kazakhstan. Tumour Biol. 2015;36(1):279–289.
27. Zahary MN, Ahmad Aizat AA, Kaur G, Yeh LY, Mazuwin M, Ankathil R. Polymorphisms of cell cycle regulator genes CCND1 G870A and TP53 C215G: association with colorectal cancer susceptibility risk in
a Malaysian population. Oncol Lett. 2015;10(5):3216–3222.
28. Kamiza AB, Hsieh LL, Tang R, et al. TP53 polymorphisms and colorec-tal cancer risk in patients with lynch syndrome in Taiwan: a retrospective
cohort study. PLoS One. 2016;11(12):e0167354.
29. Rivu SF, Apu MNH, Shabnaz S, et al. Association of TP53 codon 72 and CDH1 genetic polymorphisms with colorectal cancer risk in
Bangladeshi population. Cancer Epidemiol. 2017;49:46–52.
30. Gao J, Aksoy BA, Dogrusoz U, et al. Integrative analysis of complex
cancer genomics and clinical profiles using the cBioPortal. Sci Signal.
2013;6(269):pl1.
31. Rhodes DR, Yu J, Shanker K, et al. ONCOMINE: a cancer
micro-array database and integrated data-mining platform. Neoplasia.
2004;6(1):1–6.
32. edited by Julian PTH, Sally G. Cochrane Handbook for Systematic
Reviews of Interventions. Chichester; Hoboken NJ: John Wiley & Sons;2008.
33. Dahabreh IJ, Linardou H, Bouzika P, Varvarigou V, Murray S. TP53 Arg72Pro polymorphism and colorectal cancer risk: a systematic review
and meta-analysis. Cancer Epidemiol Biomarkers Prev. 2010;19(7):
1840–1847.
34. Abderrahmane R, Louhibi L, Moghtit FZ, et al. TP53 Arg 72Pro and MDM2 SNP309 polymorphisms and colorectal cancer risk: a west
Algerian population study. Pathol Oncol Res. 2015;21(3):629–635.
35. Khan MH, Khalil A, Rashid H. Evaluation of the p53 Arg72Pro poly-morphism and its association with cancer risk: a HuGE review and
meta-analysis. Genet Res (Camb). 2015;97:e7.
36. Kandoth C, McLellan MD, Vandin F, et al. Mutational landscape and
significance across 12 major cancer types. Nature. 2013;502(7471):
333–339.
37. Soussi T, Wiman KG. TP53: an oncogene in disguise. Cell Death Differ.
2015;22(8):1239–1249.
38. Donehower LA, Harvey M, Slagle BL, et al. Mice deficient for p53 are developmentally normal but susceptible to spontaneous tumours.
Nature. 1992;356(6366):215–221.
39. Bykov VJN, Eriksson SE, Bianchi J, Wiman KG. Targeting mutant p53
for efficient cancer therapy. Nat Rev Cancer. 2018;18(2):89–102.
40. Loes IM, Immervoll H, Sorbye H, et al. Impact of KRAS, BRAF, PIK3CA, TP53 status and intraindividual mutation heterogeneity on
outcome after liver resection for colorectal cancer metastases. Int J
Cancer. 2016;139(3):647–656.
41. Chen K, Zhang F, Ding J, et al. Histone methyltransferase SETDB1 promotes the progression of colorectal cancer by inhibiting the
expres-sion of TP53. J Cancer. 2017;8(16):3318–3330.
42. Tian X, Dai S, Sun J, Jiang S, Jiang Y. The association between the TP53 Arg72Pro polymorphism and colorectal cancer: an updated
meta-analysis based on 32 studies. Oncotarget. 2017;8(1):1156–1165.
43. Asadi M, Shanehbandi D, Zarintan A, et al. TP53 Gene Pro72Arg (rs1042522) single nucleotide polymorphism as not a risk factor for
colorectal cancer in the Iranian Azari population. Asian Pac J Cancer
Prev. 2017;18(12):3423–3427.
Cancer Management and Research downloaded from https://www.dovepress.com/ by 118.70.13.36 on 20-Aug-2020