1
Modeling Temperature Dependency of Oil-Water Relative Permeability in
Thermal Enhanced Oil Recovery Processes Using Group Method of Data
Handling and Gene Expression Programming
Nait Amar Menad a, Zeraibi Noureddine a, Abdolhossein Hemmati-Sarapardeh b, Shahaboddin
Shamshirband c,d,*, Amir Mosavi e,f, Kwok-wing Chau g
b Laboratoire Génie Physique des Hydrocarbures, Faculty of Hydrocarbons and Chemistry, University M’hamed Bougara of
Boumerdes, Avenue de l’Indépendance, 35000, Boumerdes, Algeria
b Department of Petroleum Engineering, Shahid Bahonar University of Kerman, Kerman, Iran
c Department for Management of Science and Technology Development, Ton Duc Thang University, Ho Chi Minh City, Vietnam
d Faculty of Information Technology, Ton Duc Thang University, Ho Chi Minh City, Vietnam
e Institute of Automation, Kando Kalman Faculty of Electrical Engineering, Obuda University, Budapest-1034, Hungary
f School of the Built Environment, Oxford Brookes University, Oxford OX30BP, UK
g Department of Civil and Environmental Engineering, Hong Kong Polytechnic University, Hong Kong, China
Abstract : In the implementation of thermal enhanced oil recovery (TEOR) techniques, the
temperature impact on relative permeability in oil - water systems is of special concern. Hence,
developing a fast and reliable tool to model the temperature effect on two-phase oil - water
relative permeability is still a major challenge for precise studying and evaluation of TEOR
processes. To reach the goal of this work, two promising soft-computing algorithms, namely
Group Method of Data Handling (GMDH) and Gene Expression Programming (GEP) were
employed to develop reliable, accurate, simple and quick to use paradigms to predict the
temperature dependency of relative permeability in oil - water systems (Krw and Kro). To do so,
a large database encompassing wide-ranging temperatures and fluids/rock parameters,
including oil and water viscosities, absolute permeability and water saturation, was considered
to establish these correlations. Statistical results and graphical analyses disclosed the high
degree of accuracy for the proposed correlations in emulating the experimental results. In
addition, GEP based correlations were found to be the most consistent with root mean square
error (RMSE) values of 0.0284 and 0.0636 for Krw and Kro, respectively. Lastly, the comparison
of the performances of our correlations against those of the preexisting ones indicated the large
superiority of the introduced correlations compared to previously published methods. The
findings of this study can help for better understanding and studying the temperature
dependency of oil - water relative permeability in thermal enhanced oil recovery processes.
2
Keywords – Thermal enhanced oil recovery (TEOR); temperature effect on oil/water relative; group method of data handling (GMDH) and gene expression programming (GEP), machine learning, deep learning
*Corresponding author: Shahaboddin Shamshirband ([email protected] )
1. Introduction
Nowadays, energy demand is expected to rise significantly with the increased prosperity
in different sectors of industry and with the higher and continues consumption (Tillerson and
others 2008). As fossil source is still the dominant spring of energy, there have been noticeable
and significant efforts to promote the standards techniques to improve the outcomes from oil
reservoirs (Olayiwola and Dejam 2019). Due to this fact, extraction of oil from unconventional
reservoirs and oil with low API gravity has turned into quite important ways to compensate the
expected need in the fossil energy (Meyer, Attanasi, and Freeman 2007). The high amount of
heavy oils and bitumen over the worldwide raises awareness on this supplementary source of
fossil energy although the deficiencies in the characteristics of associated oil such as the high
viscosity, low API gravity, and asphaltene content (Saboorian-Jooybari, Dejam, and Chen
2016; Green, Willhite, and others 1998; Prats 1982; Ameli, Alashkar, and Hemmati-Sarapardeh
2018). Therefore, one robust procedure to address such extreme conditions is increasing the
temperature by means of steam or hot water injection, to reduce the viscosity which represents
the resistance to the flow (Prats 1982). These temperature-based techniques for oil recovery are
assembled beneath the umbrella of the so-called Thermal Enhanced Oil Recovery (TEOR).
TOER includes many methods in which the main screening application criterion is based
on the viscosity values. Accordingly, we distinguish steam-assisted gravity drainage (SAGD)
process that is applied for the recovery of bitumen, steam flooding which is effective for the
case of heavy oil extraction and cyclic steam stimulation (CSS) which is appropriate for
extra-heavy oil (Ameli, Alashkar, and Hemmati-Sarapardeh 2018). It is well known that in such
3
mechanisms of heat transfer such as convection, conduction, and radiation can take place. In
fact, the increase in the in-situ reservoir temperature brings significant effects in interaction of
rock-fluid which can impact the behavior of the flow (Akhlaghinia, Torabi, and Chan 2013;
Esmaeili et al. 2019a; Ashrafi, Souraki, and Torsaeter 2012). It is worth mentioning that in
addition to the presence of heat transfer mechanisms, related-multiphase phenomena such as
diffusion and dispersion also make their marks in TOER. As a result, a more complicated
multiphase flow in porous media is noticed when implementing TEOR techniques. The
commonly applied mathematical approach to describe the flow is these cases is the outgrowth
of the Darcy flow equation to multiphase flow (Maini 1998) and thermal-based Darcy flow
(Ameli, Alashkar, and Hemmati-Sarapardeh 2018).
Relative permeability is considered a vital factor that is involved in the mathematical
models describing the multiphase flow in porous media, in which TEOR processes belong (Nait
Amar et al. 2019; Esmaeili et al. 2019b; Maini 1998; Esmaeili et al. 2019a). Relative
permeability which is commonly denoted Kr, is recognized as the ratio of effective permeability
of a fluid at given saturation to the absolute permeability (Ahmed 2018). Relative permeability
data are a must for a large variety of fluid flow calculations related to TEOR. As a matter of
fact, modeling and simulation tasks, which are the means to forecast and predict the
performances that can be achieved under different scenarios of these techniques cannot be done
without the specification of the relative permeability at reservoir conditions. Hence, it is
necessary to have accurate and representative values for this parameter to reduce the risks and
uncertainties in the simulation results. However, it is needed to add that relative permeability
can be affected by various factors and parameters, among which we can cite the absolute
permeability, viscosities of water and oil phases and saturation (Honarpour et al. 2006). In
4
influence the relative permeability curves in TEOR (Sinnokrot 1969; Casse, Ramey Jr 1979;
Ehrlich 1970; Honarpour et al. 2006; Zhang et al. 2017).
The temperature impact on relative permeability values and the shape of their curves
has received considerable attention during last decades (Maini 1998; Zhang et al. 2017; Ashrafi,
Souraki, and Torsaeter 2012; Esmaeili et al. 2019a). Although unanimous agreement is not
satisfied in this topic, a dominant part of experimental and modeling studies that have been
published, have noticed the dependency of relative permeability in oil - water systems (Kro and
Krw) on temperature (Schembre et al. 2005; Weinbrandt et al. 1975; Li et al. 2014; Esmaeili et
al. 2019b; Esmaeili et al. 2019a). The investigation conducted by (Weinbrandt et al. 1975)
confirmed this statement using consolidated Boise sandstone and mineral oil. The studies of
(Schembre et al. 2005) and (Li et al. 2014) demonstrated the effect of temperature on the
two-phase oil-water relative permeability on two distinct cases. In addition, the research performed
by (Ehrlich 1970) based on the adsorption resulted in analytical paradigm for the temperature
dependency of oil-water relative permeability. Besides, some other models based on IFT as
intermediate influencing parameters were developed by (Amaefule and Handy 1982) and
(Kumar et al. 1985). To keep the work concise, a deep overview about different studies
conducted in the literature to inspect the effect of temperature on relative permeability can be
found in our prior published work (Nait Amar et al. 2019) and other relevant publications
(Ashrafi, Souraki, and Torsaeter 2012; Esmaeili et al. 2019b; Akhlaghinia, Torabi, and Chan
2013; Esmaeili et al. 2019a; Zhang et al. 2017).
Experimentally, the two-phase oil - water relative permeability in heavy oil cases can be
measured by means of three possible techniques: low / high rate displacement tests; and the
steady-state co-injection method (Maini 1998). However, the experimental approaches suffer
from sensitive drawbacks such as the complexity of lab preparation and realization, the long
5
years, addressing these issues by establishing cheap and simple-to-use methods to gain the
impact of temperature on Kr has triggered a huge amount of scientific inquiry. Zhang et al.
(Zhang et al. 2017), Mosavat et al. (Mosavat et al. 2016), Torabi et al. (Torabi, Mosavat, and
Zarivnyy 2016), and Bennion et al. (Bennion et al. 2006) are among the well-known predictive
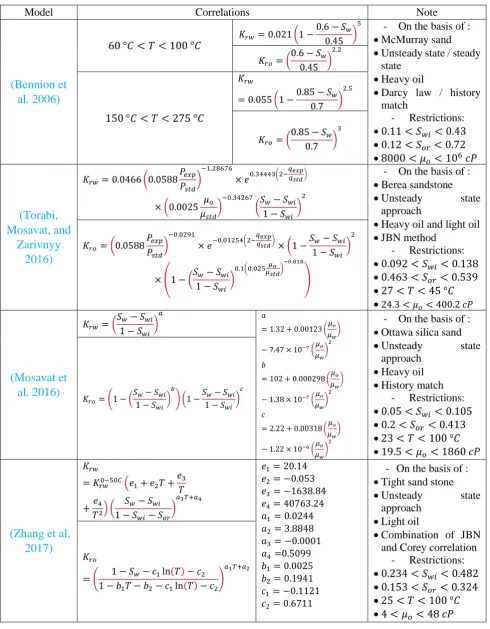
correlations that consider the temperature influence on Kr in oil - water systems. A summary
of the aforementioned correlations is given in Table 1. As it is shown in this table, although the
form straightforwardness of the prior correlations, they suffer from lack of generalization as
their applicability domains are limited to restricted ranges of temperature, rock and fluids
parameters. In addition, it should be added that these preexisting correlations have been
implemented on the basis of limited databank. In the same context, some other correlations have
been established by (Esmaeili et al. 2019c), but these models are not unified with respect to the
types of the rock and fluids, and hence, each of them is applicable for specific case, such as
consolidated or unconsulated sands interacted with light/heavy.
On the other hand, smart computational techniques have emerged and evolved as
powerful and advanced approaches that can resolve highly complex related-modeling topics
(Hobold and da Silva 2019; Xi et al. 2018; Shahsavar et al. 2019; Amirian, Dejam, and Chen
2018; Hemmati-Sarapardeh et al. 2018; Hemmati-Sarapardeh et al. 2016; Nait Amar, Zeraibi,
and Redouane 2018a; Nait Amar, Zeraibi, and Redouane 2018b; Nait Amar and Zeraibi 2018;
Redouane, Zeraibi, and Nait Amar 2018). Among the successful examples of soft computing
techniques applications, we can cite production forcasting in thermal enhanced oil recovery
(Amirian et al. 2015; Amirian et al. 2018), optimization of enhanced oil recovery techniques
(Nait Amar & Zeraibi 2019), reservoir flood control (Chuntian and Chau 2002), hydrology
(Chau 2017; Wu and Chau 2011; Yaseen et al. 2019), and meteorology related topics (Ghorbani
et al. 2018; Moazenzadeh et al. 2018). More recently, Esmaeili et al. (Esmaeili et al. 2019b)
6
relative permeability on temperature. (Nait Amar et al. 2019) proposed various intelligent
paradigms as kinds of trustworthy models to estimate oil - water relative permeability in TEOR
by combining radial basis function (RBF) neural network and LSSVM with some
nature-inspired algorithms. The developed models in the two aforementioned studies showed very
satisfactory predictions. The present investigation was done with the aim of implementing
explicit, user-friendly and accurate correlations using group method of data handling (GMDH)
and gene expression programming (GEP) for predicting the dependency of Kr in the two - phase
oil - water systems on temperature, so that it could be applicable to a wider range of temperature,
and fluids and rock proprieties.
In the present work, group method of data handling (GMDH) and gene expression
programming (GEP) are applied to establish reliable correlations for estimating
temperature-based oil - water relative permeability through defining five input parameters; namely the
saturation of water (𝑆𝑤), absolute permeability (K), temperature (T), oil and water viscosities
(𝜇𝑜 and 𝜇𝑤). To this end, a comprehensive data source of 1223 points gathered from valid
available literature and covering an extensive range of rock and fluids parameters and
temperature, is utilized to establish the correlations. After developing GEP and GMDH models,
they are assessed by means of several statistical criteria and graphical error analyses. Lastly, to
testify the reliability of the proposed correlations, these ones are compared with pre-existing
correlations that model the dependency of oil - water relative permeability on temperature.
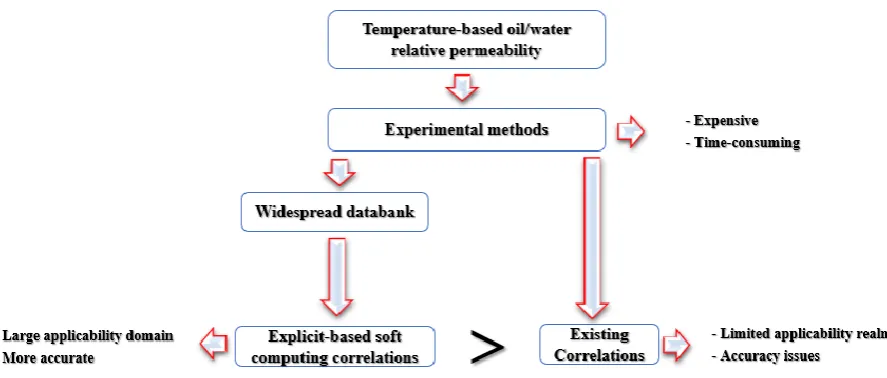
There are some important differences between the present study and the previously performed
studies in literature: (1) the established paradigms in this study have widespread applicability
ranges, and besides, (2) different user-friendly explicit expressions for modeling temperature
dependency of Kro and Krw in thermal enhanced oil recovery processes are developed. Fig. 1
7
The next sections of the paper are ordered as follows. Section 2 highlights a detailed
description of the databank employed to establish the correlations. Section 3 describes the
GMDH and GEP concepts. Results are described and discussed in Section 4. Finally, Section 5
points out the main outcoming results.
2. Data description
To develop reliable correlations that can ensure the generalization and accuracy, a
comprehensive and a large databank with widespread conditions must be considered. Due to
this fact, in this study, 1223 experimental data points were collected from published literature
(Poston et al. 1970; Maini and Okazawa 1987; Ashrafi, Souraki, and Torsaeter 2012; Ashrafi,
Souraki, and Torsaeter 2014; Torabi, Mosavat, and Zarivnyy 2016; Weinbrandt et al. 1975; Lo
and Mungan 1973; Ali A Sinnokrot et al. 1971; Akhlaghinia, Torabi, and Chan 2013). The
collected data cove a wide range of temperature and fluid/rock conditions. Among the 1223
points, 648 points describe the oil relative permeability (𝐾𝑟𝑜) cases, while the remaining 575
correspond to the relative permeability of water (𝐾𝑟𝑤). The considered inputs to develop the
correlations are the following: temperature (T), water saturation (Sw), water viscosity (𝜇𝑤), oil
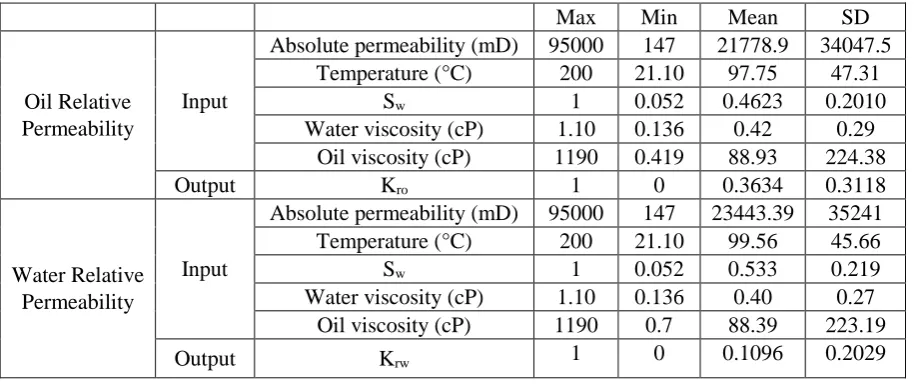
viscosity (𝜇𝑜) and the absolute permeability (K). Table 2 reports a full description of the
employed databank in this study. It should be mentioned that these data have already been used
in our previous paper (Nait Amar et al. 2019).
To establish the correlations using GEP and GMDH, the database was divided randomly
into training data covering 80% of the whole databank, and testing data including the remaining
20%. The training data were used to investigate for the best correlations, while the testing data
were exploited to evaluate the behavior of the correlations with blind data.
3. Models
8
Group Method of Data Handling (GMDH) known also as polynomial neural network is
one of the most promising families of artificial neural networks (ANNs) (Dargahi-Zarandi et
al. 2017). Beside the reliability shown by GMDH in modeling complex systems, it ensures the
advantage of providing user-friendly polynomial formula to the system being studied. The
conception of GMDH technique consists in employing multiple nodes which belong to
intermediate layers. The generated value by each GMDH node is calculated based on a
quadratic polynomial model that includes the previous neuron. This GMDH version
corresponds to the earliest model that was introduced by Ivakhnenko (A.G. Ivakhnenko, G.I.
Krotov 1970). As the earliest version of GMDH presented some generalization lacks, a
modified version, known also as hybrid version, was proposed as an extensive version that
includes more interactions between the nodes and variables; hence, this version ensures more
flexibility for modeling more complex systems (Rostami et al. 2019). The GMDH hybrid
version follows the below-shown rule:
𝑦𝑖 = 𝑎 +∑𝑑𝑖=1∑𝑑𝑗=1…∑𝑑𝑘=1𝑐𝑖𝑗…𝑘𝑥𝑖𝑛𝑥𝑗𝑛… 𝑥𝑘𝑛 𝑛 = 1,2, … , 2𝑚 (1)
where 𝑦𝑖, 𝑥𝑖𝑗…𝑘 stand for the inputs and output parameters of the model, respectively; 𝑐𝑖𝑗…𝑘
denote the polynomial coefficients; 𝑚 and 𝑑 mean respectively, the size of layers and the input
parameters number.
Afterwards, the full-form mathematical formulation can be done by partial polynomials
with predefined orders to combine between the nodes in previous layers; hence, new nodal
variables (i.e. O1, O2, …) are created. For the case of two neurons related with a quadratic
polynomial model, the following equation is applied:
𝑂𝑖𝐺𝑀𝐷𝐻 = 𝑎0+ 𝑎1𝑥𝑖 + 𝑎2𝑥𝑗+ 𝑎3𝑥𝑖𝑥𝑗+ 𝑎4𝑥𝑖2+ 𝑎5𝑥𝑗2 (2)
To adjust the coefficients of the above-shown equation, the least square method (LSM)
9
𝛿𝑗2 =∑𝑁𝑡𝑖=1(𝑦𝑖 − 𝑂𝑖𝐺𝑀𝐷𝐻)2 𝑗 = 1,2, … ,(𝑑
2) (3)
In which 𝑑 is the variables number and Nt is the size of the training set.
To solve this problem, this latter if transformed to a matrix form as (Dargahi-Zarandi et al.
2017; Hemmati-Sarapardeh and Mohagheghian 2017):
𝑦 = 𝐴𝑇𝑋 (4)
The LSM generates the solution of Eq. (4) as follows:
𝐴𝑇 = 𝑦𝑋𝑇(𝑋𝑋𝑇)−1 (5)
where 𝑦 ={𝑦1, 𝑦2, … , 𝑦𝑑} 𝑎𝑛𝑑 𝐴 = {𝑎0, 𝑎1, 𝑎2, 𝑎3, 𝑎4, 𝑎5}, in which d points out the
number for variables.
3.2.Gene expression programming (GEP)
Gene expression programming (GEP) is an advanced soft computing method which was
introduced by Ferreira (Ferreira 2001). This technique is a part of the family of evolutionary
algorithms (EAs) and it applies the evolutionary principles. GEP provides the advantage of
generating explicit mathematical expression to the studied systems. From the conception
standing point of view, GEP is regarded an improved version of Genetic Programming (GP)
introduced by Koza (Koza 1992), as GEP handled the GP issues, such as the limited regression
strategies (Ferreira 2001).
As the other evolutionary algorithm, GEP processes the searching for best expression
model by employing chromosomes that codify and reflect possible solutions. In addition,
another key element which is the Expression Tree (ET) is introduced in GEP. ET is obtained
by transforming the chromosomes into real candidates. GEP employs genes that involve
terminals and a head containing functions. Each gene has a fixed length list of symbols which
10
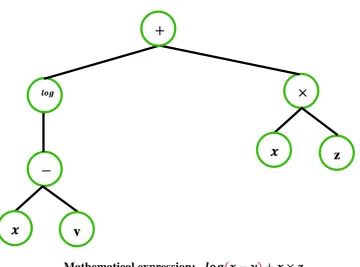
{𝑥, 𝑦, 𝑧}(Teodorescu and Sherwood 2008). Fig. 2 shows a chromosome having two genes and
its mathematical formula.
The GEP searching procedure is summarized in the following steps:
(1) GEP setting parameters: it consists to define the needed key parameters such as the
size of the population, the stopping criteria, and the length of genes.
(2) Population initialization: create randomly initial chromosomes (different possible
mathematical expression).
(3) Evaluate the chromosomes using a fitness function.
(4) Select the fittest individuals and save them for the next generation.
(5) Apply tournament selection to choose the individuals that will be recombined to
generate new offspring. One point and two points recombination are available in
GEP.
(6) Mutation operator: mutation plays a principal role in GEP. It changes genomes by
modifying an element by another.
(7) Transposition and insertion of sequences somewhere in a chromosome: it consists to
activate and jump parts of the genome in the chromosome (Ferreira 2001).
The steps from (3) to (7) are reiterated while the stopping criterion is not satisfied.
4. Results and discussion
4.1.Developing the correlations
As previously mentioned, after preparing the databank and specifying the training and
testing sets for both cases Kro and Krw, the two rigorous techniques namely GEP and GMDH
were applied to establish correlations for these two parameters with the following inputs: the
11
(𝜇𝑜 and 𝜇𝑤). Therefore, the temperature dependency of oil - water relative permeability
correlations are developed with respect to the aforementioned inputs as follows:
𝐾𝑟𝑜 = 𝑓(𝑆𝑤, 𝑇, 𝜇𝑜, 𝜇𝑤, 𝐾) (6)
𝐾𝑟𝑤 = 𝑓(𝑆𝑤, 𝑇, 𝜇𝑜, 𝜇𝑤, 𝐾) (7)
In both approaches, mean square error (MSE) was defined as the error function to be
minimized during the search process for the best correlations. MSE is defined as follows:
𝑀𝑆𝐸 =∑ (𝐾𝑟𝑖𝑒𝑥𝑝−𝐾𝑟𝑖𝑝𝑟𝑒) 2 𝑁
1
𝑁 (8)
in which Kr means the oil or water relative permeability, N is the number of points and the
subscript pre and exp mean the predicted and experimental values, correspondingly.
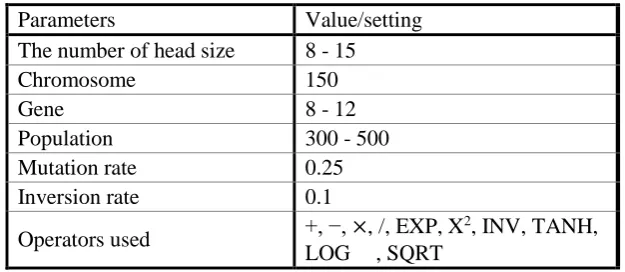
When implementing GEP technique, its control parameters such as the population size,
mutation probability, the included operators, etc. should be tuned to improve the accuracy of
the generated correlations. The considered GEP setting parameters in this study are stated in
Table 3.
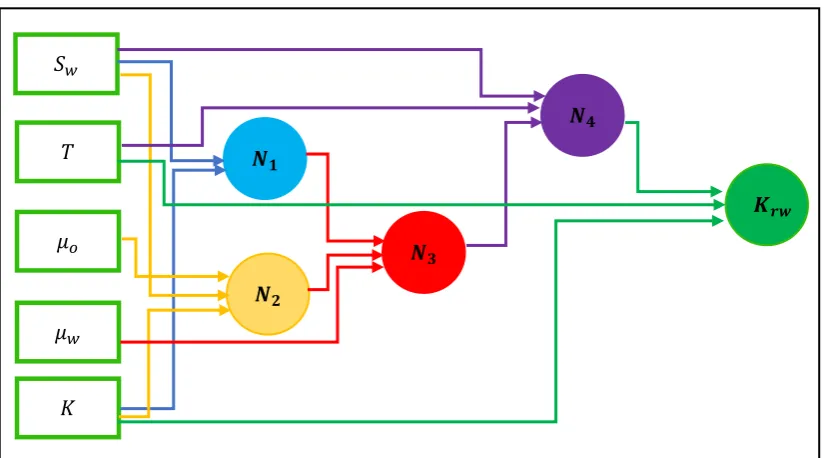
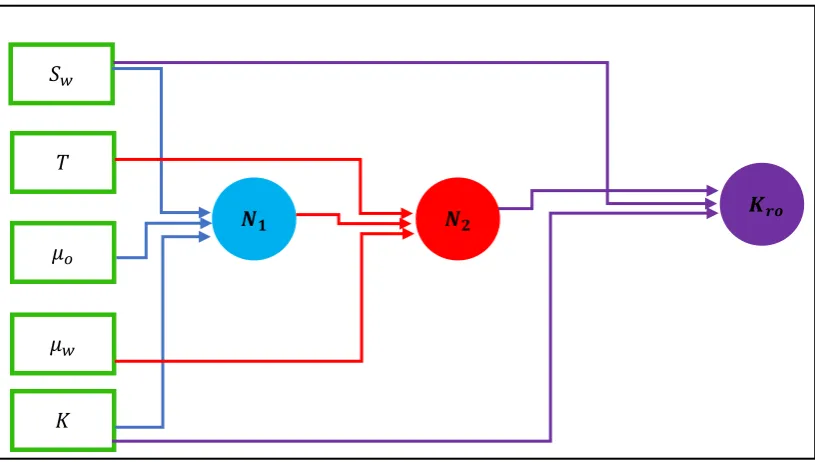
A summarized schematic of the Krw and Kro correlations obtained with GMDH are
presented in Figs. 3 and 4, correspondingly. As it is shown in these figures, the Krw network
encompasses one input layer, one output layer and three intermediate layers; while for the case
of Kro, one input layer, one output layer and two intermediate layers were obtained. The resulted
GMDH correlations are expressed as follows:
• Krw
𝐾𝑟𝑤 = 0.023971 + 0.790913 × 𝑁4 − 4.492498 × 10⁻⁷× 𝐾 − 0.00104 × 𝑇 − 3.950588 × 10⁻⁶×
𝐾 × 𝑁4 − 0.000433 × 𝑇 × 𝑁4 + 4.465764 × 10⁻⁹× 𝑇 × 𝐾 + 0.610576 × 𝑁42 + 2.816213 × 10⁻¹¹×
𝐾2 + 1.4329 × 10⁻⁵× 𝑇2 + 5.142623 × 10⁻⁹× 𝑇 × 𝐾 × 𝑁
4 + 0.00068 × 𝐾 × 𝑁42 − 2.7281999 ×
10−10× 𝐾2× 𝑁
4 + 0.002079 × 𝑇 × 𝑁42+ 2.737294 × 10⁻¹³× 𝑇 × 𝐾2 − 8.539067 × 10⁻⁶× 𝑇2× 𝑁4 −
1.877768 × 10⁻¹⁰× 𝑇2× 𝐾 − 0.58709 × 𝑁
43 − 3.568052 × 10⁻¹⁶× 𝐾3− 4.849053 × 10⁻⁸× 𝑇3 (9)
12
𝐾𝑟𝑜= 0.728253 − 0.072037 × 𝑁2 + 3.82443 × 10⁻⁵× 𝐾 − 3.4903857 × 𝑆𝑤− 1.549463 × 10⁻⁵×
𝐾 × 𝑁2 + 0.100212 × 𝑆𝑤× 𝑁2− 1.124351 × 10⁻⁵× 𝑆𝑤× 𝐾 + 0.934668 × 𝑁22 − 9.736863 × 10⁻¹⁰×
𝐾2 + 5.4835969 × 𝑆
𝑤2 − 3.342406 × 10⁻⁵× 𝑆𝑤× 𝑁2 − 1.073647 × 10⁻⁵× 𝐾 × 𝑁22 + 4.3652039 ×
10−10× 𝐾2× 𝑁2 + 2.154452 × 𝑆𝑤× 𝑁22 + 6.461956 × 10⁻¹⁰× 𝑆𝑤× 𝐾2 + 0.8212563 × 𝑆𝑤2× 𝑁2 −
3.8461259 × 10⁻⁵× 𝑆
𝑤2 × 𝐾 − 0.662322 × 𝑁23 + 4.315276 × 10⁻¹⁵× 𝐾3− 2.820277 × 𝑆𝑤3 (10) The resulted GMDH nodes and genomes included in the above-obtained correlations are
reported in Appendix A.
The obtained correlations by GEP are expressed as follows:
• Krw
𝐾𝑟𝑤 = −(0.02353 × 𝑆𝑤+ 0.1717 × 𝑆𝑤2) × 𝐾0.5× exp(−𝜇𝑜)− 0.0007187 + 𝐴 + 𝐵 + 𝐶 + 𝐷 (11)
where A, B, C and D are defined as shown-below:
𝐴 = 30.40×𝑆𝑤6
exp(−𝜇𝑜)+ln(𝐾)−1−
60.6×𝑆𝑤6
1.759×(𝑆𝑤2+ln(𝐾))−0.955 (12)
𝐵 = − 3.713×𝑆𝑤4
1.126×(𝑆𝑤2+𝜇 𝑤
2)−8.898−
7.349×𝑆𝑤4
45.04×(𝜇𝑜+tanh(𝜇𝑜))−362.7 (13)
C = −2.123×10⁻⁵×𝑆𝑤2×𝑇2
2×𝜇𝑜+ln(𝐾)−17.43 −
1.011×10⁻³×𝑆 𝑤4×𝜇𝑜2
4.612×(𝜇𝑜+𝜇𝑤)+73.63 (14)
𝐷 = −29.92×𝑆𝑤×exp(−𝑆𝑇𝑤2)×√exp(−𝜇𝑜) (15)
• Kro
− For 21.10 < 𝑇 ≤ 100 °𝐶
𝐾𝑟𝑜= 0.05447(
𝑆𝑤×𝑇×𝜇𝑜
𝐾 ) (0.12071 × 𝑇 − 1)+ 0.04403(√ 𝐾 𝜇𝑤) (
0.2376
√𝜇𝑤 − 1)+ 𝜇𝑜(0.00619 +
17.9
𝑇−𝐾)+
𝐴1× 𝑆𝑤− 𝐴2×(𝑆𝑤× 𝑇 × 𝜇𝑤)− 𝐴3×( 𝜇𝑤
𝑇)+ 𝐴4×(
𝐾
𝑆𝑤)− 𝐴5+ 𝐴6 (16)
− For 100 < 𝑇 ≤ 200 °𝐶
𝐾𝑟𝑜= 0.7083 × 𝑆𝑤2 ×(0.003467 × 𝑇 ×√𝜇𝑜− 𝑆𝑤4)+ 10−6×[7834 × 𝜇𝑤3 − 5.963 ×(𝑇2+√𝜇𝑜)+
𝐴1×(𝑆𝑤× 𝐾)+ 𝐴2( 𝐾
𝑇)− 𝐴3(
𝐾
𝜇𝑤)+ 𝐴4× 𝜇𝑜
3 2− 𝐴5
13
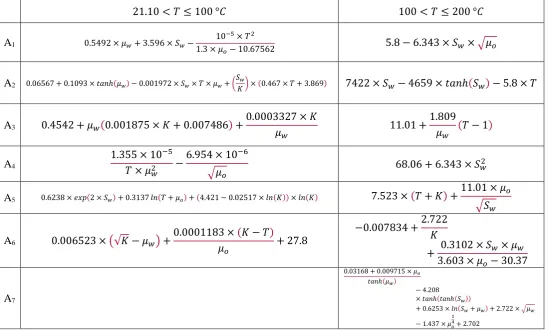
The expressions of the terms appearing in the obtained GEP correlation for Kro are
specified in Table 4.
4.2.Performances evaluation
Graphical error analyses and statistical criteria and were employed to assess the accuracy
of the developed correlations and chose the best representative ones in forecasting the
temperature - based Kro and Krw.
The root mean square error (RMSE) and coefficient of determination (R2) and are the
statistical indexes that were used in this study. These two statistical criteria are defined in
Appendix B.
To fine-tune the above-mentioned criteria, broaden the assessment of the established
correlations and give visual comparisons, graphical evaluation diagrams such as cross plots,
and histograms of error distribution were considered. In the cross plots, the predicted values
by the correlations are plotted versus the counterpart experimental values. Existence of large
amount of points nearby the line Y=X indicated the high accuracy of the model and the excellent
degree of correspondence between predictions and real data. In the histograms of error, the
distribution of errors is plotted in a bar form and if a normal distribution is noticed nearby zero
value, the model is deemed very satisfactory.
Figs. 5 and 6 display cross plots comparing between experimental data and predictions of
GEP and GMDH correlations for Kro and Krw, respectively. As it can be obviously seen from
these figures, GMDH predictions show large sparse for both Kro and Krw, whereas the
predictions of GEP are accumulated nearly enough around the unit slope line. According to this
visual survey, it can be said that the GEP correlations are more awe-inspiring as sublime
accommodations between their predictions and experimental results are noticed. To excavate
14
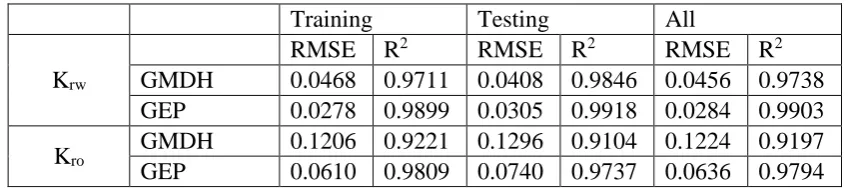
5 and bar plots of Fig. 7 report statistical and graphical error analyses through the considered
assessment criteria, namely RMSE and R2, for the established correlations. With accordance to
the demonstrated results in Table 5 and Fig. 7, it can be concluded that GEP correlations
estimate better Krw and Kro compared to GMDH correlations. The temperature-based oil - water
relative permeability correlations established using GEP exhibit overall RMSE values of 0.0284
and 0.0636 for Krw and Krw, respectively, and correlation coefficients that exceed 0.97 for the
both cases. Therefore, the developed GEP correlations were considered for further investigation
in the rest of paper.
To depict effectiveness and reliability of the GEP correlations regarded to the generated
results, the comparison between predicted relative permeability from the implemented
correlations and their counterpart real values versus corresponding indexes of data samples
were demonstrated in Fig. 8 for Kro and in Fig. 9 for Krw. As these figures illustrate, the gained
results from the GEP correlations are as close as possible to actual values of Krw and Kro
during the training and testing phases.
For a better understanding of the GEP correlations integrity in estimating the temperature
- based Kro and Krw, Figs. 10 and 11 demonstrate histograms of errors between the actual and
estimated values for Kro and Krw, respectively. These figures include error histograms for
training and testing phases in the two cases, Kro and Krw. Based on the reported results in these
histograms, we can observe that the most frequent error values are nearby zero. In addition, it
can be said that the error distributions follow the normal curve in all the subplots. The error
distributions reported in Figs. 10 and 11 confirm the high ability of the established correlations
in predicting the temperature - based Kro and Krw.
4.3.Comparison of developed GEP correlations with literature models
In the present study, the accuracy of the developed GEP correlations was compared to
15
and Krw. These latter include Bennion et al. (Bennion et al. 2006), Zhang et al. (Zhang et al.
2017), and Mosavat et al. (Mosavat et al. 2016). It should be mentioned that while applying the
preexisting correlations to the employed data in this study, only the points that fall within the
application ranges were included according to each correlation. To this end, the estimated
values using the previously mentioned correlations versus the experimental data are plotted in
Fig. 12 for Kro and in Fig. 13 for Krw. Figs. 12 and 13 demonstrate that large scatters in the
Kro and Krw data around the unit slop line were generated by Bennion et al. (Bennion et al.
2006) and Mosavat et al. (Mosavat et al. 2016) correlations, while acceptable accumulation
around the X=Y line was noticed in the case of estimating Krw with the Zhang et al. (Zhang et
al. 2017) correlation. This obviously indicates that Bennion et al. (Bennion et al. 2006) and
Mosavat et al. (Mosavat et al. 2016), correlations fail in forecasting the correct values of both
Kro and Krw, whereas Zhang et al. (Zhang et al. 2017) fails particularly in predicting Kro.
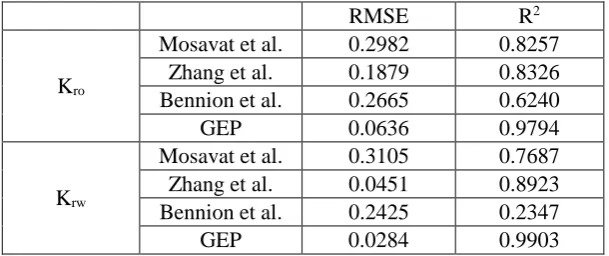
Table 6 and Fig. 14 summarize the performances of the correlations considered in this
work along with those of GEP correlations. The comparison results show that the developed
GEP correlations lead to the best performances in predicting both Kro and Krw. According to
Table 6 and Fig. 14, it is concluded that the developed GEP correlations outperforms largely
the preexisting temperature-based oil/water correlations.
4.4.Validity of the developed GEP correlations in term of water saturation (𝑺𝒘)
To testify the efficiency of the established GEP correlations in predicting the curves of
temperature - based Kro and Krw as function of Sw, Fig. 15 illustrates the generated Kro and
Krw curves via GEP correlations, and compare with corresponding experimental values from
two different samples included in this study. As the subplots (a) and (b) of Fig. 15 depict, a very
satisfactory integrity is shown by the GEP correlations to estimate the temperature-based Kro
16
The prediction capability of the proposed GEP correlations has once again been certified in Fig.
15.
Finaly, it should be mentioned that the proposed correlation for modeling the temperature
dependency of Kro and Krw should be utilized when the data falls within the applicability
realm, otherwise its exactness is not ensured as precise results for certain conditions can be
generated, and imprecise results for some others. However, as previously stated, these
correlations were gained by including widespread databank, and hence, it can be applied for
several cases which have input parameters filling in the applicability realm.
5. Conclusions
In this study, new explicit, simple-to-use and accurate correlations were proposed to
model the dependency of relative permeability in oil – water systems on temperature. Group
method of data handling (GMDH) and gene expression programming (GEP) were implemented
as promising tools to implement the correlations using a large comprehensive databank. Several
assessment criteria were considered to figure out integrity and performance of the new
correlations. The main conclusions of the study are summarized as follows:
1. GEP-based correlations were found as the most reliable correlations to predict the
temperature dependency of Kr in oil - water relative systems.
2. The newly implemented GEP correlations for predicting the temperature-based Kro
and Krw exhibited very satisfactory performances with overall RMSE values of
0.0284 and 0.0636 for Krw and Kro, respectively.
3. The developed GEP correlations were compared with other well-known preexisting
17
et al. 2006) and Mosavat et al. (Mosavat et al. 2016). The integrity of the proposed
correlations was testified and found to be substantially superior to all of these models.
4. By performing a trend analysis of the developed GEP correlations in term of water
saturation, the gained curves for both Kro and Krw followed the expected forms and
logical variations in term of water saturation.
5. The established correlations in this study can be applied under a wide variety of
conditions and also can be improved in presence of new additional data.
Nomenclature
Acronyms
ANNs artificial neural networks CSS cyclic steam stimulation GEP gene expression programming GMDH group method of data handling IFT interfacial tension
LSSVM least square support vector machine MSE mean square error
RBFNN radial basis function neural network RMSE Root mean squared error
R2 coefficient of determination
SAGD steam-assisted gravity drainage TEOR thermal enhanced oil recovery
Variables
K absolute permeability 𝐾𝑟𝑜oil relative permeability 𝐾𝑟𝑤 water relative permeability Sw water saturation
T temperature 𝜇𝑤water viscosity 𝜇𝑜 oil viscosity
Subscripts
18
Appendix A.
Obtained GMDH nodes and genomes for Kro and KrwThe resulted GMDH nodes and genomes are expressed as follows:
• Krw
𝑁4= −0.102767 − 1.983942 × 𝑁3 + 0.005098 × 𝑇 − 0.141932 × 𝑆𝑤+ 0.01020 × 𝑇 × 𝑁3 +
6.158718 × 𝑆𝑤× 𝑁3 − 0.006264 × 𝑆𝑤× 𝑇 + 3.078813 × 𝑁32 − 4.478272 × 10⁻⁵× 𝑇2 + 0.931513 ×
𝑆𝑤2 − 0.010119 × 𝑆𝑤× 𝑇 × 𝑁3+ 0.0011847 × 𝑇 × 𝑁32 − 1.530084 × 10⁻⁵× 𝑇2× 𝑁3 + 0.031735 × 𝑆𝑤×
𝑁32 + 2.267592 × 10⁻⁵× 𝑆𝑤× 𝑇2 − 4.639188 × 𝑆𝑤2× 𝑁3 + 0.003083 × 𝑆𝑤2 × 𝑇 − 1.635732 × 𝑁33+
1.164436 × 10⁻⁵× 𝑇3 − 0.7844912 × 𝑆 𝑤3
𝑁3 = 0.176662 − 1.940022 × 𝑁2+ 1.3582468 × 𝑁1 − 0.9801913 × 𝜇𝑤 + 183.489858 × 𝑁1× 𝑁2 +
0.500095 × 𝑁2× 𝜇𝑤 + 4.220132 × 𝜇𝑤× 𝑁1− 42.4369441 × 𝑁22 − 141.8141161 × 𝑁12 + 1.637756 ×
𝜇𝑤2 − 235.2853497 × 𝜇𝑤× 𝑁1× 𝑁2− 635.636686 × 𝑁1× 𝑁22 + 545.98779 × 𝑁12× 𝑁2 + 79.564658 ×
𝜇𝑤× 𝑁22 + 153.550115 × 𝜇𝑤× 𝑁12 + 2.097266 × 𝜇𝑤2 × 𝑁2 − 4.2657881 × 𝜇𝑤2 × 𝑁1 + 225.747117 ×
𝑁23− 134.334663 × 𝑁13− 0.891422 × 𝜇𝑤3
𝑁2= −0.096002 − 5.9257567 × 10⁻⁶× 𝐾 − 0.000564 × 𝜇𝑜 + 1.130989 × 𝑆𝑤 + 3.481102 × 10⁻⁹×
𝜇𝑜× 𝐾 − 3.823397 × 10⁻⁶× 𝑆𝑤× 𝐾 − 3.6069041 × 10⁻⁶× 𝑆𝑤× 𝜇𝑜 + 2.674233 × 10⁻¹⁰× 𝐾2 +
1.561068 × 10⁻⁶× 𝜇
𝑜2 − 2.949632 × 𝑆𝑤2 + 1.131077 × 10⁻⁹× 𝜇𝑜× 𝐾 × 𝑆𝑤 − 4.770877 × 10⁻¹⁴× 𝜇𝑜×
𝐾2+ 2.038109 × 10⁻¹¹× 𝜇
𝑜2× 𝐾 + 1.599609 × 10⁻¹⁰× 𝑆𝑤× 𝐾2 − 3.171396 × 10⁻⁷× 𝑆𝑤× 𝜇𝑜2 −
1.538897 × 10⁻⁵× 𝑆
𝑤2× 𝐾 + 0.000121 × 𝑆𝑤2× 𝜇𝑜 − 2.397819 × 10⁻¹⁵× 𝐾3 − 9.193278 × 10⁻¹⁰×
𝜇𝑜3 + 2.792131 × 𝑆𝑤3
𝑁1 = −0.086648 − 6.263036 × 10⁻⁶× 𝐾 + 0.943031 × 𝑆𝑤 − 2.686239 × 10⁻⁶× 𝑆𝑤× 𝐾 + 2.763862 ×
10−10× 𝐾2− 2.593159 × 𝑆𝑤2 + 1.533535 × 10⁻¹⁰× 𝑆𝑤× 𝐾2 − 1.5880239 × 10⁻⁵× 𝑆𝑤2 × 𝐾 −
2.461926 × 10⁻¹⁵× 𝐾3+ 2.596955 × 𝑆 𝑤3
19
𝑁2 = −10.615467 + 3.079713 × 𝑁1 + 37.847865 × 𝜇𝑤 + 0.123872 × 𝑇 − 10.501635 × 𝜇𝑤× 𝑁1 −
0.038680 × 𝑇 × 𝑁1 − 0.266058 × 𝑇 × 𝜇𝑤 + 4.219898 × 𝑁12− 41.718917 × 𝜇𝑤2 − 0.000483 × 𝑇2 +
0.067595 × 𝑇 × 𝜇𝑤× 𝑁1 − 1.5338197 × 𝜇𝑤× 𝑁12 + 7.0341954 × 𝜇𝑤2 × 𝑁1 − 0.0146348 × 𝑇 × 𝑁12 +
0.0940588 × 𝑇 × 𝜇𝑤2 + 0.000135 × 𝑇2× 𝑁1+ 0.000562 × 𝑇2× 𝜇𝑤 − 1.465284 × 𝑁13 + 15.521063 ×
𝜇𝑤3 + 5.4498556 × 10⁻⁷× 𝑇3
𝑁1= 1.000296 − 9.2675342 × 10⁻⁶× 𝐾 − 0.000537 × 𝜇𝑂 + 0.091314 × 𝑆𝑤− 7.968958 × 10⁻⁸× 𝜇𝑂×
𝐾 − 1.500484 × 10⁻⁵× 𝑆
𝑤× 𝐾 − 0.001163 × 𝑆𝑤 + 1.466523 × 10⁻¹⁰× 𝐾2 − 9.665598 × 10⁻⁷× 𝜇𝑂2−
3.759212 × 𝑆𝑤2 − 3.849348 × 10⁻⁸× 𝑆𝑤× 𝜇𝑂× 𝐾 + 1.066838 × 10⁻¹²× 𝜇𝑂× 𝐾2 + 1.416735 × 10⁻¹⁰×
𝜇𝑂2× 𝐾 − 4.666963 × 10⁻¹¹× 𝑆𝑤× 𝐾2 + 8.735882 × 10⁻⁹× 𝑆𝑤× 𝜇𝑂2 + 2.5344757 × 10⁻⁵× 𝑆𝑤2× 𝐾 +
0.001674 × 𝑆𝑤2× 𝜇𝑂 − 5.754639 × 10⁻¹⁶× 𝐾3 + 9.856402 × 10⁻¹⁰× 𝜇𝑂3 + 2.665978 × 𝑆𝑤3
Appendix B.
Statistical criteriaThese two assessment criteria are defined as follows:
𝑅2 = 1 −∑ (𝐾𝑟𝑖𝑝𝑟𝑒𝑑−𝐾𝑟𝑖𝑒𝑥𝑝) 2 𝑁
𝑖=1
∑𝑁 (𝐾𝑟𝑖𝑝𝑟𝑒𝑑−𝐾𝑟̅̅̅̅)2
𝑖=1
𝑅𝑀𝑆𝐸 = √1
𝑁∑ (𝐾𝑟𝑖𝑒𝑥𝑝− 𝐾𝑟𝑖𝑝𝑟𝑒𝑑) 2 𝑁
𝑖=1
In these equations, N corresponds to the number of data, 𝐾𝑟𝑖 and 𝐾𝑟̅̅̅̅ are the phase (oil / water)
relative permeability and their corresponding averages, correspondingly; and the subscripts
pred and exp mean the predicted and experimental values, correspondingly.
References
20
Case Studies.”
Ahmed, Tarek. 2018. Reservoir Engineering Handbook. Gulf Professional Publishing.
Akhlaghinia, Manoochehr, Farshid Torabi, and Christine W Chan. 2013. “Effect of Temperature on Two-Phase Relative Permeabilities of Heavy Oil, Water, Carbon Dioxide, and Methane Determined by Displacement Technique.” Energy & Fuels 27 (3). ACS Publications: 1185– 1193.
Ali Ghorbani, Mohammad, Reza Kazempour, Kwok-Wing Chau, Shahaboddin Shamshirband, and Pezhman Taherei Ghazvinei. 2018. “Forecasting Pan Evaporation with an Integrated Artificial Neural Network Quantum-Behaved Particle Swarm Optimization Model: A Case Study in Talesh, Northern Iran.” Engineering Applications of Computational Fluid Mechanics 12 (1). Taylor & Francis: 724–737.
Amaefule, Jude O, Lyman L Handy, and others. 1982. “The Effect of Interfacial Tensions on Relative Oil/Water Permeabilities of Consolidated Porous Media.” Society of Petroleum Engineers
Journal 22 (03). Society of Petroleum Engineers: 371–381.
Ameli, Forough, Ali Alashkar, and Abdolhossein Hemmati-Sarapardeh. 2018. “Thermal Recovery Processes.”
Amirian, Ehsan, Morteza Dejam, and Zhangxin Chen. 2018. “Performance Forecasting for Polymer Flooding in Heavy Oil Reservoirs.” Fuel 216. Elsevier: 83–100.
Amirian, Ehsan, Eugene Fedutenko, Chaodong Yang, Zhangxin Chen, and Long Nghiem. 2018. “Artificial Neural Network Modeling and Forecasting of Oil Reservoir Performance.” In
Applications of Data Management and Analysis, 43–67. Springer.
Amirian, Ehsan, Juliana Y Leung, Stefan Zanon, and Peter Dzurman. 2015. “Integrated Cluster Analysis and Artificial Neural Network Modeling for Steam-Assisted Gravity Drainage
Performance Prediction in Heterogeneous Reservoirs.” Expert Systems with Applications 42 (2). Elsevier: 723–740.
Ashrafi, Mohammad, Yaser Souraki, and Ole Torsaeter. 2012. “Effect of Temperature on Athabasca Type Heavy Oil--Water Relative Permeability Curves in Glass Bead Packs.” Energy and
Environment Research 2 (2): 113.
Ashrafi, Mohammad, Yaser Souraki, and Ole Torsaeter. 2014. “Investigating the Temperature Dependency of Oil and Water Relative Permeabilities for Heavy Oil Systems.” Transport in
Porous Media 105 (3). Springer: 517–537.
Bennion, D B, F B Thomas, B Schulmeister, T Ma, and others. 2006. “A Correlation of the Low and High Temperature Water-Oil Relative Permeability Characteristics of Typical Western Canadian Unconsolidated Bitumen Producing Formations.” In Canadian International Petroleum
Conference.
Casse, Francis J, Henry J Ramey Jr, and others. 1979. “The Effect of Temperature and Confining Pressure on Single-Phase Flow in Consolidated Rocks (Includes Associated Paper 9087).”
Journal of Petroleum Technology 31 (08). Society of Petroleum Engineers: 1–51.
Chau, Kwok-wing. 2017. “Use of Meta-Heuristic Techniques in Rainfall-Runoff Modelling.” Multidisciplinary Digital Publishing Institute.
Chuntian, Cheng, and Kwok-Wing Chau. 2002. “Three-Person Multi-Objective Conflict Decision in Reservoir Flood Control.” European Journal of Operational Research 142 (3). Elsevier: 625– 631.
Dargahi-Zarandi, Atefeh, Abdolhossein Hemmati-Sarapardeh, Sassan Hajirezaie, Bahram Dabir, and Saeid Atashrouz. 2017. “Modeling Gas/Vapor Viscosity of Hydrocarbon Fluids Using a Hybrid GMDH-Type Neural Network System.” Journal of Molecular Liquids 236. Elsevier: 162–171. Ehrlich, Robert, and others. 1970. “The Effect of Temperature on Water-Oil Imbibition Relative
Permeability.” In SPE Eastern Regional Meeting.
Esmaeili, Sajjad, Hemanta Sarma, Thomas Harding, and Brij Maini. 2019a. “Review of the Effect of Temperature on Oil-Water Relative Permeability in Porous Rocks of Oil Reservoirs.” Fuel 237. Elsevier: 91–116.
Esmaeili, Sajjad, Hemanta Sarma, Thomas Harding, and Brij Maini. 2019b. “A Data-Driven Model for Predicting the Effect of Temperature on Oil-Water Relative Permeability.” Fuel 236. Elsevier: 264–277.
21
Temperature on Oil/Water Relative Permeability in Clastic Reservoirs.” Fuel 246. Elsevier: 93– 103.
Ferreira, Cândida. 2001. “Algorithm for Solving Gene Expression Programming: A New Adaptive Problems.” Complex Systems 13 (2): 87–129.
Green, Don W, G Paul Willhite, and others. 1998. Enhanced Oil Recovery. Vol. 6. Henry L. Doherty Memorial Fund of AIME, Society of Petroleum Engineers Richardson, TX.
Hemmati-Sarapardeh, Abdolhossein, Forough Ameli, Amir Varamesh, Shahaboddin Shamshirband, Amir H Mohammadi, and Bahram Dabir. 2018. “Toward Generalized Models for Estimating Molecular Weights and Acentric Factors of Pure Chemical Compounds.” International Journal
of Hydrogen Energy 43 (5). Elsevier: 2699–2717.
Hemmati-Sarapardeh, Abdolhossein, Mohammad-Hossein Ghazanfari, Shahab Ayatollahi, and Mohsen Masihi. 2016. “Accurate Determination of the CO2-Crude Oil Minimum Miscibility Pressure of Pure and Impure CO2 Streams: A Robust Modelling Approach.” The Canadian
Journal of Chemical Engineering 94 (2). Wiley Online Library: 253–261.
Hemmati-Sarapardeh, Abdolhossein, and Erfan Mohagheghian. 2017. “Modeling Interfacial Tension and Minimum Miscibility Pressure in Paraffin-Nitrogen Systems: Application to Gas Injection Processes.” Fuel 205. Elsevier: 80–89.
Hobold, Gustavo M, and Alexandre K da Silva. 2019. “Automatic Detection of the Onset of Film Boiling Using Convolutional Neural Networks and Bayesian Statistics.” International Journal of
Heat and Mass Transfer 134. Elsevier: 262–270.
Honarpour, M M, N R Nagarajan, K Sampath, and others. 2006. “Rock/Fluid Characterization and Their Integration—Implications on Reservoir Management.” Journal of Petroleum Technology
58 (09). Society of Petroleum Engineers: 120–130.
Koza, John R. 1992. Genetic Programming II, Automatic Discovery of Reusable Subprograms. MIT Press, Cambridge, MA.
Kumar, S, S J Torabzadeh, L L Handy, and others. 1985. “Relative Permeability Functions for High-and Low-Tension Systems at Elevated Temperatures.” In SPE California Regional Meeting. Li, Bin, Wan fen Pu, Ke xing Li, Hu Jia, Ke Yu Wang, and Zai guang Yang. 2014. “The
Characteristics and Impacts Factors of Relative Permeability Curves in High Temperature and Low-Permeability Limestone Reservoirs.” Advanced Materials Research.
Lo, Hing Y, N Mungan, and others. 1973. “Effect of Temperature on Water-Oil Relative
Permeabilities in Oil-Wet and Water-Wet Systems.” In Fall Meeting of the Society of Petroleum
Engineers of AIME.
Maini, B, and others. 1998. “Is It Futile to Measure Relative Permeability for Heavy Oil Reservoirs?”
Journal of Canadian Petroleum Technology 37 (04). Petroleum Society of Canada.
Maini, BRIJ B, T Okazawa, and others. 1987. “Effects of Temperature on Heavy Oil-Water Relative Permeability of Sand.” Journal of Canadian Petroleum Technology 26 (03). Petroleum Society of Canada.
Menad, Nait Amar, and Zeraibi Noureddine. 2019. “An Efficient Methodology for Multi-Objective Optimization of Water Alternating CO2 EOR Process.” Journal of the Taiwan Institute of
Chemical Engineers 99. Elsevier: 154–165.
Meyer, Richard F, Emil D Attanasi, and Philip A Freeman. 2007. Heavy Oil and Natural Bitumen
Resources in Geological Basins of the World.
Moazenzadeh, Roozbeh, Babak Mohammadi, Shahaboddin Shamshirband, and Kwok-wing Chau. 2018. “Coupling a Firefly Algorithm with Support Vector Regression to Predict Evaporation in Northern Iran.” Engineering Applications of Computational Fluid Mechanics 12 (1). Taylor & Francis: 584–597.
Mosavat, Nader, Adel Mohsenzadeh, Yahya Al-Wahaibi, and others. 2016. “Estimating Oil/Water Relative Permeability at SAGD Steam Chamber Edge.” In SPE Heavy Oil Conference and Exhibition.
Nait Amar, Menad, Zeraibi Noureddine, Abdolhossein Hemmati-Sarapardeh, and Shahaboddin Shamshirband. 2019. “Modeling Temperature-Based Oil-Water Relative Permeability by Integrating Advanced Intelligent Models with Grey Wolf Optimization: Application to Thermal Enhanced Oil Recovery Processes.” Fuel 242 (April). Elsevier: 649–663.
22
Nait Amar, Menad, Nourddine Zeraibi, and Kheireddine Redouane. 2018a. “Optimization of WAG Process Using Dynamic Proxy, Genetic Algorithm and Ant Colony Optimization.” Arabian
Journal for Science and Engineering 43 (11). Springer: 6399–6412.
Nait Amar, Menad, Nourddine Zeraibi, and Kheireddine Redouane. 2018b. “Bottom Hole Pressure Estimation Using Hybridization Neural Networks and Grey Wolves Optimization.” Petroleum 4 (4). Elsevier: 419–429.
Nait Amar, Menad, and Noureddine Zeraibi. 2018. “Application of Hybrid Support Vector Regression Artificial Bee Colony for Prediction of MMP in CO2-EOR Process.” Petroleum. Elsevier. Olayiwola, Saheed Olawale, and Morteza Dejam. 2019. “A Comprehensive Review on Interaction of
Nanoparticles with Low Salinity Water and Surfactant for Enhanced Oil Recovery in Sandstone and Carbonate Reservoirs.” Fuel 241. Elsevier: 1045–1057.
Poston, S W, S Ysrael, AKMS Hossain, E F Montgomery III, and others. 1970. “The Effect of Temperature on Irreducible Water Saturation and Relative Permeability of Unconsolidated Sands.” Society of Petroleum Engineers Journal 10 (02). Society of Petroleum Engineers: 171– 180.
Prats, Michael. 1982. “Thermal Recovery.” SPE of AIME, New York, NY.
Redouane, Kheireddine, Nourddine Zeraibi, and Menad Nait Amar. 2018. “Automated Optimization of Well Placement via Adaptive Space-Filling Surrogate Modelling and Evolutionary
Algorithm.” In Abu Dhabi International Petroleum Exhibition & Conference.
Rostami, Alireza, Abdolhossein Hemmati-Sarapardeh, Abdorreza Karkevandi-Talkhooncheh, Maen M Husein, Shahaboddin Shamshirband, and Timon Rabczuk. 2019. “Modeling Heat Capacity of Ionic Liquids Using Group Method of Data Handling: A Hybrid and Structure-Based Approach.”
International Journal of Heat and Mass Transfer 129. Elsevier: 7–17.
Saboorian-Jooybari, Hadi, Morteza Dejam, and Zhangxin Chen. 2016. “Heavy Oil Polymer Flooding from Laboratory Core Floods to Pilot Tests and Field Applications: Half-Century Studies.”
Journal of Petroleum Science and Engineering 142. Elsevier: 85–100.
Schembre, Josephina Maria, Guo-qing Tang, Anthony Robert Kovscek, and others. 2005. “Effect of Temperature on Relative Permeability for Heavy-Oil Diatomite Reservoirs.” In SPE Western
Regional Meeting.
Shahsavar, Amin, Shoaib Khanmohammadi, Arash Karimipour, and Marjan Goodarzi. 2019. “A Novel Comprehensive Experimental Study Concerned Synthesizes and Prepare Liquid Paraffin-Fe3O4 Mixture to Develop Models for Both Thermal Conductivity & Viscosity: A New
Approach of GMDH Type of Neural Network.” International Journal of Heat and Mass Transfer
131. Elsevier: 432–441.
Sinnokrot, A A. 1969. “The Effect of Temperature on Capillary Pressure Curves of Limestone and Sandstones [Ph. D. Dissertation].” Stanford University.
Sinnokrot, Ali A, Hi J Ramey Jr, S S Marsden Jr, and others. 1971. “Effect of Temperature Level upon Capillary Pressure Curves.” Society of Petroleum Engineers Journal 11 (01). Society of
Petroleum Engineers: 13–22.
Teodorescu, Liliana, and Daniel Sherwood. 2008. “High Energy Physics Event Selection with Gene Expression Programming.” Computer Physics Communications 178 (6). Elsevier: 409–419. Tillerson, Rex W, and others. 2008. “Meeting Global Energy Supply and Demand Challenges.” In
19th World Petroleum Congress.
Torabi, Farshid, Nader Mosavat, and Ostap Zarivnyy. 2016. “Predicting Heavy Oil/Water Relative Permeability Using Modified Corey-Based Correlations.” Fuel 163. Elsevier: 196–204.
Weinbrandt, R M, H J Ramey Jr, F J Casse, and others. 1975. “The Effect of Temperature on Relative and Absolute Permeability of Sandstones.” Society of Petroleum Engineers Journal 15 (05). Society of Petroleum Engineers: 376–384.
Wu, C L, and K W Chau. 2011. “Rainfall--Runoff Modeling Using Artificial Neural Network Coupled with Singular Spectrum Analysis.” Journal of Hydrology 399 (3–4). Elsevier: 394–409.
Xi, Lei, Jianmin Gao, Liang Xu, Zhen Zhao, and Yunlong Li. 2018. “Study on Heat Transfer Performance of Steam-Cooled Ribbed Channel Using Neural Networks and Genetic Algorithms.” International Journal of Heat and Mass Transfer 127. Elsevier: 1110–1123. Yaseen, Zaher Mundher, Sadeq Oleiwi Sulaiman, Ravinesh C Deo, and Kwok-Wing Chau. 2019. “An
23
Practical Applications in Water Resource Engineering Area and Future Research Direction.”
Journal of Hydrology 569. Elsevier:387-408.
Zhang, Lie-hui, Jing Tong, Yu Xiong, and Yu-long Zhao. 2017. “Effect of Temperature on the Oil--Water Relative Permeability for Sandstone Reservoirs.” International Journal of Heat and Mass
24
Table 1. Summary of the important correlations for temperature-based oil/water relative permeability prediction. Bennion et al. (Bennion et al. 2006), Mosavat et al. (Mosavat et al.
2016), Torabi et al. (Torabi, Mosavat, and Zarivnyy 2016) and Zhang et al. (Zhang et al. 2017) are
Model Correlations Note
(Bennion et al. 2006)
60 °𝐶 < 𝑇 < 100 °𝐶
𝐾𝑟𝑤= 0.021(1 −
0.6 − 𝑆𝑤 0.45 )
5 - On the basis of :
•McMurray sand •Unsteady state / steady
state •Heavy oil
•Darcy law / history match
- Restrictions: •0.11 < 𝑆𝑤𝑖 < 0.43 •0.12 < 𝑆𝑜𝑟 < 0.72 •8000 < 𝜇𝑜 < 106 𝑐𝑃 𝐾𝑟𝑜=(
0.6 − 𝑆𝑤 0.45 )
2.2
150 °𝐶 < 𝑇 < 275 °𝐶
𝐾𝑟𝑤
= 0.055(1 −0.85 − 𝑆𝑤 0.7 )
2.5
𝐾𝑟𝑜=(
0.85 − 𝑆𝑤 0.7 ) 3 (Torabi, Mosavat, and Zarivnyy 2016)
𝐾𝑟𝑤 = 0.0466(0.0588 𝑃𝑒𝑥𝑝 𝑃𝑠𝑡𝑑
)
−1.28676
× 𝑒0.34443(2−
𝑞𝑒𝑥𝑝
𝑞𝑠𝑡𝑑)
×(0.0025 𝜇𝑜 𝜇𝑠𝑡𝑑
)
−0.34267
(𝑆𝑤− 𝑆𝑤𝑖 1 − 𝑆𝑤𝑖
)
2
- On the basis of : •Berea sandstone •Unsteady state
approach
•Heavy oil and light oil •JBN method
- Restrictions: •0.092 < 𝑆𝑤𝑖< 0.138 •0.463 < 𝑆𝑜𝑟< 0.539 •27 < 𝑇 < 45 °𝐶 •24.3 < 𝜇𝑜< 400.2 𝑐𝑃 𝐾𝑟𝑜=(0.0588
𝑃𝑒𝑥𝑝 𝑃𝑠𝑡𝑑
)
−0.0291
× 𝑒−0.01254(2−
𝑞𝑒𝑥𝑝
𝑞𝑠𝑡𝑑)×(1 −𝑆𝑤− 𝑆𝑤𝑖
1 − 𝑆𝑤𝑖
)
2
×(1 −(𝑆𝑤− 𝑆𝑤𝑖 1 − 𝑆𝑤𝑖
)
0.1(0.025𝜇𝜇𝑜
𝑠𝑡𝑑) −0.818 ) (Mosavat et al. 2016) 𝐾𝑟𝑤 =( 𝑆𝑤− 𝑆𝑤𝑖 1 − 𝑆𝑤𝑖
)
𝑎 𝑎
= 1.32 + 0.00123(𝜇𝑜
𝜇𝑤) − 7.47 × 10⁻⁷(𝜇𝑜
𝜇𝑤) 2
𝑏
= 102 + 0.000298(𝜇𝑜
𝜇𝑤
)
− 1.38 × 10⁻⁷(𝜇𝑜 𝜇𝑤
)
2
𝑐
= 2.22 + 0.00318(𝜇𝑜
𝜇𝑤) − 1.22 × 10⁻⁶(𝜇𝑜
𝜇𝑤) 2
- On the basis of : •Ottawa silica sand •Unsteady state
approach •Heavy oil •History match
- Restrictions: •0.05 < 𝑆𝑤𝑖 < 0.105 •0.2 < 𝑆𝑜𝑟 < 0.413 •23 < 𝑇 < 100 °𝐶 •19.5 < 𝜇𝑜 < 1860 𝑐𝑃
𝐾𝑟𝑜=(1 −(
𝑆𝑤− 𝑆𝑤𝑖
1 − 𝑆𝑤𝑖) 𝑏
) (1 −𝑆𝑤− 𝑆𝑤𝑖 1 − 𝑆𝑤𝑖)
𝑐
(Zhang et al. 2017)
𝐾𝑟𝑤
= 𝐾𝑟𝑤0−50𝐶(𝑒1+ 𝑒2𝑇 +
𝑒3 𝑇
+𝑒4 𝑇2) (
𝑆𝑤− 𝑆𝑤𝑖 1 − 𝑆𝑤𝑖− 𝑆𝑜𝑟
)
𝑎3𝑇+𝑎4
𝑒1= 20.14 𝑒2= −0.053 𝑒3= −1638.84 𝑒4= 40763.24 𝑎1= 0.0244 𝑎2= 3.8848 𝑎3= −0.0001 𝑎4=0.5099 𝑏1= 0.0025 𝑏2= 0.1941 𝑐1= −0.1121 𝑐2= 0.6711
- On the basis of : •Tight sand stone •Unsteady state
approach •Light oil
•Combination of JBN and Corey correlation
- Restrictions: •0.234 < 𝑆𝑤𝑖< 0.482 •0.153 < 𝑆𝑜𝑟< 0.324 •25 < 𝑇 < 100 °𝐶 •4 < 𝜇𝑜< 48 𝑐𝑃 𝐾𝑟𝑜
=( 1 − 𝑆𝑤− 𝑐1ln(𝑇)− 𝑐2 1 − 𝑏1𝑇 − 𝑏2− 𝑐1ln(𝑇)− 𝑐2
)
25
Table 2. Statistical description of the input/output data.
Max Min Mean SD
Oil Relative Permeability
Input
Absolute permeability (mD) 95000 147 21778.9 34047.5
Temperature (°C) 200 21.10 97.75 47.31
Sw 1 0.052 0.4623 0.2010
Water viscosity (cP) 1.10 0.136 0.42 0.29
Oil viscosity (cP) 1190 0.419 88.93 224.38
Output Kro 1 0 0.3634 0.3118
Water Relative Permeability
Input
Absolute permeability (mD) 95000 147 23443.39 35241
Temperature (°C) 200 21.10 99.56 45.66
Sw 1 0.052 0.533 0.219
Water viscosity (cP) 1.10 0.136 0.40 0.27
Oil viscosity (cP) 1190 0.7 88.39 223.19
26
Table 3. GEP setting parameters used in the study
Parameters Value/setting
The number of head size 8 - 15
Chromosome 150
Gene 8 - 12
Population 300 - 500
Mutation rate 0.25
Inversion rate 0.1
Operators used +, −, ×, /, EXP, X
2, INV, TANH,
27
Table 4. Expressions of the terms appearing in Kro GEP correlations
21.10 < 𝑇 ≤ 100 °𝐶 100 < 𝑇 ≤ 200 °𝐶
A1 0.5492 × 𝜇𝑤+ 3.596 × 𝑆𝑤−
10−5× 𝑇2
1.3 × 𝜇𝑜− 10.67562 5.8 − 6.343 × 𝑆𝑤×√𝜇𝑜
A2 0.06567 + 0.1093 × 𝑡𝑎𝑛ℎ(𝜇𝑤)− 0.001972 × 𝑆𝑤× 𝑇 × 𝜇𝑤+(
𝑆𝑤
𝐾)×(0.467 × 𝑇 + 3.869) 7422 × 𝑆𝑤− 4659 × 𝑡𝑎𝑛ℎ(𝑆𝑤)− 5.8 × 𝑇
A3 0.4542 + 𝜇𝑤(0.001875 × 𝐾 + 0.007486)+
0.0003327 × 𝐾 𝜇𝑤
11.01 +1.809 𝜇𝑤
(𝑇 − 1)
A4
1.355 × 10⁻⁵ 𝑇 × 𝜇𝑤2
−6.954 × 10
−6
√𝜇𝑜
68.06 + 6.343 × 𝑆𝑤2
A5 0.6238 × 𝑒𝑥𝑝(2 × 𝑆𝑤)+ 0.3137 𝑙𝑛(𝑇 + 𝜇𝑜)+(4.421 − 0.02517 × 𝑙𝑛(𝐾))× 𝑙𝑛(𝐾) 7.523 ×(𝑇 + 𝐾)+
11.01 × 𝜇𝑜
√𝑆𝑤
A6 0.006523 ×(√𝐾 − 𝜇𝑤)+
0.0001183 ×(𝐾 − 𝑇) 𝜇𝑜
+ 27.8
−0.007834 +2.722 𝐾
+ 0.3102 × 𝑆𝑤× 𝜇𝑤 3.603 × 𝜇𝑜− 30.37
A7
0.03168 + 0.009715 × 𝜇𝑜
𝑡𝑎𝑛ℎ(𝜇𝑤)
− 4.208 × 𝑡𝑎𝑛ℎ(𝑡𝑎𝑛ℎ(𝑆𝑤))
+ 0.6253 × 𝑙𝑛(𝑆𝑤+ 𝜇𝑤)+ 2.722 ×√𝜇𝑤
− 1.437 × 𝜇𝑜 1
28
Table 5. Statistical indexes of the established correlations
Training Testing All
Krw
RMSE R2 RMSE R2 RMSE R2
GMDH 0.0468 0.9711 0.0408 0.9846 0.0456 0.9738 GEP 0.0278 0.9899 0.0305 0.9918 0.0284 0.9903
29
Table 6. Statistical parameters of various models for temperature-based oil-water relative permeability.
RMSE R2
Kro
Mosavat et al. 0.2982 0.8257
Zhang et al. 0.1879 0.8326
Bennion et al. 0.2665 0.6240
GEP 0.0636 0.9794
Krw
Mosavat et al. 0.3105 0.7687
Zhang et al. 0.0451 0.8923
Bennion et al. 0.2425 0.2347
30
31
Mathematical expression: 𝒍𝒐𝒈(𝒙 − 𝒚)+ 𝒙 × 𝒛
Fig. 2. An example of two-gene chromosome and its mathematical expression
z
𝒍𝒐𝒈
×
−
𝒙
𝒙
y
32
Fig. 3. A schematic structure of the proposed GMDH for predicting Krw
𝑆𝑤
𝑇
𝜇𝑜
𝜇𝑤
𝐾
𝑵𝟏
𝑵𝟐
𝑵𝟑
𝑵𝟒
33
Fig. 4. A schematic structure of the proposed GMDH for predicting Kro
𝑆𝑤
𝑇
𝜇𝑜
𝜇𝑤
𝐾
34
Fig. 5. Cross plots of the established GMDH and GEP correlations (Kro) 0
0.2 0.4 0.6 0.8 1
0 0.2 0.4 0.6 0.8 1
P
re
d
ic
te
d
K
ro
Measured Kro GEP
Slope 1 Training data Test data 0
0.2 0.4 0.6 0.8 1
0 0.2 0.4 0.6 0.8 1
P
re
d
ic
te
d
K
ro
Measured Kro GMDH Slope 1
35
Fig. 6. Cross plots of the established GMDH and GEP correlations (Krw) 0
0.2 0.4 0.6 0.8 1
0 0.2 0.4 0.6 0.8 1
P
re
d
ic
te
d
K
rw
Measured Krw GEP
Slope 1 Training data Test data 0
0.2 0.4 0.6 0.8 1
0 0.2 0.4 0.6 0.8 1
P
re
d
ic
te
d
K
rw
Measured Krw GMDH
36
Fig. 7. Comparison between the established correlations: (a) RMSE and (b) R2
0 0.02 0.04 0.06 0.08 0.1 0.12
GMDH
GEP
R
MSE
Kro
Krw
(a)
0.9 0.91 0.92 0.93 0.94 0.95 0.96 0.97 0.98 0.99 1
GMDH
GEP
R
2 Kro
Krw
37
Fig. 8. The comparison between the predicted Kro values by the GEP model and the Kro real values: (a) training data and (b) testing data.
0 0.2 0.4 0.6 0.8 1
0 50 100 150 200 250 300 350 400 450 500 550
Kr
o
Data Index
Training data
Measured Kro Predicted Kro
(a)
0 0.2 0.4 0.6 0.8 1
0 20 40 60 80 100 120 140
Kr
o
Data Index
Tesing data
Measured Kro Predicted Kro
38
Fig. 9. The comparison between the predicted Krw values by the GEP model and the Krw real values: (a) training data and (b) testing data.
0 0.2 0.4 0.6 0.8 1
0 50 100 150 200 250 300 350 400 450 500
Kr
w
Data Index
Training data
Measured Krw Predicted Krw
(a)
0 0.2 0.4 0.6 0.8 1
0 20 40 60 80 100 120
Kr
w
Data Index
Testing data
Measured Krw Predicted Krw
39
40
41
42
43
Fig. 14. The obtained (a) root mean squared error and (b) coefficient of correlation while estimating temperature-based oil/water relative permeability by GEP and available pre-existing correlations.
0 0.05 0.1 0.15 0.2 0.25 0.3 0.35
Mosavat et al. Zhang et al. Bennion et al. GEP
RMSE
Krw Kro
(a)
0 0.2 0.4 0.6 0.8 1
Mosavat et al. Zhang et al. Bennion et al. GEP
R2
Krw Kro
44
Fig. 15. Comparison between experimental values and outputs generated via GEP correlations
versus water saturation for two cases included in this study. 0
0.2 0.4 0.6 0.8 1
0 0.2 0.4 0.6 0.8 1
Kr
Sw
Measured Kro (Sample data 1) Measured Krw (Sample data 1) GEP Kro
GEP Krw (a)
0 0.2 0.4 0.6 0.8 1
0.2 0.4 0.6 0.8 1
Kr
Sw
Measured Kro (Sample data 2) Measured Krw (Sample data 2) GEP Kro