Enabling Big Data Complex Event Processing
for Quantitative Finance through a
Data-Driven Execution
Venkatesh N1, Dr. D. G Jyothi2M. Tech Student, Department of Computer Science and Engineering, Bangalore Institute of Technology,
Bangalore, India1
Associate Professor &PG Coordinator, Department of Computer Science and Engineering, Bangalore Institute of
Technology, Bangalore, India2
ABSTRACT: Quantitative finance is also called as mathematical finance where it generally uses large amount datasets
which is obtained from financial stock markets to study and analyze its behavior. Suitable data modelling technique is done in Quantitative finance with the help of mathematical tools in order to study and analyze the behavior of a financial market. Complex Event Processing is usually used to predict future events in the field of Quantitative finance. Existing System uses Auto Regressive Integrated Moving Average(ARIMA)which is a statistical model to predict stock prices. But ARIMA works for less number of observations. In the proposed system Exponential Smoothing is used to predict stock prices. Further Algorithmic Trading Concept is used where itsmain objective is to maximize profit minimize loss and to develop a suitable strategy for trading purpose.The strategy that is developed is a Moving Average Cross Over Strategy.The predicted stock price performance has to be measured with the help of Algorithmic Trading Strategy where it also calculates strategic returns of the stock price. The strategic returns risk factor is measured with calculation of skew and kurtosis. These two risk factors are measured and output values are analyzed
.
KEYWORDS: Quantitative finance, Forecast, Predict, Risk Management, Algorithmic Trading, Moving Average,
Exponential Smoothing, Auto Regressive Integrated Moving Average(AIMA), Moving Average Crossover
I. INTRODUCTION
II. RELATED WORKS
In [1], Quantitative finance is developed in a cloud platform and data is stored in a Solid State Disk(SSD). This SSD is a kind of flash memory where data can be restored even in case of power loss. Extensively large amount of data set is considered to study financial firms behavior. New York Stock Exchange data set is considered. But small financial firms cannot use this because of cost of Cloud Platform. In [2]Scientific Numeric Computing(SNC) is studied which is a technique where it utilizes Cloud platform to provide computing services. SNC is a software where it combines numerical and symbolic method. Example is the computer algebra and logic gates concept.This feature is tested in various cloud platforms like AMAZON and Microsoft windows Azure. But Security is a major problem in SNCEven small client companies cannot recommend this feature because of the cost of the cloud.[3] Presented a data-oriented approach for scheduling the dependent tasks on high-density multi-GPU systems.Instead of task scheduling, data scheduling is done. . Strassen matrix multiplication and Cholesky matrixinversion matrices are used to solve scheduling problems. Stressem Matrix is to devlop equations for matrix multiplication and Cholesky matrix is to find conjugate inverse in lower triangular elements. But complexity is higher because matrix multiplication is difficult for large number of matrices which has more number of rows and columns. [4] For parallel computers where the computations are carried out simultaneously, data oriented approach is used to solve mapping and dead lock problems. Strassen matrix multiplication and Cholesky matrix inversion is used. But complexity will be more for large number of matrices.
III. PROPOSED SYSTEM
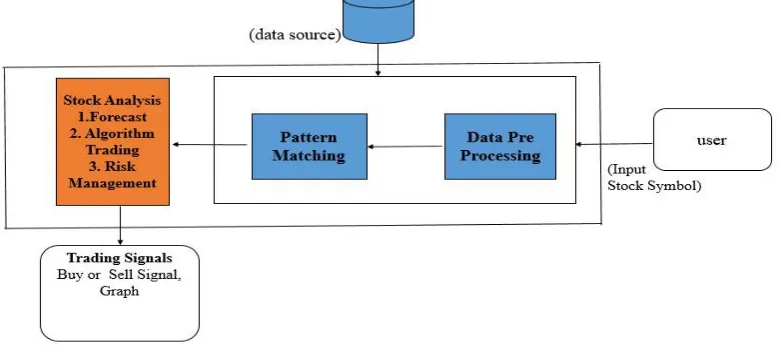
In the following architecture diagram, the user gives stock symbol as input. Stock Symbol is a symbol is an arrangement of character, usually letters. For example the stock symbol for Amazon is AMZN and GOOGLE is GOOG. When investors who want to invest in particular company, it invests based on these symbols that are given by the company. The data source is usually the source file where companies stock data is available. The data source is in a form of .csv file. It is a offline process. There are a lot of internet data sources available where we obtain data from an api. The commonly used api are GOOGLE or Yahoo.
Data Preprocessing is the initial step. Data preprocessing is done usually to clean the data. It is an important step in Quantitative finance. Since we are using a .csv file, we refer this as a two dimensional structure. Pattern Matching is done usually to smooth the data and to predict the stock prices more accurate and find the current trend of a particular stock symbol. In pattern Matching Technique, we use the sliding window technique where user has to specify the window period. It can be either 1, 2, 3…n etc. In this method, we group events, that is for every three consecutive stock price, we find maximum stock price and the process continues until all observations are complete.
Fig 1 Architectural Diagram
After processing the data we have to forecast the data. We use exponential soothing method. Exponential smoothing forecasting methods is equivalent to that of a moving average. In moving average equal weights are given to all observations. But in Exponential Smoothing decreasing weights are assigned to pervious observations. For the recentdata high weight is associated, and for the previous data decreasing and less weight is associated. The forecast results that are produced are more accurate. Two important are measured here.They are the level component and a tend component which is termed as l and b
– ℓT-1 is the level component and it is a permanent component.
– bT-1 is the estimate of the growth factor in the stock price analysis and it is a trend component – Forecast Equation - ℓT * hbT. Where h is the time period
After predicting future stock prices of corresponding stock sybol we have to test the behavior of stock prices. So we have to execute Algorithmic Trading.An algorithmic trading is based on predefined set of rules to achieve a profitable return in stock markets. These predefined rules is executed by system to make trading decision .A trading strategy is developedto determine the buying and selling conditions in markets that is based on predefined rules used to make trading decisions.
In Algorithmic trading strategy we implement Moving-Average Crossoverwe first need to understand moving average calculation. Moving average is also called as In moving average cross over strategy, uses two moving averages, a slow moving average and a fast moving average. In a fast moving average, the moving average is calculated for a short period of time it may be 5-, 10- or 25-day etc while the slow moving average is medium or long period of time. 50-5-, 100- or 200-day etc. We plot these two moving average to check the crossover condition. A crossover condition occurs when a fast moving average line crosses a slow moving average line. If this condition is met, then the trader gets a buy signal else it is termed as a sell signal. The strategic returns is calculated based on the signal generated to measure the risk.
Since Moving Average Cross over calculates strategic returns, we have to measure the amount of risk involved. We use this two parameters.
Skew: The coefficient Skewness is a measure for the degree of symmetry in the variable distribution. Skew =Ʃni = 0 (xi– µ)3 / σ3
Kurtosis: The coefficient Kurtosis is a measure for the degree of peakness in the variable distribution.
Kurtosis =Ʃni = 0 (xi – µ)4 / σ4
The final values of skew and kurtosis is obtained and analyzed. If both values obtained is a positive value that is it is greater than 0, then there is no risk involved. But the value obtained is a negative value then there is risk involved in it. The value obtained is equal to zero then it is a hold condition
IV. RESULTS
The following fig 2 shows the graph results for Google stock symbol for the period of 2001 to 2019 intraday data. We are taking the closing price of the specified period. The following graph consists of x axis which is the number of days the stock price is forecasted and y is the closing price in $. We are plotting two lines which are two moving averages for short term period and long term period. The short term period is a blue line which is a 40 day period and long term period which is a red line of 100 day period. Two lines are plotted. If short term period moving average cross long term period then it is a buy signal which is a pink marker. It not, it is a sell signal with a black marker. So if we notice in the following graph, initially it is a sell signal from 0th day to 50th day, the rest of the period is a buy signal with pink marker
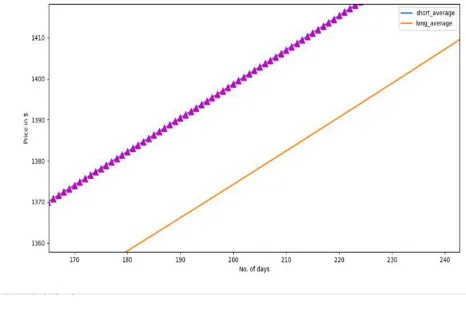
Fig 3 Zoomed View
In following fig 3, the graph is zoomed which is same as that of fig 2,where the graph is viewed in a closer way;. If we notice in the graph it is a buy signal where we plot two moving averages and if we notice, long period moving average line is above the long period moving average. So it’s a buy signal.
V.CONCLUSION
predict future losses occurring in the stock market. In this paper existing system uses Auto Regressive Integrated Moving Average(ARIMA) to predict and forecast future stock prices. Exponential Smoothing method was used instead of ARIMA because Exponential Smoothing was more accurate in predicting stock price than ARIMA. The predicted future stock price is then usually evaluated by using Algorithmic trading Concept where the buy and sell signals are usually generated for future stock prices; Future Strategic Returns are calculated to measure risk. Skew and Kurtosis is used to calculate risk factor. If both values are positive then it’s a profit signal else loss signal. Thus this method has more advantage for investor in critically judging whether the stock that he/she is invested might occur profit or loss.
This method is useful for univariant data; that is only closing price of corresponding stock symbol is considered. This method should extend to bivariant data also.
REFERENCES
[1] P. Zhang, K. Yu, J. Yu, and S. Khan,, "QuantCloud: Big Data Infrastructure for Quantitative Finance on the Cloud", IEEE transaction on Big Data,vol 3, pp 368-380, 2018
[2]Zhang, Peng& Liu, Yueming&Qiu, Meikang. (2017). SNC: A Cloud Service Platform for Symbolic-Numeric Computation using Just-In-Time Compilation. IEEE Transactions on Cloud Computing. pp 1-1, doi 10.1109/TCC.2017.2656088, 2017
[3] P. Zhang, Y. Gao, and M. Qiu, "A data-oriented method for scheduling dependent tasks on high-density multi-GPU systems," in High Performance Computing and Communications (HPCC), 2015 IEEE 7th International Symposium on Cyberspace Safety and Security (CSS), 2015 IEEE 12th International Conference on Embedded Software and Systems (ICESS), 2015 IEEE 17th International Conference on 2015, pp. 694-699, 2015.
[4] P. Zhang, L. Liu, and Y. Deng, "A data-driven paradigm for mapping problems," Parallel Computing, vol. 48, pp. 108-124, 2015.
[5] J. Chevalier and G. Ellison, "Risk taking by mutual funds as a response to incentives," Journal of Political Economy, vol. 105, pp. 1167-1200, 1997.
[6]M. Abadi, P. Barham, J. Chen, Z. Chen, A. Davis, J. Dean, et al., "TensorFlow: A System for Large-Scale Machine Learning," in OSDI, pp. 265-283, 2016.
[7] R. F. Engle and A. J. Patton, "What good is a volatility model," Quantitative finance, vol. 1, pp. 237-245, 2001. [8] W. F. Sharpe, "The sharpe ratio," The journal of portfolio management, vol. 21, pp. 49-58, 1994.
[9]A. McAfee, E. Brynjolfsson, T. H. Davenport, D. Patil, and D. Barton, "Big data," The management revolution. Harvard Bus Rev, vol. 90, pp. 61-67, 2012.
[10] H. Chen, R. H. Chiang, and V. C. Storey, "Business Intelligence and Analytics: From Big Data to Big Impact," MIS Quarterly, vol. 36, pp. 1165-1188, 2012.