EFFECT OF BIAXIALITY ON FRACTURE BEHAVIOR: TESTING AND
ANALYSIS OF CRUCIFORM SPECIMEN
A. K. Pawar1, M. K. Sahu1, J. Chattopadhyay1, B. K. Dutta1, K.K. Vaze1,P. Gandhi2, and G. Raghava2
1Reactor Safety Division, Bhabha Atomic Research Centre, Mumbai, INDIA-400085 2 Structural Engineering Research Center-CSIR Taramani Chennai, INDIA-600113
E-mail of corresponding author: [email protected]
ABSTRACT
This paper presents the details of experimental and numerical studies carried out on the cruciform specimens. Cruciform specimens are widely used to study the effect of biaxial loading on the fracture process. Reactor Safety Division, BARC has embarked upon the fracture tests on cruciform specimens to study this effect. Six numbers of cruciform specimens with part through crack at the core have been tested at room temperature and at –70°C under bending with biaxiality ratio of 1:0, 2:1 and 1:1 at CSIR-SERC, Chennai. Three dimensional elastic-plastic finite element (FE) analyses have been carried out for all the specimens. Results obtained from the FE analyses have been found to be in good agreement with the test data. Crack initiation loads have also been predicted numerically based on the initiation toughness (Ji)SZW. Effect of multiaxiality on various fracture parameters and load bearing capacity of
structures has also been discussed.
INTRODUCTION
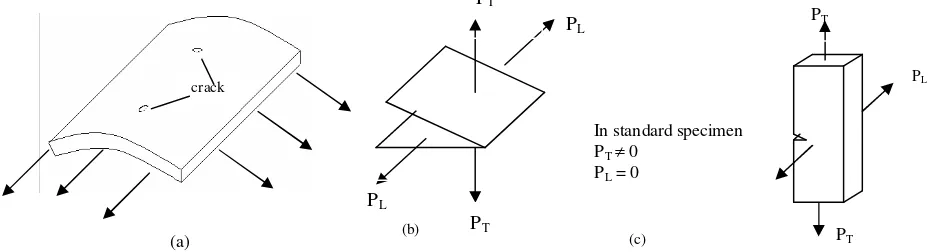
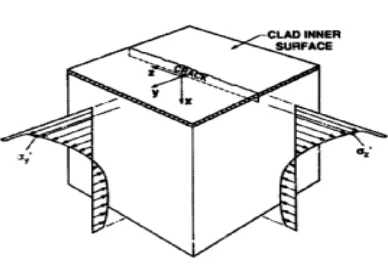
In the analysis of the structural integrity of Reactor Pressure Vessel (RPV) containing flaws, one of the important issues is the estimation of biaxial loading effect on fracture toughness of the material. This problem arises in connection with the the normal operation of RPV as well as under the pressurized thermal shock loading. Figure 1 shows the typical flaw in a pressure vessel and the type of loading the flaw experiences. Figure 2 depicts the components of far field stress distribution in a RPV wall during a PTS transient [1].
Figure 1(a) Loading of pressure vessel (b) crack tip subjected to loading (c) typical specimen for fracture toughness
In the structural integrity analysis of RPV containing the flaws, the fracture toughness values obtained from standard laboratory specimens such as Compact Tension (CT), Three Point Bend Bar (TPBB) are normally used. These specimens are tested under in-plane opening mode (the load acts perpendicular to the crack front (PT≠ 0, PL =
0, as in Figure 1 (c)). The out-of-plane loading (PL) is not represented in these specimens. Therefore two questions
arise:
• Whether it is correct to use fracture toughness data obtained from standard specimen tested under uniaxial loading in order to analyze the onset of crack growth under biaxial loading.
• How fracture toughness depends on biaxiality ratio, β (β = Remote transverse stress acting perpendicular to the crack plane / Remote longitudinal stress acting along the crack front).
crack
(a)
PL
PT
PT
PL
(b) P
T
PL
PT
In standard specimen PT≠ 0
PL = 0
Figure 2 Vessel wall biaxial far-field stress during PTS transient with component aligned
parallel to front of a longitudinal crack.
Figure 3 Schematic of cruciform specimen
Figure 4 Core of cruciform bend specimen Figure 5 Cross section A-A through the crack
There is growing interest worldwide to design a specimen, which can be tested to estimate the effect of biaxial loading on fracture toughness. The majority of the experiments on fracture toughness under biaxial loading have been performed on a plate subjected to biaxial bending moments [1-3]. The configuration of the biaxial bend specimen having cruciform shaped geometry is depicted in Figure 3. The specimen design is capable of reproducing a linear approximation of the non-linear biaxial stress distribution in a RPV wall during a PTS transient [1].
TESTING OF CRUCIFORM BEND SPECIMENS General Specimen Geometry
Figure 6 A photograph of experimental setup for biaxial
testing.
Figure 7 A photograph of Instrumentation on the test section.
Figure 8 Specimen for the uniaxial testing.
Description of test specimens
The brief description of the specimens prepared for the test is given in Table 1. Table 1 Description of the specimen geometry
Specimen Name
Length of transverse arm(mm)
Loading Span
(mm)
Length of longitudinal arm (mm)
Loading Span
(mm)
Test temperature
Biaxiality ratio
Crack length (mm)
Crack depth (mm)
CRRT10 - - 1930 1720 Room
temperature 1:0 425 19.8
CRSZ10 - - 1925 1720 -70°C 1:0 430 20.5
CRRT11 1950 1650 1950 1650 Room
temperature 1:1 320 35.2
CRSZ11 1950 1650 1950 1650 -70°C 1:1 320 36.0
CRSZ21-A 3150 2850 1990 1690 -70°C 2:1 320 35.0
CRSZ21-B 3100 2800 1900 1600 -70°C 2:1 320 36.0
SUMMARY OF TESTS RESULTS
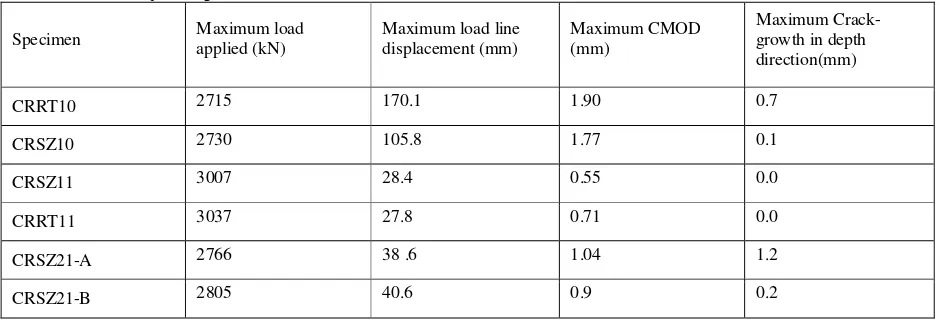
Six numbers of tests have been done and summery of these tests is tabulated in Table 2 in the chronological sequence.
Table 2 Summery of experiments
Specimen Maximum load
applied (kN)
Maximum load line displacement (mm)
Maximum CMOD (mm)
Maximum Crack-growth in depth direction(mm)
CRRT10 2715 170.1 1.90 0.7
CRSZ10 2730 105.8 1.77 0.1
CRSZ11 3007 28.4 0.55 0.0
CRRT11 3037 27.8 0.71 0.0
CRSZ21-A 2766 38 .6 1.04 1.2
FINITE ELEMENT MODELING
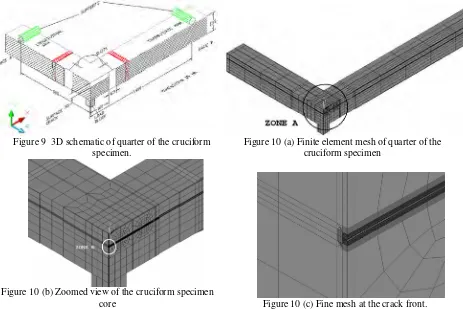
One forth of the cruciform bend specimen has been modeled using the symmetry across two planes. Three dimensional elastoplastic finite element analyses have been performed on the cruciform specimens. Symmetry boundary conditions have been applied on Face A and Face B as shown in the Figure 9. Figure 10(a) shows the mesh of the finite element model. Figure 10(b) and Figure 10(c) show zoomed picture of the mesh near the crack. Twenty-node iso-parametric brick element has been used for the analysis. A blunted crack-front has been modeled with a small radius of 0.2 mm. Reduced integration has been employed to eliminate the shear locking in the elements. The cruciform specimen is assumed to be supported at the ends of its four arms by constraining y direction movement of nodes falling on the support line. Load is applied on the specimen using a load block over the test section (i.e. area defined by -45 ≤ Z ≤ 0, 0 ≤ X ≤ 45). A uniform pressure is applied on the top of the load block.
Figure 9 3D schematic of quarter of the cruciform specimen.
Figure 10 (a) Finite element mesh of quarter of the cruciform specimen
Figure 10 (b) Zoomed view of the cruciform specimen
core Figure 10 (c) Fine mesh at the crack front.
Material properties
The material properties used for the material of the core include Young’s modulus E = 210000 MPa, Poisson’s ratio
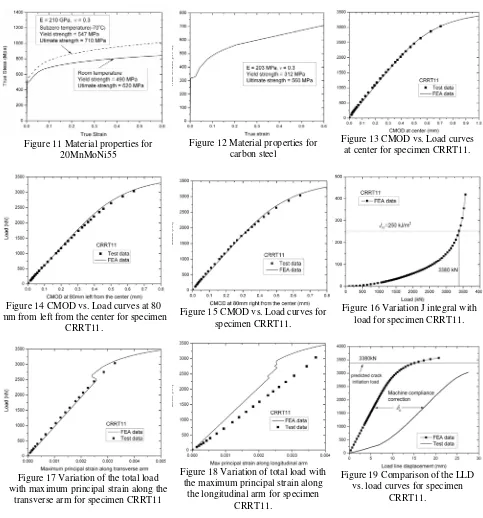
υ = 0.3.The material used for the core of the cruciform specimen is 20MnMoNi55. The yield strength for this material at room temperature is 490MPa and at -70°C is 547 MPa. The true stress vs. true strain curves are shown in Figure 11. Material properties used for the arm material include Young’s modulus E = 203000 MPa, Poisson’s ratio
Figure 11 Material properties for 20MnMoNi55
Figure 12 Material properties for carbon steel
Figure 13 CMOD vs. Load curves at center for specimen CRRT11.
Figure 14 CMOD vs. Load curves at 80 mm from left from the center for specimen
CRRT11.
Figure 15 CMOD vs. Load curves for specimen CRRT11.
Figure 16 Variation J integral with load for specimen CRRT11.
Figure 17 Variation of the total load with maximum principal strain along the
transverse arm for specimen CRRT11
Figure 18 Variation of total load with the maximum principal strain along
the longitudinal armfor specimen CRRT11.
Figure 19 Comparison of the LLD vs. load curves for specimen
CRRT11.
FINITE ELEMENT ANALYSES RESULTS
In finite element analyses it has been observed that the area of the load application has a significant effect on the results obtained. During the uniaxial room temperature test, a metal plate of dimension 300x300x40, i.e. of the size of the core had been placed between the specimens and load ram. For all other tests the loading ram directly kept over the specimen. This metal block has been incorporated in the finite element modeling for CRRT10.
for all but one case. For specimen CRRT11 crack initial load predicted less than the maximum load and no crack growth found in this case.
Cruciform bend Specimen at room temperature and biaxiality ratio unity (CRRT11)
The results of the FE analysis for specimen CRRT11 have been compared with the test data. Figure 13, Figure 14 and Figure 15 show the crack mouth opening displacement (CMOD) vs. load curves from three different locations along the crack length. There were three CMOD gauges had been placed along the length of the crack during the experiment, one at the center and one each at either side 80mm from the center. The finite element analysis data have also been plotted along with the test data. It is clear from Figures 25-27 that the analysis results are matching extremely well with the test data. CMOD measurements are independent of machine compliance behavior. Figure 16 shows the variation of the crack driving force (applied J-integral) with load. JIC value for 20MnMoNi55 is 250 kJ/m2
at room temperature. It is clear from the figure that load corresponding to the JIC is 3380 kN, which is more than the
maximum load (3037 kN) applied during the test. It has been found that there is no crack growth during the experiment. Figure 17 and Figure 18 depict the variation of the load with the maximum principal strain along the transverse and longitudinal directions respectively. Two strain gauges had been placed along each arm of the cruciform specimen in the space between the load diffusion control slots.
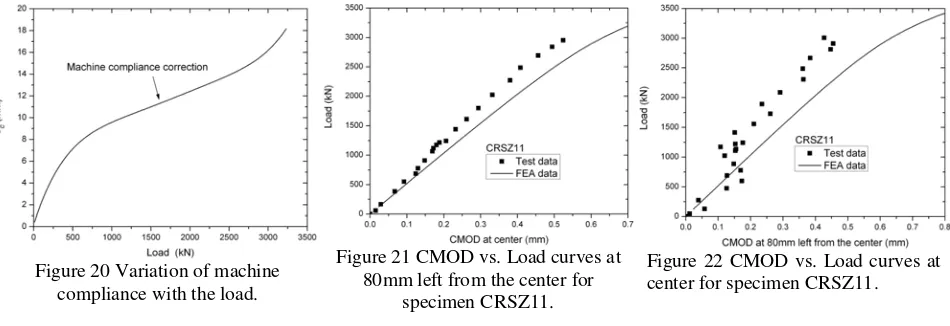
Figure 20 Variation of machine compliance with the load.
Figure 21 CMOD vs. Load curves at 80mm left from the center for
specimen CRSZ11.
Figure 22 CMOD vs. Load curves at center for specimen CRSZ11.
Machine compliance correction
Figure 19 shows load line displacement vs. Load curves. Predicted crack initiation load has been shown by horizontal line. This line does not cross the test line. The data from FE analysis deviate excessively from the test data. This deviation can be attributed to the machine compliance, which is included in load line displacement measurement. The difference in values of load line displacement in test data and in FE result can be stated as machine compliance. The machine compliance can be determined from the test data and FEA data of the specimen CRRT11. A correction can be applied to the load line displacement measurements of other remaining tests, since all the tests have been carried out on the same machine. Kalidindi, Abusafieh and El-Denah [4] have discussed various techniques to determine the machine compliance and their shortcomings and suggested some improvements. Although the correction used in the paper is for compression test yet it has been applied to the specimens subjected to bending, since ultimate effect on the testing machine in both the case is similar. In this paper, second method described in [4] has been incorporated. In this technique, the measured load-displacement relationship for a given specimen (test data) is subtracted from its FE analysis load-displacement relationship to obtain the machine compliance relationship. The machine compliance has been plotted against the load in Figure 20 and a polynomial of order five has been fitted. Machine compliance correction a function of the load is given in Equation 1, the load P is in kN.
16 5 12 4 8 3 2 1 0 5 5 4 4 3 3 2 2 1 0 10 9869 . 3 , 10 6018 . 3 , 10 2886 . 1 , 0000226 . 0 , 022348 . 0 , 23093 . 0 − − − =− × = × × = − = = = + + + + + = A A A A A A P A P A P A P A P A A c δ …(1)
Cruciform bend Specimen at subzero temperature and biaxiality ratio unity (CRSZ11)
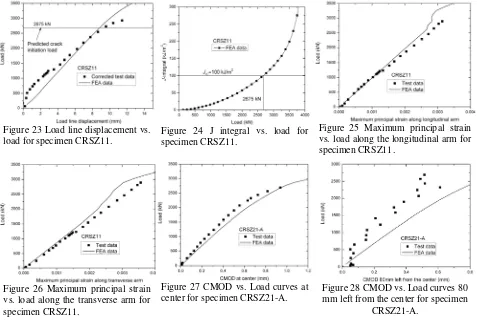
been measured at the centre of crack and 80mm left from the center. It is clear from the figure that the FE analysis results slightly differ from the test data. Since test is carried out at very low temperature (-70°C) the data acquired are not smooth. Corrupted CMOD measurement obtained from the CMOD gauges that were not at the center. Loading has been done only up to 3007kN. A correction has been applied to the load line displacement of the test data for the machine compliance as discussed earlier. Figure 23 shows corrected load line displacement vs. Load curves. FE analysis data matches fairly well with the corrected LLD vs. load test data. Figure 24 shows the variation of J-integral with load. JICvalue for 20MnMoNi55 is 100 kJ/m2 at -70°C. Predicted crack initiation load found to be
2675kN for this case which is lower than the maximum load applied (3007kN). But there is no crack growth detected in this case. Figure 25 and Figure 26 show the variation of load with the maximum principal strain along longitudinal and transverse direction respectively. Finite element analysis data show a good agreement with the test data for these parameters.
Figure 23 Load line displacement vs. load for specimen CRSZ11.
Figure 24 J integral vs. load for specimen CRSZ11.
Figure 25 Maximum principal strain vs. load along the longitudinal arm for specimen CRSZ11.
Figure 26 Maximum principal strain vs. load along the transverse arm for specimen CRSZ11.
Figure 27 CMOD vs. Load curves at center for specimen CRSZ21-A.
Figure 28 CMOD vs. Load curves 80 mm left from the center for specimen
CRSZ21-A.
Cruciform bend Specimen A at subzero temperature and biaxiality ratio two (CRSZ21-A)
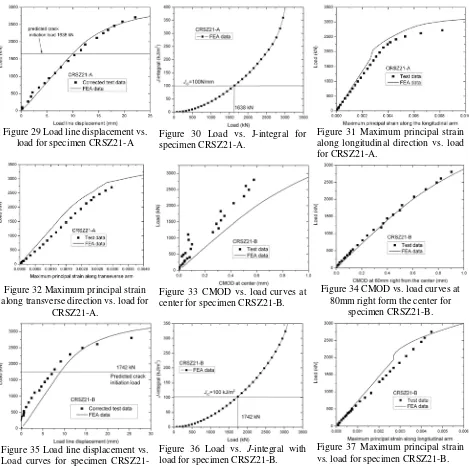
Figure 29 Load line displacement vs. load for specimen CRSZ21-A
Figure 30 Load vs. J-integral for specimen CRSZ21-A.
Figure 31 Maximum principal strain along longitudinal direction vs. load for CRSZ21-A.
Figure 32 Maximum principal strain along transverse direction vs. load for
CRSZ21-A.
Figure 33 CMOD vs. load curves at center for specimen CRSZ21-B.
Figure 34 CMOD vs. load curves at 80mm right form the center for
specimen CRSZ21-B.
Figure 35 Load line displacement vs. Load curves for specimen CRSZ21-B.
Figure 36 Load vs. J-integral with load for specimen CRSZ21-B.
Figure 37 Maximum principal strain vs. load for specimen CRSZ21-B.
Cruciform bend Specimen B at subzero temperature and biaxiality ratio two (CRSZ21-B)
The results of the FE analysis for specimen CRSZ21-B have been compared with the experimental data. Figure 33 and Figure 34 show the variation of load with CMOD. FE analysis results slightly differ from the test. Except for CMOD measurement at 80mm right from the center all CMOD measurement are inconsistent. Figure 33 shows one such CMOD data. Loading has been done only up to 2805 kN. Figure 35 shows load line displacement vs. load curves. The FE analysis data show a good agreement with the test data. Figure 36 shows the variation of J-integral with load. Crack initiation load for this case found out to be 1742kN which is less than the maximum load applied (2805kN). A crack growth of 0.2 mm has been observed in this case. Figure 37 and Figure 38 show the variation of load with the maximum principal strain along longitudinal and transverse direction respectively. Finite element analysis data show a good agreement with the test data for these parameters.
Figure 38 CMOD vs. Load curves at center for specimen CRRT10.
Figure 39 Load line displacement vs. Load curves for specimen CRRT10.
Figure 40 Variation load with maximum principal strain for
specimen CRRT10.
Figure 41 Variation J integral with load for specimen CRRT10.
Figure 42 CMOD vs. Load curves at center for specimen CRSZ10.
Figure 43 Load line displacement vs. load curves for specimen CRSZ10.
Figure 44 Variation load with maximum principal strain for specimen CRSZ10.
Figure 45 Variation J-integral with load for specimen CRSZ10.
Figure 46 variation of biaxiality ratio with J-integral.
Figure 47 Variation of q ahead of the center of crack-front.
Figure 48 variation of Anq with
J-integral.
Figure 49 variation of Anq with
Uniaxial testing at room temperature CRRT10
The results of the FE analysis for specimen CRRT10 have been compared with the experimental data. Figure 38 shows CMOD vs. load curves for test as well as from the FE analysis. CMOD is measured only at the centre of the crack.It is clear from the figure that the FE analysis results are matching very well with the test data. Loading has been done only up to 2715 kN. Figure 39 shows the corrected load line displacement vs. Load curves. FE analysis data show good agreement with the corrected test data. Figure 40 shows the variation of load with the maximum principal strain along longitudinal direction. Finite element analysis data show a good agreement with the test data for these test data. Figure 41 shows the variation of J-integral with load. Crack initiation load for this case found out to be 2300kN which is less than the maximum load applied (2715kN). A crack growth of 0.7 mm has been observed in this case.
Uniaxial testing at subzero temperature CRSZ10
The results of the FE analysis for specimen CRSZ10 have been compared with the experimental data. Figure 42 shows CMOD vs. load curves for test as well as from the FE analysis. CMOD is measured only at the centre of the crack. FE analysis results show a good agreement with the test data. Loading has been done only up to 2730 kN during the test. Figure 43 shows the corrected load line displacement vs. Load curves. FE analysis data show a good agreement with the corrected test data. . Figure 44 shows the variation of load with the maximum principal strain along longitudinal direction. Finite element analysis data show a good agreement with the test data for these test data. Figure 45 shows the variation of J-integral with load. Crack initiation load for this case has been predicted to be 1730 kN which is less than the maximum load applied (2730kN). A crack growth of 0.1mm has been observed in this case
EFFECT OF BIAXIALITY
Biaxiality ratio is ratio of the component of stress along longitudinal direction (σzz) to the component of the stress
along the transverse direction (σxx). Stresses have been found out by finite element analysis. For cruciform
specimens CRRT11 and CRSZ11, biaxiality ratio remains around unity throughout the loading. For cruciform specimens CRSZ21-A and CRSZ21-B, biaxial ratio changes with the load value. The biaxiality ratio remains around two at smaller load. At higher loads, the arms of the cruciform specimen start yielding. The smaller arms (longitudinal direction) takes more load hence they start to yield first and transfer some of the load to the longer arms (transverse arms). On further loading the longer arms also start yielding and biaxiality ratio tend to become unity. The variation of the biaxiality ratio with the J-integral is shown in Figure 46 for cruciform specimen CRSZ21-A. Biaxiality ratio remains around two up to J-integral value 100 kJ/m2 then it sharply falls and tends to unity. Value of JIC is 100 kJ/m2 at -70°C. A biaxiality ratio of two has been maintained till the onset of the crack-growth for
cruciform specimens for the -70°C tests. A biaxiality ratio of two is very difficult to maintain till the onset of crack-growth in a cruciform specimen at room temperature because the value of JIC is very high at room temperature (250
kJ/m2) hence both the specimens for biaxiality ratio two (CRSZ21-A and CRSZ21-B) have been tested at -70°C.
FE analyses for multiaxaility effect comparisons
Cruciform specimens, which have been tested, do not have exactly identical core geometry. The uniaxial specimens do not have the weld joints and they are made up of single material (20MnMoNi55). Its core is also different from the core of cruciform specimen for biaxial testing. It has longer crack length (430mm) and shallower crack depth (20mm) and do not have the slots in transverse direction. There is small difference in crack depth even among cores of the cruciform specimens for biaxial testing. Comparison of results of FE analyses for these specimens will be inconclusive. The FE models have already shown good agreement with the test data, which validates the FE model. To have a meaningful comparison, FE analyses have been performed on specimens having identical core geometry and material properties. Three FE models of cruciform specimens with identical cores (i.e. thickness of cores, crack lengths, crack depths and slot configuration are kept the same) have been analyzed. Material of arms is also kept the same for all models. First model, CRFE21 (FE stands for Finite Element), has the arm lengths similar to the
specimen CRSZ21-A to get a biaxiality ratio 2:1. Second model, CRFE11, has the arm lengths similar to CRSZ11 to get a biaxiality ratio 1:1. Third model, CRFE10 has arm lengths similar to CRSZ10 to get the uniaxial state of stress across the crack front. All the models of cruciform specimen (i.e. CRFE21, CRFE11 and CRFE10) have identical cores containing crack 320mm of length and 20mm of depth.
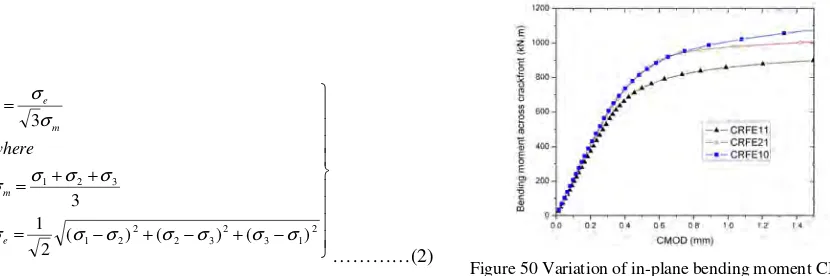
There are several parameters to quantify the crack tip constraint/stress triaxiality, such as the T-stress [7], Q -parameter [8], the multi-axiality quotient (q) [5], A2 parameter [9], etc. In this paper, the multi-axiality quotient (q) is
− + − + − = + + = = 2 1 3 2 3 2 2 2 1 3 2 1 ) ( ) ( ) ( 2 1 3 3 σ σ σ σ σ σ σ σ σ σ σ σ σ e m m e where q …………(2)
Figure 50 Variation of in-plane bending moment CMOD.
Where σe is the von Mises equivalent stress, σm is the hydrostatic stress and σ1, σ2 and σ3 are the principal stresses.
Multi-axiality quotient q defines the level of constrains ahead the crack tip. Small values of q calculated from this definition indicate high degree of multiaxiality. For q values at constant low level (q ~ 0.27) only very little or no stable crack extension can be expected [6]. Values of q can be calculated from finite element analysis results. The variation of q along the remaining ligament ahead of the center of crack front has been plotted at the onset of the crack growth for all three FE models in Figure 47. These calculations for q have been carried out when the value of applied J-integral is near JIC (100 kJ/m2) for all the cases. It can be seen that the values of q corresponding to the
CRFE11 are minimum among the three while the values of q corresponding to the uniaxial case CRFE10 are maximum throughout the length. Values of q corresponding model CRFE21 are falling in between. It can be concluded that the crack-front of CRFE11 (biaxiality ratio is 1:1) is the most constrain and crack front of CRFE10 is the least constrained. Microstructurally significant distance is the region between (J/σy) to (5J/σy) from the crack tip
[10]. Material degradation is most significant in this region. A modified parameter Anq [11] is proposed by Pavan
Kumar et al. Aq is calculated by integrating the variation of ‘q’ across the ligament over the distance (J/σy) to (5J/σy)
from the crack tip across the ligament (Equation 3)
∫
=
y y J J qqdx
A
σ σ / 5 / ………(3)Aq is then normalized to get Anq
∫
∫
=
y y y y J J c J J nqdx
q
qdx
A
σ σ σ σ / 5 / / 5 / ……….(4)Where qc is the critical value of multiaxiality quotient (qc = 0.27). Small values of Anq calculated from this definition
indicate a high degree of multiaxiality. Anq values have been evaluated for different loads. Figure 48 shows the
variation of Anq with J-integral. Values of Anq value has been found to be lowest for CRFE11 (biaxiality ratio 1:1)
and highest for CRFE10 (uniaxial 1:0) throughout the loading. Values of Anq values for CRFE21 have been found to
be lying in between. Value of Anq corresponds to applied J-integral 100 kJ/m2 for CRFE11 is 1.104, for CRFE21 it is
1.108 and for CRFE10 it is 1.123. This indicates the highest constraint level exists at crack front of CRFE11 and the least constraint level exists at the crack front of CRFE10. Figure 49 shows the variation of Anq with in plane bending
moment. A similar trend can be seen for values of Anq corresponding to the three models as seen in the previous
CONCLUSIONS
Six numbers of cruciform specimens have been tested at -70°C and room temperature with a biaxiality ratio 1:0, 2:1 and 1:1. Detailed 3D finite element analyses have been carried out for all the cases and various data such as CMOD, LLD, J-integral, strains along various directions have been computed. Finite element analyses results show a good agreement with the test data for most of the cases. It has been shown clearly by the FE analyses performed on three models CRFE11, CRFE21and CRFE10 (with identical core geometry and similar arm lengths as in specimens CRSZ11, CRSZ21A, and CRSZ10) that crack-front is most constrained in model CRFE11 with the biaxiality ratio 1:1 and the crack-front is least constrained for uniaxial model CRFE10 with help of multiaxiality quotient q and Anq.
Constraint level across the crack-front of the model CRFE21 with biaxiality ratio 2:1 is found to lie between the two extremes. It has also been shown that the in-plane bending moment required for extension of crack is lowest for most constrained model (CRFE11) with biaxiality ratio 1:1 and it is highest for least constrained model (CRFE10) with biaxiality ratio 1:0.
REFERENCES
[1] W J. McAfee, B R. Brass, J W. Bryson. Jr. W E. Pennell, “Biaxial loading effects on fracture toughness of reactor pressure vessel steel” NUREG/CR-6273.
[2] J McAfee WJ, Bryson JW. “Test and analysis of unclad finite-length flaw cruciform specimens.” USNRC Report NUREG/CR-4219 (ORNL/TM9593/V12&NI), 1996:25-31
[3] Pennell WE, “Corwin WR Reactor pressure vessel Structural integrity research.” Nucl. Eng DES, 1995;157: pp.159-175
[4] S. R. Kalidindi, A. Abusafieh and E. EI-Danaf, “Accurate Characterization of Machine Compliance for Simple Compression Testing,” Experimental Mechanics Vol. 37, No. 2, June 1997. pp210-215
[5] Clausmeyer H, Kussmaul K, Roos E. “Influence of stress state on the failure behaviour of cracked components made of steel.” ASME, Appl Mech Rev 1991, 44(2): pp. 77–92.
[6] E. Roos, U. Eisele and H. Silcher, “Effect of stress state on the ductile fracture behaviour of large-scale specimens, constraint effects in fracture”, in E.M. Hackett, K.-H. Schwalbe and R.H. Dodds (eds.), ASTM STP 1171, ASTM, Philadelphia, PA, 1993, pp. 41-63.
[7] C. Betegon and J.W. Hancock, “Two parameter characteristics of elastic–plastic crack-tip fields”, J Appl Mech
58 (1991), pp. 104–110.
[8] N.P. O'Dowd and C.F. Shih, “Family of crack tip fields characterized by a triaxiality parameter—I: Structure of fields”, J Mech Phys Solids 39 (1991), pp. 898–1015.
[9] Y.J. Chao and W. Ji, Cleavage fracture quantified by J and A2, Constraint effects in fracture theory and
applications: vol. II, ASTM STP 1244, American Society for Testing and Materials, Philadelphia (1995) pp. 3– 20.
[10] J. Herrens and D.T. Read, “Fracture behavior of a pressure vessel steel in the ductile to brittle transition region”, NISTIR 88-3099, National Institute for Standards and Technology, Boulder (1988).