1
Detailed Cache Coherence Characterization for OpenMP Benchmarks
Anita Nagarajan, Jaydeep Marathe, Frank Mueller
Dept. of Computer Science, North Carolina State University, Raleigh, NC 27695-7534
[email protected], phone: (919) 515-7889
Abstract
Past work on studying cache coherence in shared-memory symmetric multiprocessors (SMPs) concentrates on studying aggregate events, often from an architecture point of view. However, this approach provides insufficient infor-mation about the exact sources of inefficiencies in paral-lel applications. For SMPs in contemporary clusters, ap-plication performance is impacted by the pattern of shared memory usage, and it becomes essential to understand co-herence behavior in terms of the application program con-structs — such as data structures and source code lines.
The technical contributions of this work are as follows. We introduce ccSIM, a cache-coherent memory simulator fed by data traces obtained through on-the-fly dynamic binary rewriting of OpenMP benchmarks executing on a Power3 SMP node. We explore the degrees of freedom in interleaving data traces from the different processors and assess the simulation accuracy by comparing with hard-ware performance counters. The novelty of ccSIM lies in its ability to relate coherence traffic — specifically coher-ence misses as well as their progenitor invalidations — to data structures and to their reference locations in the source program, thereby facilitating the detection of inefficiencies. Our experiments demonstrate that (a) cache coherence traf-fic is simulated accurately for SPMD programming styles as its invalidation traffic closely matches the corresponding hardware performance counters, (b) we derive detailed co-herence information indicating the location of invalidations in the application code, i.e, source line and data structures and (c) we illustrate opportunities for optimizations from these details. By exploiting these unique features of ccSim, we were able to identify and locate opportunities for pro-gram transformations, including interactions with OpenMP constructs, resulting in both significantly decreased coher-ence misses and savings of up to 73% in wall-clock execu-tion time for several real-world benchmarks.
1. Introduction
Prior work on cache coherence concentrates on two ar-eas: simulation and performance tuning. Many architec-tural and system simulators support different coherence
This work was supported in part by NSF CAREER grant CCR-0237570.
models in their implementation (e.g., [6], [13], [26], [24], [2], [7]), and they operate at different abstraction levels ranging from cycle-accuracy over instruction-level to the operating system interface. On the performance tuning end, work mostly concentrates on program analysis to derive op-timized code (e.g., [15], [27]). Recent processor support for performance counters opens new opportunities to study the effect of applications on architectures with the potential to complement them with per-reference statistics obtained by simulation.
In this paper, we concentrate on cache coherence simu-lation without cycle accuracy or even instruction-level sim-ulation. We constrain ourselves to an SPMD programming paradigm on dedicated SMPs. Specifically, we assume the absence of workload sharing, i.e., only one application runs on a node, and we enforce a one-to-one mapping between threads and processors. These assumptions are common for high-performance scientific computing [29], [30].
We make the following contributions in the paper. We have designed and implemented ccSIM, a cache-coherent simulator. We demonstrate good correlation between cc-SIM results and hardware performance counters for a 4-way Power3 SMP node on a variety of OpenMP benchmarks. We obtain address traces per processor through dynamic bi-nary rewriting. We demonstrate that ccSIM obtains detailed information indicating causes of invalidations and relates these events to their program location and data structures. This enables us to detect coherence bottlenecks and allows us to infer opportunities for optimizations.
The paper is structured as follows. We introduce the in-strumentation framework METRIC that is utilized to ob-tain data traces. We then provide details on the design and implementation of ccSIM, the cache coherence simulator. Next, we describe the experimental methodology followed by simulation results as well as performance counter mea-surements. From these results, we derive opportunities for code transformations and assess their benefits. We conclude with related work and a summary of our contributions.
2. Framework Overview
ac-Statistics Tracefile1
Binary Application
Statistics TracefileN
Expander2
Tracefile2 Statistics
shared bus
cache1
... ... ... ...
ExpanderN
compressed traces decompressors ccSIM
uniproc.
uniproc.
uniproc. cache2
cacheN Expander1
METRIC
Fig. 1. Overview of Framework
tual application executions and a cache simulator that con-sumes these traces to simulate coherence traffic.
The instrumentation tool uses dynamic binary rewriting to instrument a running application. Memory accesses are instrumented to emit address reference information, includ-ing the relation of a reference to its source line in the pro-gram [20]. This information is compressed on-the-fly to conserve space before it is written to storage. Notice that the instrumentation does not affect the trace data, i.e., we col-lect the original trace addresses (even though performance is perturbed by the instrumentation). Later comparisons with performance counters are based on the uninstrumented application to ensure that the same work is being performed and instrumentation is excluded in the measurements.
The trace of each thread comprises the input to a unipro-cessor cache hierarchy. Each cache hierarchy (correspond-ing to a separate processor) emits coherence messages on a shared bus according to the selected coherence protocol. Events, such as invalidation messages and cache misses, are being logged in the simulator and associated with source data structures as well as instruction locations in source files as they occur. This allows the generation of detailed statis-tics on a per-reference base with regard to invalidations, re-sulting misses and data subsequently evicted from cache.
3. Instrumentation and Trace Generation
Cache simulation for SMPs is based on address traces collected by METRIC, our framework for dynamic binary instrumentation of memory references [20]. METRIC in-serts probes through a control program into an executing application to generate highly compressed address traces.
The process of dynamic binary rewriting operates as fol-lows. A control program instruments the target OpenMP application executable using our customized extensions of the DynInst binary rewriting API [4]. These customizations, part of the METRIC framework, have been further extended to capture traces of OpenMP threads for this work. For each OpenMP thread, the memory access points (i.e., the loads and stores) are instrumented to capture the applica-tion access trace. To reduce the overhead on target execu-tion, METRIC can trade off simulation accuracy for tracing
speed by instrumenting only floating point or integer ac-cesses. It also allows certain accesses such as local stack accesses to be ignored, since they often do not perceptibly affect the overall access metrics of the target program.
Once the instrumentation is complete, the target is al-lowed to continue. The trace logging of the access stream of each OpenMP thread proceeds in parallel without inter-action with other OpenMP threads, thus increasing the trac-ing speed. For each thread, the instrumentation code calls handler functions in a shared library. The handler functions compress the generated trace online and write the com-pressed trace to stable storage.
For each thread, the accesses generated are compressed using the compression primitives described in our previ-ous work [20]. Each compression primitive has a unique sequence id field, which is globally unique for that thread, and anchors the compression primitive in the overall access stream for that thread. OpenMP supports SMP paral-lelism via compiler directives (#pragma ompor!$OMP). We instrument the compiler-generated functions imple-menting these directives.
4. ccSIM: A Multi-Processor Cache Simulator
The compressed access trace generated from the instru-mented OpenMP application is used for incremental multi-processor memory hierarchy simulation. We have designed and implemented a memory access simulator for cache co-herent shared-memory multiprocessor systems. The unipro-cessor components were derived from MHSim [23].
4.1 Interleaving of Reference Streams
During application execution, the actual interleaving of data references is non-deterministic between synchroniza-tion points. However, at synchronizasynchroniza-tion points, such as barriers, threads are guaranteed to eventually reach a certain point of execution within the program. We study the effect of different reference interleavings by supporting two sim-ulation modes. Recall that each OpenMP thread is assumed to be executing on a separate processor. Hence, every driver object maps to a unique processor on an SMP node.
ccSIM implements the semantics of OpenMP constructs that affect the execution order of threads at synchronization points, i.e., barriers, critical sections, atomic sections and accesses protected by explicit mutex locks (omp get lock,omp set lock). Entry and exit events for these constructs are recorded in the trace for each thread. We refer to the program code between two synchroniza-tion points in an SPMD model as a region. At the start of a region, the simulator can operate in one of two modes. Interleaved Mode: The simulator processes one data
refer-ence from each trace (corresponding to a thread or pro-cessor) before processing the second reference for each trace etc. Effectively, the simulator enforces a fine-grained interleaving in a round-robin fashion on a per-reference base in this mode.
Piped Mode: The simulator processes all data references from one trace up to the next synchronization point be-fore processing data references from the second trace etc., effectively enforcing a coarse-grained interleaving at the level of regions.
A comparison of results from the interleaved and piped modes reflects the extent to which program latency is affected by the non-deterministic order of execution of OpenMP threads and may provide extremes (bounds) on metrics for coherence traffic.
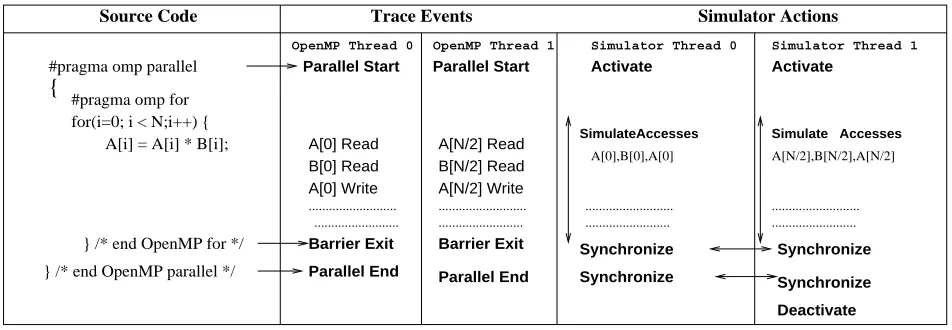
Example: Figure 2 shows the trace events and simula-tor actions for a simple OpenMP program with two active OpenMP threads.AandBare shared arrays of size N, andi is a local variable. Static loop scheduling is assumed for the OpenMP forloop. The entry into the parallel OpenMP region is logged as a trace event and causes the simula-tor to activate two driver objects. Accesses generated by each OpenMP thread to theAandBarrays are logged sep-arately. The drivers may simulate these accesses in paral-lel, as shown for the interleaved mode. When an OpenMP thread exits from the implicit barrier at the end of thefor loop, a barrier exitevent is logged for that thread. Detection of a barrier event causes drivers to synchronize. Another synchronization takes place when theparallel endevent is processed. After an OpenMP parallel region, a serial phase starts, and only one driver (corresponding to the master thread) will remain active. All others remain unused till the start of the next parallel phase.
y_Write y_Read Region
sync point sync point
x_Write x_Read
across−region
in−region
Fig. 3. Classification of Invalidations For each thread, the address of the memory access is mapped to the unique machine instruction location that gen-erated that access. The access address is also mapped to the language-level data structure to which it belongs. These mappings allow us to tag cache access and coherence statis-tics with higher level abstractions, such as line numbers and source code data structure identifiers.
4.2 Studying Invalidations and Misses
A key metric for the identification of memory perfor-mance bottlenecks in a multiprocessor system is the number of invalidations to lines in the lowermost level of cache of each processor. This is a major source of coherence traffic, potentially causing the shared bus to be a bottleneck in a symmetric multiprocessor architecture. More significantly, these invalidations could lead to coherence misses, thus in-creasing memory latency. It is these invalidation misses that we focus on in our experiments since an increasing num-ber of invalidations leading to coherence misses can greatly hamper performance.
Since the main motivation in reducing the invalidate traf-fic is to decrease the number of coherence misses, it is imperative to distinguish between coherence misses and uniprocessor misses in a processor. Invalidations to cache lines can further be classified as true-sharing invalidations and false-sharing invalidations in each level of cache. True-sharing invalidations arise from accesses to the same shared memory location by more than one processor, with at least one access being a write access. False-sharing invalidations are caused due to accesses to different memory locations that map to the same cache line on more than one proces-sor. This level of classification gives a better view of the causes of the invalidations, which helps in determining the applicability of various techniques for optimizations.
With respect to OpenMP parallel programs, another level of classification can be introduced, which is instrumental in determining the feasibility of using certain optimization techniques to reduce the coherence traffic. This involves determining whether the invalidations to cache lines oc-cur due to references across synchronization points or be-tween synchronization points in a parallel program (Figure 3). References across processors leading to true sharing in-validations within a region can be distinguished as follows: References not protected by locks: These typically oc-cur in the single-writer, single/multiple-reader scenario where one processor writes to a common location and one or more processors read from it.
OpenMP Thread 0 OpenMP Thread 1 Parallel Start Parallel Start
Simulator Thread 0 Simulator Thread 1
Activate Activate
{
Source Code Trace Events Simulator Actions
#pragma omp parallel
#pragma omp for for(i=0; i < N;i++) {
A[i] = A[i] * B[i]; A[0] Read B[0] Read A[0] Write
A[N/2] Read B[N/2] Read A[N/2] Write
Accesses Simulate
A[0],B[0],A[0]
... ... ...
...
Simulate Accesses
A[N/2],B[N/2],A[N/2]
...
} /* end OpenMP for */ Barrier Exit Barrier Exit Synchronize Synchronize
Synchronize Synchronize
Parallel End Parallel End
} /* end OpenMP parallel */
Deactivate ...
...
...
Fig. 2. Illustration: Trace Events and Simulator Actions
in the multiple-writer, single/multiple-reader scenario where multiple processors write and read from a com-mon location.
In addition to these metrics, the simulator also generates per-processor statistics for hits, misses, temporal and spatial locality, and eviction-related information.
For each of the above-mentioned metrics, aggregate num-bers for the application help in an overall analysis of the ob-served performance. A further breakdown of these statistics for each reference or for each data structure in the program provides deeper insight into the behavior of the application. Statistics are computed for each of the globally shared data structures in order to provide information at a greater level of detail and to determine the exact causes of inefficiencies in the memory hierarchy. This enables us to pinpoint the data structures contributing to latency caused by coherence misses. A detailed analysis of the compiled metrics helps in determining the particular choice of optimization tech-niques for a benchmark.
5. Experiments
First, we present the OpenMP benchmarks used for ex-periments with ccSIM. Next, we discuss ccSIM comparison with hardware performance counters. We then use ccSIM to characterize the shared memory usage of representative OpenMP benchmarks and show how ccSIM statistics are useful in detecting and isolating coherence bottlenecks.
Benchmarks: We selected 7 OpenMP benchmarks for our experiments. Out of these -IS,MG,CG,FT,SPandBT are from the NAS OpenMP benchmark suite [14]. NBFis a part of GROMOS[12]. A brief description of each bench-mark is given below.
1. IS: A large integer sort used in “particle method” codes. 2. MG: A V-cycle MultiGrid method to compute the
solu-tion of the 3-D scalar Poisson equasolu-tion.
3. CG: A Conjugate Gradient method to compute an ap-proximation to the smallest eigenvalue of a large, sparse, unstructured matrix.
4. FT: An implementation of a 3-D Fast Fourier Transform (FFT)-based spectral method.
5. SP: A simulated CFD application with scalar pentago-nal bands of linear equations that are solved sequentially along each dimension.
6. BT: A simulated CFD application with block tridiago-nal systems of 5x5 blocks solved sequentially along each dimension.
7. NBF (Non-Bonded Force Kernel): A molecular dy-namics simulation computing non-bonded forces due to molecular interactions.
Comparison with Hardware Counters: Next, we val-idate ccSIM against measurements from hardware perfor-mance counters. From a developer’s perspective, the num-ber of coherence misses is the most important facet of the shared memory access pattern of an application. However, there are no hardware counters capable of measuring coher-ence misses on our target platform. Instead, we compare the number of invalidations for ccSIM against the actual number of invalidations measured by the hardware coun-ters. The total number of invalidations is an upper bound on the number of coherence misses for the application. Reduc-ing invalidations will also lower the number of coherence misses, thereby improving application performance.
Hardware Environment: The hardware counter mea-surements were carried out on a single 8-way node of a 4-way Power3 SMP node. The hardware coun-ters were accessed through the proprietary Hardware Performance Monitor (HPM)API. The system has a 64 KB 128-way associative L1 cache with round-robin replacement and an 8 MB 4-way associative L2 cache. All experiments were carried out with 4 active OpenMP threads bound to distinct processors. The IBM OpenMP compilers, xlc r and xlf r, were used to compile the benchmarks at the default optimization level O2 with following flags settings:
-qarch=auto, -qsmp=omp, -qnosave.
ThePM SNOOP L2 E OR S TO IandPM SNOOP M TO I HPM events were used to measure the number of L2 cache invalidations with E
I, S
I and M
I transitions, respec-tively. The OpenMP runtime system also contributes to the number of invalidations measured. Since we are interested only in the invalidations of the application, we need to re-move these invalidations from the measured numbers.
To assess the side-effect of the OpenMP runtime system on invalidations, we measured invalidations for OpenMP runtime constructs with empty bodies in a set of mi-crobenchmarks. For example, the overhead in terms of in-validations for a barrier construct was determined. The mi-crobenchmarks were subsequently used to adjust raw HPM data obtained from application runs by removing the extrap-olated effect of OpenMP runtime invalidations for
itera-tions. For example, we removed the effect of times
the overhead for a single barrier if the benchmark contained 100 barriers. We refer to these measurements as the raw HPM metrics and the OpenMP-adjusted HPM metrics.
Table I shows the raw and OpenMP-adjusted HPM mea-sured invalidations for the L2 cache. The invalidations were measured for each processor separately using the HPM events discussed above and summed up to get the total in-validations shown in the table. Each HPM measurement is the mean of 5 samples.
TABLE I. Total L2 invalidations with HPM Benchmark HPM(raw) HPM(OpenMP-adjusted)
IS 165246 162964
MG 24631 13629
CG 134964 100488
FT 326595 325257
SP 282269 258923
BT 185317 157384
NBF 474121 135926
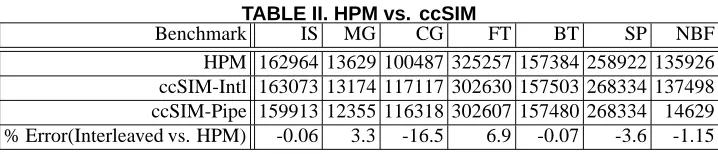
Comparison with ccSIM: ccSIM was configured with the MESI coherence protocol and with the cache parameters of the hardware platform (4-way Power3 SMP node). Both L1 and L2 caches were simulated. Table II compares total L2 invalidations for HPM and the two ccSIM modes - piped and interleaved.
The results indicate a good correlation between ccSIM and HPM for most benchmarks. The absolute error be-tween ccSIM and HPM is less than 17% for all benchmarks and less than 7% for most. Moreover, for the NAS bench-marks, both interleaved and piped modes result in closely matching numbers of invalidations. This indicates that for these benchmarks, fine-grained round-robin simulation is not necessary to achieve a high level of simulation accu-racy. NBF stands out as an anomalous case with signif-icant difference between the interleaved and piped modes of simulation. ccSIM allows us to categorize invalida-tions into true and false sharing invalidainvalida-tions as well as to distinguish between across-region and in-region
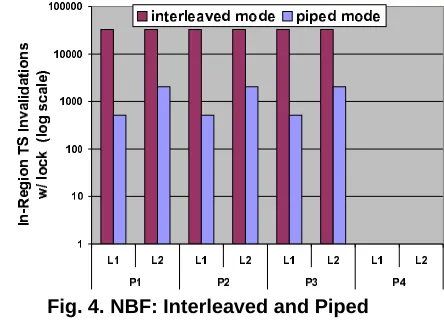
inval-idations, as explained in Section 4.2. The cause of the discrepancy becomes apparent when we examine the in-region true-sharing critical invalidations shown in Figure 4. Metrics are plotted in a log scale. The number of true-share invalidations occurring within a region is much higher (at least an order of magnitude) in the interleaved simulation mode. The interleaved simulation mode in-volves fine-grained round-robin simulation, which leads to “ping-ponging” of shared data across processors. Ping-ponging does not take place with the piped mode of sim-ulation, leading to a very small number of invalidations to be recorded. A look at the per-reference ccSIM statistics in-deed shows that the most significant invalidation source is a data access point inside an OpenMPcriticalconstruct. This demonstrates the necessity of interleaved simulations for codes containing critical sections to closely resemble the interleaving of references during actual execution. Next, let us consider the detailed results for two benchmarks and gen-eral trends for the benchmark suite.
Fig. 4. NBF: Interleaved and Piped
6. Characterization of Benchmarks
Our simulation results are not only accurate with respect to actual executions, we also obtain detailed classifications indicating the cause of invalidations as well as the corre-sponding location in the program. Due to space limitations, we discuss only MG and NBF. The former is representative in large for any of the first six benchmarks while the latter has a unique coherence footprint, which indicates room for optimizations subsequently discussed.
6.1 MG and General Trends
TABLE II. HPM vs. ccSIM
Benchmark IS MG CG FT BT SP NBF
HPM 162964 13629 100487 325257 157384 258922 135926 ccSIM-Intl 163073 13174 117117 302630 157503 268334 137498 ccSIM-Pipe 159913 12355 116318 302607 157480 268334 14629 % Error(Interleaved vs. HPM) -0.06 3.3 -16.5 6.9 -0.07 -3.6 -1.15
are typically due to imbalanced sharing of data across shar-ing boundaries, such as in stencil problems and grid-based calculations. Inner processors have more neighbors result-ing in larger number of invalidations. Hence, the number of invalidations depicted in Figure 5(b) is higher in proces-sors two and three since this metric amplifies these vari-ations. Detailed access simulation by ccSIM also allows us to distinguish the cause of invalidations as true-sharing and false-sharing invalidations, shown in Figure 5(b). Inter-estingly, a significant fraction of the total invalidations are false-sharing invalidations. Within these classes, we can further determine whether invalidations resulted from two references crossing a synchronization point (across multi-ple regions) or not (within a synchronization region), de-picted in Figure 5(c). True-sharing invalidations mainly arise from references occurring across regions. A majority of the false-sharing invalidations also occur across region boundaries. We can further classify in-region invalidations into two classes: Those due to references within a critical section (while holding a lock) and those outside of critical sections (without holding a lock). Figure 5(d) indicates that only an insignificant number of in-region true-sharing inval-idations occur, and these invalinval-idations are due to accesses without locks. (While this metric is not indicative for MG, it is significant for NBF discussed in the following and de-picted for symmetry.) Finally, not all invalidations may lead to subsequent misses, but ccSIM allows us to determine if an invalidate is followed by a miss, as depicted in Figure 5(e). The percentage of invalidations leading to misses is significant (around 50–70%) in the L1 cache and very high (approximately 95%) in the L2 cache.
For the other benchmarks, with the exception of NBF, we observe similar trends in the ratio between total misses and coherence misses and the ratio between L1 and L2 misses. We find that a significant fraction of invalidations are false-sharing invalidations, a majority of which cross re-gion boundaries. Most true-sharing invalidations also cross region boundaries. Finally, a large portion of invalidations, particularly in L2, will subsequently result in a coherence miss. Hence, the results discussed for MG are representa-tive for the other benchmarks as well – with the exception of NBF discussed in the following.
6.2 NBF: Non-Bonded Force Kernel
Figures 6(a) to 6(e) represent the results obtained from ccSIM by simulated execution of this benchmark. NBF contains a critical section with updates of shared data inside
a parallel region. From figure 6(a), we observe that a signif-icant percentage of misses in L1 and L2 caches are coher-ence misses. Almost all invalidations are true-sharing inval-idations in both the L1 and L2 caches, except for processor 4 (Figure 6(b)) where false-sharing invalidations dominate. This is an artifact of the order of access scheduling in the fine-grained round-robin ccSIM simulation. As we shall see in the next section, almost all invalidations occur in a loop updating a global shared array, executed by every proces-sor. Since the processors are ordered by their logical ids, the array element written to by processor-1 is different from the element accessed by processor-4 in the last iteration, but they are adjacent in the L1/L2 cache line. This causes the resulting invalidation (since processor-1 is writing) to be classified as a false-sharing invalidation for processor-4’s caches. In an execution with non-deterministic ordering, these false sharing invalidations will still occur but will be distributed evenly over the caches of all processors. Fig-ure 6(c) shows that almost all of the true-sharing invali-dations take place within regions. Locks protect the ref-erences that cause true-sharing invalidations within regions (see Figure 6(d)). This observation is central to the oppor-tunities for optimizations discussed in the next section. An important characteristic is the percentage of invalidations resulting in coherence misses, shown in Figure 6(e). We see that more than 95% of the invalidations subsequently caused a coherence miss. The coherence results obtained for NBF indicate opportunities for optimizations with re-spect to in-region true-sharing with locks (critical sections), but only more detailed simulation can provide conclusive information to determine beneficial transformations, as dis-cussed in the following.
7. Opportunities for Transformations
In this section, we demonstrate how ccSIM can be used to detect and isolate coherence traffic bottlenecks, and we derive opportunities for transformations leading to reduced coherence traffic and, thereby, potential performance gains.
7.1 NBF: Non-Bonded Force Kernel
We first discuss the NBF kernel described in the previous section. A full access trace was obtained for the OpenMP NBF kernel. The OpenMP environment was set to four threads and static scheduling (OMP NUM THREADS = 4, OMP SCHEDULE STATIC).
(a) MG: Misses
(b) MG: Invalidations
(c) MG: Region-wise Classifi cation of Invalidations
(d) MG: In-Region True-Sharing Invalidations
(e) MG: Invalidations causing Misses Fig. 5. Results for MG
(a) NBF: Misses
(b) NBF: Invalidations
(c) NBF: Region-wise Classifi cation of Invalidations
(d) NBF: In-Region True-Sharing Invalidations
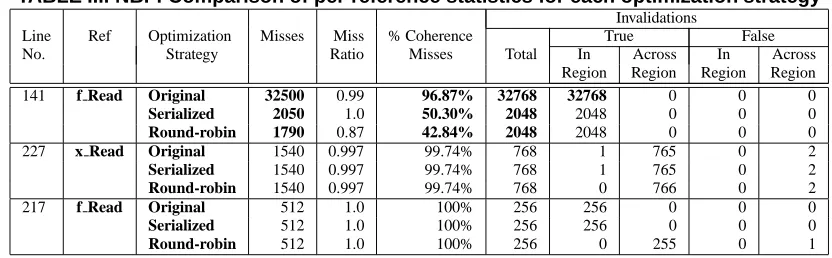
TABLE III. NBF: Comparison of per-reference statistics for each optimization strategy Invalidations
Line Ref Optimization Misses Miss % Coherence True False No. Strategy Ratio Misses Total In Across In Across
Region Region Region Region
141 f Read Original 32500 0.99 96.87% 32768 32768 0 0 0
Serialized 2050 1.0 50.30% 2048 2048 0 0 0
Round-robin 1790 0.87 42.84% 2048 2048 0 0 0
227 x Read Original 1540 0.997 99.74% 768 1 765 0 2
Serialized 1540 0.997 99.74% 768 1 765 0 2
Round-robin 1540 0.997 99.74% 768 0 766 0 2
217 f Read Original 512 1.0 100% 256 256 0 0 0
Serialized 512 1.0 100% 256 256 0 0 0
Round-robin 512 1.0 100% 256 0 255 0 1
for each processor obtained by ccSIM.
We observe that almost all L2 misses and a significant number of L1 misses are coherence misses. A coherence miss is caused when a processor accesses a cache line that was invalidated due to a write from another processor. How-ever, a large number of invalidations does not necessarily imply a large number of coherence misses, since the inval-idated cache lines may not be referenced by the processor again before being flushed out of the cache. The breakup of invalidations in Figure 6(e) shows that a significant number of invalidations resulted in coherence misses, especially in the L2 cache. This indicates that minimizing the total num-ber of invalidations will reduce the magnitude of coherence misses correspondingly.
We have detected that a coherence bottleneck exists. We can use the per-reference coherence and cache statistics generated by ccSIM to determine the cause of the bottle-neck. Table III shows the per-reference statistics on proces-sor one for the top three references of the original code and two optimization strategies (serialized and round-robin) dis-cussed in the following. Only L2 cache statistics are shown. We observe that access metrics across all processors are uniform. Thef Readreference on line141of the source code has an exceptionally high miss rate in all processors. Moreover, more than 96% of the misses for this reference are coherence misses. The invalidation data shows that the large number of in-region invalidations are the primary cause for these misses. The relation of this reference to the source code indicates that line 141 is of interest:
#pragma omp parallel ...
for (i = 0; i < natoms; i++) { #pragma omp critical
141: [i] = f[i] + flocal[i]; }
The for loop updates the global shared arrayfwith val-ues from the local private copyflocalfor each OpenMP thread. The large number of invalidations attributed to the f Readreference is due to the ping-ponging of the shared farray between processors as all of them try to update the globalfarray simultaneously.
Optimizing Transformations: Using ccSIM’s
per-reference statistics, we isolated the coherence bottleneck to
the updates of the shared global arrayf. We shall discuss two ways of reducing the number of coherence misses. One method eliminates the ping-ponging of thefarray by seri-alizing the updates to the arrayfsince they require mutu-ally exclusive writes. This is achieved by moving the criti-cal section to encompass the entireforloop instead of the single update. The modified code is shown below.
#pragma omp parallel ...
#pragma omp critical
for(i = 0; i < natoms; i++) { f[i] = f[i] + flocal[i]; }
Moving thecriticalstatement outside the loop also reduces the number of times that the mutual exclusion re-gion must be entered and exited, decreasing the execution overhead.
Although reducing the number of coherence misses, this method does not exploit the potential for parallel updates to separate parts of the farray by different threads. Hence, we consider an alternate transformation. We can exploit parallelism by partitioning the arrayfinto a number of ments. Each thread updates a distinct segment until all seg-ments are updated. We call this scheme the round-robin up-date scheme. The modified code is shown below as pseudo-code.
i=0;
for each thread {
1. segment_number = i + thread_id; 2. update segment
3. synchronize w/ other threads (barrier) 4. i = (i+1) MOD max_segments
}//run till all segments are updated
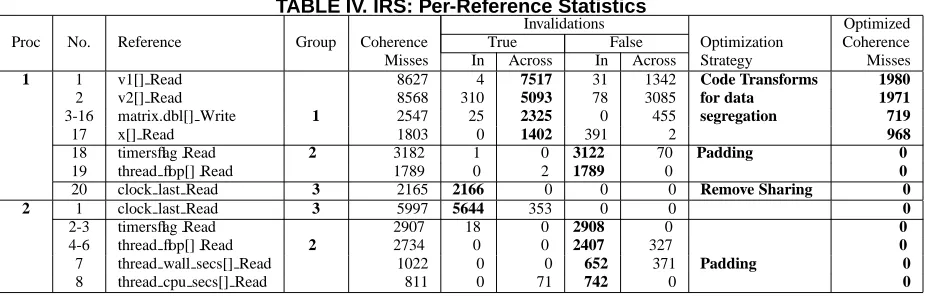
TABLE IV. IRS: Per-Reference Statistics
Invalidations Optimized Proc No. Reference Group Coherence True False Optimization Coherence Misses In Across In Across Strategy Misses
1 1 v1[] Read 8627 4 7517 31 1342 Code Transforms 1980
2 v2[] Read 8568 310 5093 78 3085 for data 1971
3-16 matrix.dbl[] Write 1 2547 25 2325 0 455 segregation 719
17 x[] Read 1803 0 1402 391 2 968
18 timersflag Read 2 3182 1 0 3122 70 Padding 0
19 thread flop[] Read 1789 0 2 1789 0 0
20 clock last Read 3 2165 2166 0 0 0 Remove Sharing 0
2 1 clock last Read 3 5997 5644 353 0 0 0
2-3 timersflag Read 2907 18 0 2908 0 0
4-6 thread flop[] Read 2 2734 0 0 2407 327 0
7 thread wall secs[] Read 1022 0 0 652 371 Padding 0
8 thread cpu secs[] Read 811 0 71 742 0 0
confirms that the actual number of invalidations occurring in the hardware indeed decreases by an order of magnitude for the serialized and round-robin schemes over the original program.
TABLE V. NBF: Wall clock Times (Seconds) Code Original Serialized Round-robin Segment
f-Update 4.981 0.003 (99.9%) 0.003 (99.9%) Other 2.141 2.076 (3%) 2.190 (-2.28%) Overall 7.122 2.079 (70.8%) 2.193 (69.2%)
TABLE VI. NBF: L2 Invalidations (HPM raw) Code Original Serialized Round-robin Segment
f-Update 503654 921 6209
Other 37987 32916 38863
Overall 541641 33837 45072
7.2 IRS: Implicit Radiation Solver
IRS-1.4 is part of the ASCI Purple codes [1]. IRS can use MPI, OpenMP or a mixture of both for paral-lelization. We use the pure OpenMP version of IRS for our study. Existing OpenMP parallelization uses “omp parallel do” constructs for loop level parallelization. For the analysis below, we ran IRS for 10 calls to the top-levelxirsfunction, with a limited data set (NDOMS=10, ZONES PER SIDE=NDOMS PER SIDE) with 4 OpenMP threads and static scheduling. This partial data trace is comparatively small, yet captures essential coherence traf-fic. Once our optimizations are complete, we compare the wall-clock time for the recommended full-sized data set for IRS (zrad.008.seq).
Analysis: Figure 7 shows that for all processors, coher-ence misses constitute almost the entire volume of L2 cache misses. Interestingly, the coherence miss magnitudes are asymmetric with processor-1 experiencing more than twice the number of coherence misses of any another processor. Table IV shows the per reference coherence statistics for processors 1 and 2. Statistics for other processors were sim-ilar to those for processor-2. References have been collected
into groups with distinct coherence characteristics (Groups 1, 2 and 3). Multiple references are shown with only a sin-gle representative reference. For example, there are a set of fourteen references to different arrays in the the matrix structure, all of which show similar coherence character-istics; these are represented by a single representative ref-erencematrix.dbl[]in the table. We observe that the the set of references with significant coherence behavior are quite different for processor-1 and processor-2. We shall now analyze references belonging to each group in detail.
Group 1: These references account for the largest frac-tion of coherence misses. True sharing across-region inval-idations are dominant for this group. This indicates that the data elements accessed by these references move across the L2 caches of multiple processors. Consider the first two references (v1[] andv2[]). These references occur in theicdotfunction, which is only called at three locations from theMatrixSolveCGfunction. All call sites are in serial code, i.e., they are executed only by the master thread. Between successive calls, the argument arrays are updated by other processors in parallel regions:
/* only master */ for (i =0; i nblk; i++)
dotprev += icdot(r[i], z[i],...); /* Reads r,z */ ...
/* parallel updates to r,z */ #pragma omp parallel for for (i =0; i nblk; i++)
setpz1( r[i],...); /* Writes to r */ setpz1(z[i],...); /* Writes to z */
...
/* only master */ for (i =0; i nblk; i++)
dotrz += icdot(r[iblk], z[iblk],...); /* Reads r,z */
TABLE VII. SMG: Per-Reference Statistics (Processor-1)
Invalidations Optimized No. Reference Group Coherence True False Optimization Coherence Misses In Across In Across Strategy Misses 1 rp[] Read 1 170046 0 0 156585 13387 Code Transforms 256
2 rp[] Read 83509 0 0 80145 3529 for coarse-level 0
3 rp[] Write 43640 0 0 43305 3373 interleaving 0
4 xp[] Write 23193 0 0 22309 1284 2764
5 num threads 2 44362 44929 0 0 0 Remove sharing 0
movement. More significantly,icdot calls now operate in parallel, which potentially has a much bigger impact on performance than the elimination of data movement alone.
Similar transformations are carried out for other refer-ences from Group-1, which we do not further discuss here.
Group 2: In-region false sharing invalidations constitute almost the entire volume of invalidations for these refer-ences. The number of coherence misses closely matches the number of invalidations received. All these references are related to timer routines used for performance bench-marking. Most of the coherence misses arise due to parallel updates to counter arrays indexed by thread id. Since array elements are contiguous, this leads to false-sharing, causing ping-ponging of cache lines across processors. We use intra data-structure padding to align individual array elements at cache line boundaries, which eliminates coherence misses.
Group 3: This group has a single reference exhibiting large volumes of true in-region invalidations. These invali-dations occur inside aomp criticalregion updating a shared global clock variable. We eliminate this sharing by maintaining clock variables for each thread separately.
Results: The coherence misses for each reference after optimization are shown in the last column of Table IV. We see that coherences misses for Groups 2 and 3 have been eliminated (by padding and sharing elimination, respec-tively) and have decreased significantly for Group 1. Figure 8 shows the wall-clock execution times for the different op-timization strategies on the recommended OpenMP data set. The readings were obtained on a non-interactive node with 8 OpenMP threads. DSegrepresents code transformations for data segregation (Group 1 references).DSeg+Crit
Fig. 7. IRS: Break-down of L2 misses
Fig. 8. IRS: Time w/ 4 Optimizations
ditionally removes the shared global clock (Group 3 refer-ence). DSeg+Crit+Paddingrepresents the fully opti-mized benchmark. We observe thatDSeg causes signifi-cant decrease in wall clock execution time (over 30%), com-pared to the original program. The performance impact is due to a combination of reduction in coherence traffic and the OpenMP parallelization on several serial code sections required for it.
7.3 SMG2000: Semi-coarsening Grid Solver
SMG2000 is part of the ASCI Purple codes [1]. The SMG code utilizes thehyprelibrary [10], which can se-lect between OpenMP and MPI parallelization. We use the default settings of SMG2000 for our analysis (10 x 10 x 10 grid, cx=cy=cx=1.0). We then compare the wall-clock execution time for the recommended full-sized workloads for different optimization strategies.
Analysis: For all processors, the L2 miss rate is quite high, ranging from 64% to 81%. Figure 9 shows that al-most all of the L2 misses are coherence misses. The per-reference statistics for the top 5 per-references from processor-1 are shown in Table VII. The statistics for other processors were similar to those of processor-1. As with IRS, we clas-sify references into groups based on coherence characteris-tics to facilitate analysis.
Fig. 9. SMG2000: Breakdown of L2 misses
loop nest. Each loop in the nest iterates over a single coor-dinate axis. The order of iteration is x,y,z from the inner to the outer loop. The function always chooses the largest dimension for parallelization, with the default being the in-nermost loop (x dimension). This results in fine-grained interleaving of thread accesses to adjacent array elements, resulting in large amounts of coherence traffic. To correct this, we hoist the OpenMP parallelization to the outermost loop (z dimension) ensuring that threads access data on dif-ferent cache lines.
Group 2: This group has a single store reference that exhibits large volumes of true-sharing in-region invali-dations. The data element referenced is a shared vari-able which is simultaneously updated by all threads with the number of runnable OpenMP threads, inside an omp parallelconstruct. We eliminate this sharing by replac-ing the omp parallelconstruct with separate calls to omp get max threads()in each thread.
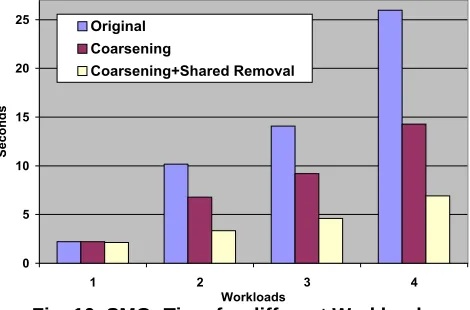
Results: The coherence misses after optimization are shown in the last column of Table VII. Our optimizations have eliminated almost all the coherence misses for these references. We compare the performance impact of our op-timizations on wall clock execution time for the following workloads, as recommended by the SMG2000 benchmark-ing criteria:
1. 35x35x35 grid, OpenMP threads=1 2. 35x35x70 grid, OpenMP threads=2 3. 35x70x70 grid, OpenMP threads=4 4. 70x70x70 grid, OpenMP threads=8
All workloads have processor configuration 1x1x1 (-P 1 1 1), cx=0.1, cy=1.0, cz=10.0. The workloads scale up the input grid size with increasing number of threads keeping the overall data processed per processor constant. Figure 10 compares the wall-clock times for the differ-ent workloads. Coarsening represents code transfor-mations for coarse-level interleaving of accesses (Group 1). Coarsening+Sharing Removaladditionally re-moves unnecessary shared data access (Group 2). We ob-serve that both optimizations have significant impact on
Fig. 10. SMG: Time for different Workloads
ecution time, with a maximum improvement of 73% for the 4th workload (8 OpenMP threads).
8. Related Work
There are several software-based and hardware-based approaches for memory performance characterization of shared memory multiprocessor systems. Gibson et al. pro-vides a good overview of the trade-offs of each approach [11]. At one end of the spectrum are complete software machine simulators. RSim is a simulator for ILP multi-processors with support for CC-NUMA architectures with a invalidation-based directory mapped coherence protocol [13]. SimOS is a complete machine simulator capable of booting commercial operating systems [26]. However, these frameworks simulate hardware and architecture state to a great detail, increasing simulation overhead. This lim-its the size of the programs and workloads that they can run. In contrast, ccSIM is an event-based simulator which simulates only memory hierarchies. Our instrumentation tool is flexible and allows us to collect partial traces of only the pertinent memory access. Thus, we can handle a much larger range of programs and workloads. More importantly, these simulators provide only bulk statistics intended for evaluating architecture mechanisms. In contrast, we aim at providing the application programmer with information on the shared-memory behavior of the program and correlate metrics to higher levels of abstraction, such as line numbers and source code data structures.
None of the above tools allow misses to be related to source code and data structures. Furthermore, our work differs in the fundamental approach of rewriting binaries, which is neither restricted to a special compiler or program-ming language, nor does it preclude the analysis of library routines. In addition, execution-driven simulators are often tied to one architecture due to the requirements of annotat-ing the code at assembly or object level. DynInst is avail-able on a number of architectures. Porting our framework to these platforms only involves changing the memory in-structions to be instrumented. Another major difference ad-dresses the overhead of large data traces inherent to all these approaches. We allow the analysis of partial traces and em-ploy trace compression to provide compact representations. The SIGMA (Simulator Infrastructure to Guide Memory Analysis) [9] system has many similarities with our work. It uses post-link binary instrumentation and online trace compression, and allows tagging of metrics to source code constructs. A toolkit by Marin and Mellor-Crummey uses statistical sampling of dynamically instrumented data trace points to predict memory behavior across different architec-tural platforms [21]. Both of these approaches are limited to uniprocessor systems while we focus on analyzing co-herence traffic for SMPs. The latter work does not focus on transformations, unlike our work.
Recently, most architectures have added hardware coun-ters, which provide information on the frequency of hard-ware events, e.g., to count shared memory events. Portable APIs like PAPI provide a reasonably platform-independent method of accessing these counters [3]. Hardware counters impose no runtime overhead, and querying counters is typ-ically of low overhead. However, they only provide aggre-gate statistics without any relation to the source code, and there are only a limited number of counters available. In ad-dition, there are often restrictions on the type of events that can be counted simultaneously. It is possible to get higher levels of information with customized hardware. The Flash-Point system uses a custom system node controller to mon-itor coherence events [11]. In general, hardware monmon-itors are fast but may constrain the number of events that can be monitored. At this point in time, they lack a wide accep-tance in practice.
Krishnamurthy and Yelick develop compiler analysis and optimization techniques for the shared-memory program-ming paradigm using SplitC as an example [15]. Their main concern is the hardware-supported coherence model, namely weak consistency. They are specifically concerned about writes and invalidations occurring out-of-order. Their optimizations reflect the constraints of reordering writes in the presence of locks and barriers with respect to weak consistency and employ message pipelining (aggregation of writes) and reduction of communication (two-way to one way or elimination). Satoh et al. study compiler optimiza-tions for OpenMP in a distributed shared memory system
based on dataflow techniques to analyze thread interactions [27]. Optimizations include barrier removal and data priva-tization to reduce coherence-induced messages. Our work shares the aim at optimizing shared-memory applications with these approaches. However, we take a radically differ-ent approach by analyzing traces to determine if and where inefficiencies in terms of coherence traffic exist and if there is room for improvements.
9. Conclusion
In this paper, we introduced ccSIM, a cache-coherent memory simulator fed by data traces obtained via on-the-fly dynamic binary rewriting of OpenMP benchmarks exe-cuting on a Power3 SMP node. We explored the degrees of freedom in interleaving data traces from the different processors with respect to simulation accuracy compared to hardware performance counters. We also provided detailed coherence information per data reference and relate them to their data structures and reference locations in the code.
The experiments conducted by us show close matches of hardware performance counters for coherence events. Fur-thermore, we demonstrated the feasibility and the benefits of deriving detailed coherence information indicating the location of invalidations in the application code. This de-tailed level of information allowed us to infer opportuni-ties for optimizations that, without ccSim, could not easily be obtained and localized. This led to program transfor-mations resulting in both significantly decreased coherence traffic and execution time savings.
References
[1] Asci purple codes. http://www.llnl.gov/asci/purple, 2002.
[2] E. A. Brewer, C. N. Dellarocas, A. Colbrook, and W. E. Weihl. teus: A high-performance parallel-architecture simulator. In
Pro-ceedings of the SIGMETRICS and PERFORMANCE ’92 Interna-tional Conference on Measurement and Modeling of Computer Sys-tems, pages 247–248, New York, NY, USA, June 1992. ACM Press.
[3] S. Browne, J. Dongarra, N. Garner, K. London, , and P. Mucci. A scalable cross-platform infrastructure for application performance tuning using hardware counters. In Supercomputing, Nov. 2000. [4] B. Buck and J. K. Hollingsworth. An API for runtime code patching.
The International Journal of High Performance Computing Applica-tions, 14(4):317–329, Winter 2000.
[5] B. R. Buck and J. K. Hollingsworth. Using hardware performance monitors to isolate memory bottlenecks. In ACM, editor,
Supercom-puting, pages 64–65, 2000.
[6] D. Burger, T. M. Austin, and S. Bennett. Evaluating future micropro-cessors: The simplescalar tool set. Technical Report CS-TR-1996-1308, University of Wisconsin, Madison, July 1996.
[7] H. Davis, S. R. Goldschmidt, and J. Hennessy. Multiprocessor sim-ulation and tracing using tango. In Proceedings of the 1991
Interna-tional Conference on Parallel Processing, volume II, Software, pages
II–99–II–107, Boca Raton, FL, Aug. 1991. CRC Press.
[8] J. Dean, J. Hicks, C. Waldspurger, W. Weihl, and G. Chrysos. Pro-fi leMe: Hardware support for instruction-level proPro-fi ling on out-of-order processors. In Proc. 30th Annual IEEE/ACM Int. Symp. on
Microarchitecture (MICRO-97), pages 292–302, Dec. 1997.
SIGMA: A simulator infrastructure to guide memory analysis. In
Supercomputing, Nov. 2002.
[10] R. D. F. E. Chow, A. J. Cleary. Design of the hypre preconditioner library. In SIAM Workshop on Object Oriented Methods for
Inter-operable Scientifi c and Engineering Computing, Oct. 1998.
[11] J. Gibson. Memory Profi ling on Shared Memory Multiprocessors. PhD thesis, Stanford University, July 2003.
[12] W. Gunsteren and H. Berendsen. Gromos: Groningen molecular sim-ulation software. Tr, Laboratory of Physical Chemistry, University of Groningen, 1988.
[13] C. Hughes, V. Pai, P. Ranganathan, and S. Adve. Rsim: Simulating Shared-Memory Multiprocessors with ILP Processors. IEEE
Com-puter, 35(2):40–49, February 2002.
[14] H. Jin, M. Frumkin, and J. Yan. The openmp implementations of nas parallel benchmarks and its performance. TR NAS-99-011, NASA Ames Research Center, Oct. 1999.
[15] A. Krishnamurthy and K. Yelick. Optimizing parallel programs with explicit synchronization. In ACM SIGPLAN Conference on
Pro-gramming Language Design and Implementation, pages 196–204,
1995.
[16] J. Larus and T. Ball. Rewriting executable fi les to measure pro-gram behavior. Software Practice & Experience, 24(2):197–218,
Feb. 1994.
[17] J. R. Larus and E. Schnarr. EEL: Machine-independent executable editing. In ACM SIGPLAN Conference on Programming Language
Design and Implementation, pages 291–300, June 1995.
[18] A. R. Lebeck and D. A. Wood. Cache profi ling and the SPEC bench-marks: A case study. Computer, 27(10):15–26, Oct. 1994. [19] A. R. Lebeck and D. A. Wood. Active memory: A new abstraction
for memory system simulation. ACM Transactions on Modeling and
Computer Simulation, 7(1):42–77, Jan. 1997.
[20] J. Marathe, F. Mueller, T. Mohan, B. R. de Supinski, S. A. McKee, and A. Yoo. Metric: Tracking down ineffi ciencies in the memory hierarchy via binary rewriting. In International Symposium on Code
Generation and Optimization, pages 289–300, Mar. 2003.
[21] G. Marin and J. Mellor-Crummey. Cross architecture performance predictions for scientifi c applications using parameterized models. In
SIGMETRICS Symposium on Parallel and Distributed Tools (SPDT),
page (to appear), 2004.
[22] M. Martonosi, A. Gupta, and T. Anderson. Memspy: analyzing memory system bottlenecks in programs. In Proceedings of the 1992
ACM SIGMETRICS joint international conference on Measurement and modeling of computer systems, pages 1–12, 1992.
[23] J. Mellor-Crummey, R. Fowler, and D. Whalley. Tools for application-oriented performance tuning. In International
Confer-ence on Supercomputing, pages 154–165, June 2001.
[24] A.-T. Nguyen, M. Michael, A. Sharma, and J. Torrellas. The augmint multiprocessor simulation toolkit: Implementation, experimentation and tracing facilities. In IEEE International Conference on
Com-puter Design: VLSI in ComCom-puters and Processors, pages 486–491,
Washington - Brussels - Tokyo, Oct. 1996. IEEE Computer Society. [25] D. Nikolopoulos, C. Polychronopoulos, and E. Ayguade. Scaling
irregular parallel codes with minimal programming effort. In
Super-computing, 2001.
[26] M. Rosenblum, S. A. Herrod, E. Witchel, and A. Gupta. Complete computer system simulation: The SimOS approach. IEEE parallel
and distributed technology: systems and applications, 3(4):34–43,
Winter 1995.
[27] S. Satoh, K. Kusano, and M. Sato. Compiler optimization tech-niques for openMP programs. Scientifi c Programming, 9(2-3):131– 142, 2001.
[28] Y. Solihin, V. Lam, and J. Torrellas. Scal-tool: Pinpointing and quan-tifying scalability bottlenecks in dsm multiprocessors. In
Supercom-puting, Nov 1999.
[29] J. Vetter and F. Mueller. Communication characteristics of large-scale scientifi c applications for contemporary cluster architectures. In International Parallel and Distributed Processing Symposium,
Apr. 2002.
[30] J. Vetter and F. Mueller. Communication characteristics of large-scale scientifi c applications for contemporary cluster architectures.
Journal of Parallel Distributed Computing, 63(9):853–865, Sept.