ABSTRACT
HOWELL, ANDREW WESLEY. Detecting, Mapping, and Quantifying Macrophytes Using Novel Boat-based Remote Sensing Technologies. (Under the direction of Robert J.
Richardson).
Invasive macrophytes, such as non-native Hydrilla verticillata, negatively impact lentic systems of the southeastern United States through impediment of recreational
activities, power generation, and disruption of indigenous ecological function. Expenditures associated with aquatic weed management include costs accompanied with monitoring, mapping and implementing control measures. Prompt aquatic vegetation detection and mapping are critical factors when formulating management decisions and practices. Management protocols are often reliant upon the perceived extent of invasive vegetation incursion. Point-intercept methods have traditionally persisted as industry standards for accessing lakewide macrophyte presence, abundance, and distribution. Although point-intercept survey methods are essential for lake managers, these surveys are prone to subjectivity in vegetation richness, spatial estimation, and are exceptionally inefficient. Traditional sampling techniques often require significant labor inputs, which limits repeatability, the scale of sampling, and the rapidness of processing. Advances in
macrophyte growth patterns, littoral occupancy, and determining macrophyte management efficacy on a spatiotemporal level.
Detecting, Mapping, and Quantifying Macrophytes Using Novel Boat-based Remote Sensing Technologies.
by
Andrew Wesley Howell
A thesis submitted to the Graduate Faculty of North Carolina State University
in partial fulfillment of the requirements for the degree of
Master of Science
Crop Science
Raleigh, North Carolina 2017
APPROVED BY:
_______________________________ Dr. Robert J. Richardson
Committee Chair
_______________________________ _______________________________
Dr. David L. Jordan Dr. Erin L. Hestir
_______________________________ _______________________________
ii DEDICATION
iii BIOGRAPHY
Andrew W. Howell was born and raised in Sanford, NC. He became interested in agriculture and environmental management at an early age which lead him to obtain his Eagle Scout Award. He received his B.S. degree in Crop Production with a Minor in Horticulture at North Carolina State University. During Andrew’s undergraduate career, he saw first-hand the risks posed by exotic, invasive plant species on native ecosystems and agronomic settings while interning at several research farms. Andrew decided to pursue a M.S. in Aquatic Weed Science and a Graduate Certificate in Geographic Information Systems to assist others in combating the issues of invasive species. During his graduate career, Andrew remained active in several professional societies and conservation
iv ACKNOWLEDGMENTS
I would like to thank my advisor Dr. Robert J. Richardson for this great opportunity, and the rest of my committee members Dr. Erin L. Hestir, Dr. Stacy A.C. Nelson, Dr. Wesley J. Everman, and Dr. David L. Jordan, for their guidance and support while conducting and transcribing this research. Many thanks to the “Richardson Lab” for their assistance
v
TABLE OF CONTENTS
LIST OF TABLES ... vii
LIST OF FIGURES ... ix
CHAPTER 1: Literature Review and Rationale ... 1
MACROPHYTES OVERVIEW ... 2
INVASIVE AND AQUATIC SPECIES MANAGEMENT ... 4
REMOTE SENSING OF AQUATIC PLANTS ... 12
NOTEWORTHY STATISTICAL PROCEDURES ... 16
RESEARCH OBJECTIVES ... 19
LITERATURE CITED ... 24
CHAPTER 2: Correlation of Hydroacoustic Signature to Submersed Plant Biomass . 43 ABSTRACT ... 44
INTRODUCTION ... 45
MATERIALS AND METHODS ... 48
RESULTS AND DISCUSSION ... 52
SOURCES OF MATERIALS ... 61
LITERATURE CITED ... 62
CHAPTER 3: Combining Multiple Sensors to Acquire a Comprehensive Map of Lake Vegetation ... 85
ABSTRACT ... 86
INTRODUCTION ... 87
MATERIALS AND METHODS ... 95
RESULTS AND DISCUSSION ... 100
SOURCES OF MATERIALS ... 115
LITERATURE CITED ... 116
CHAPTER 4: Submersed Plant Population Dynamics Over Time at Roanoke Rapids Lake, NC ... 141
ABSTRACT ... 142
INTRODUCTION ... 143
MATERIALS AND METHODS ... 146
RESULTS AND DISCUSSION ... 153
CONCLUSIONS ... 160
MANAGEMENT RECOMMENDATIONS ... 161
SOURCES OF MATERIALS ... 163
LITERATURE CITED ... 164
CHAPTER 5: Evaluation of Potential Control Measures for Established Arundo donax ... 185
ABSTRACT ... 186
vi
MATERIALS AND METHODS ... 191
RESULTS AND DISCUSSION ... 193
MANAGEMENT RECOMMENDATIONS ... 195
SOURCES OF MATERIALS ... 196
vii LIST OF TABLES
CHAPTER 2:
TABLE 1. BIOMASS AND HYDROACOUSTIC SAMPLING DYNAMICS AT EACH STUDY LOCATION FROM 6/11/15 TO 10/13/15. ... 82 TABLE 2. MULTIPLE LINEAR REGRESSION EQUATIONS COMPRISED FROM EITHER BOTH STUDY
LOCATIONS OR THE POOLED DATASET. *THE HIGHEST BIOMASS PREDICTION AT DEPTH THRESHOLD OF .76 M-1 WITH A SPATIAL REPRESENTATION OF .25 M-3 USING SITE SPECIFIC TRAINING DATA. ... 83 TABLE 3. GENERALIZED ADDITIVE MODEL (GAM) EQUATIONS COMPRISED FROM EITHER BOTH
STUDY LOCATIONS OR THE POOLED DATASET. *THE HIGHEST BIOMASS PREDICTION AT DEPTH THRESHOLD OF .76 M-1 WITH A SPATIAL REPRESENTATION OF .25 M-3
USING SITE SPECIFIC TRAINING DATA. ... 84 CHAPTER 3:
TABLE 1. COMPARISON OF MULTIPLE SENSOR ARRAY OPTICAL SENSORS USED FOR
MACROPHYTE CANOPY NDVI CALCULATIONS. ... 136 TABLE 2. SITE SPECIFIC RECORDINGS WHICH ACCOMPANIED FIELD OBSERVATIONS DURING
REMOTE SENSING EQUIPMENT TESTING. ... 137 TABLE 3. OUTLINE OF MACROPHYTES STUDIED; INCLUDES SENSOR USED FOR EACH SPECIES AND THE RESPECTIVE LOCATION OF THE SENSOR TRIAL. ... 138 TABLE 4. PLANT CANOPY STRUCTURE SEPARATION ANALYSIS DERIVED FROM ADC IMAGES
USING A FILTER WINDOW REPRESENTING THE FIELD OF VIEW (FOV) OF GREENSEEKER. WHITE PIXELS REPRESENT HEALTHY GREEN VEGETATION; BLACK PIXELS DEFINE ALL OTHER ABSORPTION FEATURES. ... 139 TABLE 5. DUAL TRANSDUCER SUMMARY STATISTICS FOR COMPARISON OF SELECT AREA
INTERACTIONS OF A WHOLE-LAKE, HYDROACOUSTIC SURVEY AT ROANOKE RAPIDS LAKE FALL 2015. ... 140 CHAPTER 4:
TABLE 1. MORAN'S (I) SPATIAL AUTOCORRELATION REPORT FOR SUBMERSED VEGETATION IDENTIFIED AMONG SURVEY YEARSA. ... 178 TABLE 2. OUTLINE OF THE SEVEN SUBMERSED VEGETATION SPECIES IDENTIFIED AT ROANOKE
RAPIDS LAKE BETWEEN YEARS 1999-2015A,B. ... 179 TABLE 3. MAXIMUM LIMITING DEPTH OF EACH SUBMERSED SPECIES IDENTIFIED AT ROANOKE
RAPIDS LAKE BETWEEN YEARS 1999-2015A. ... 180 TABLE 5. LAKE-WIDE DOMINANCE OF EACH SUBMERSED SPECIES IDENTIFIED BY
POINT-INTERCEPT METHODS AT ROANOKE RAPIDS LAKE BETWEEN YEARS 1999-2015A,B,C. ... 182 TABLE 6. SPATIAL STATISTICS SUMMARY OF LOCATIONS OCCUPIED WITH SUBMERSED
VEGETATION AT ROANOKE RAPIDS LAKE IN YEARS 1999 AND 2015A,B,C,D. ... 183 TABLE 7. SUBMERSED VEGETATION SPATIAL (HA-1) CO-OCCURRENCE MATRIX COMPARING
viii CHAPTER 5:
TABLE 1. CONTROL OF GIANT REED WITH SELECTED HERBICIDE TREATMENTS IN THE
GREENHOUSE. ... 202 TABLE 2. VISUAL RATINGS OF GIANT REED CONTROL FOLLOWING SELECTED HERBICIDE
ix LIST OF FIGURES
CHAPTER 2:
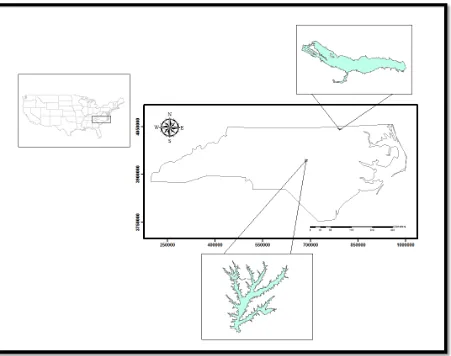
FIGURE 1. LOCATIONS OF TWO NC PIEDMONT RESERVOIRS SAMPLED FOR HYDRILLA BIOMASS AND HYDROACOUSTIC SCANS. ... 65 FIGURE 2. EXAMPLE OF A SINGULAR PLOT USED FOR SEASONAL BIOMASS SAMPLING AND
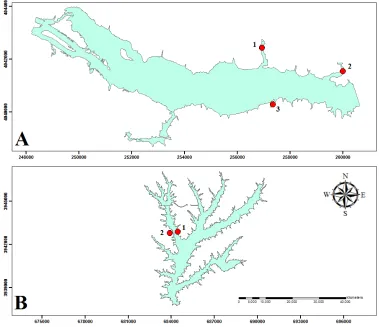
HYDROACOUSTIC SCANS. ... 66 FIGURE 3. SAMPLING SITES OF EACH CORRESPONDING EXPERIMENTAL LAKE LOCATION VISITED
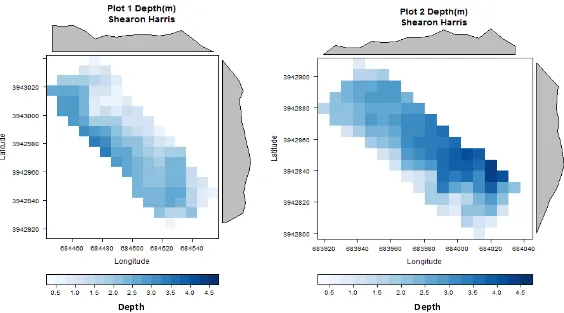
BI-WEEKLY FOR HYDROACOUSTIC SCANS AND BIOMASS SAMPLING. ... 67 FIGURE 4. MAP OF RASTER CELLS (7.5 M-2) REPRESENTING DEPTH CONTOURS AT EACH GIVEN
GEOGRAPHIC LOCATION AT SHEARON HARRIS CHARACTERIZING PLOT 1 AND PLOT 2 PROFILES. ... 68 FIGURE 5. MAP OF RASTER CELLS (7.5 M-2) REPRESENTING DEPTH CONTOURS AT EACH GIVEN
GEOGRAPHIC LOCATION AT ROANOKE RAPIDS CHARACTERIZING PLOT 1, PLOT 2, AND PLOT 3 PROFILES. ... 69 FIGURE 6. SHEARON HARRIS CORRELATIONS AMONG ESTIMATED BIOVOLUME PERCENTAGES
FROM CIBIOBASE 5.2 AND OBSERVED HYDRILLA BIOMASS. ... 70 FIGURE 7. ROANOKE RAPIDS CORRELATIONS AMONG ESTIMATED BIOVOLUME PERCENTAGES
FROM CIBIOBASE 5.2 AND OBSERVED HYDRILLA BIOMASS. ... 71 FIGURE 8. ROANOKE RAPIDS CORRELATIONS AMONG ESTIMATED BIOVOLUME PERCENTAGES
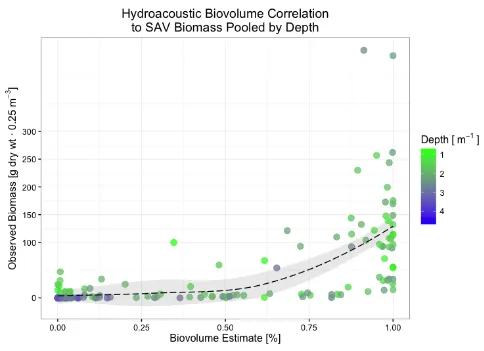
FROM CIBIOBASE 5.2 AND OBSERVED SAV BIOMASS. ... 72 FIGURE 9. POOLED DATASET CORRELATIONS AMONG ESTIMATED BIOVOLUME PERCENTAGES
FROM CIBIOBASE 5.2 AND OBSERVED SAV BIOMASS. ... 73 FIGURE 10. POOLED DATASET CORRELATIONS AMONG ESTIMATED BIOVOLUME PERCENTAGES
FROM CIBIOBASE 5.2 AND OBSERVED SAV BIOMASS BY SAMPLING LOCATIONS. ... 74 FIGURE 11. SCATTER PLOT OF POOLED SAV DEPTH PROFILES. ... 75 FIGURE 12. BOX-WISKER PLOTS OF ESTIMATED BIOVOLUME DETECTED AT CORRESPONDING
SAMPLING LOCATIONS AT SHEARON HARRIS, ROANOKE RAPIDS, AND A POOLED DATASET OF BOTH LOCATIONS. ... 76 FIGURE 13. THREE-DIMENSIONAL, PERSPECTIVE PLOTS USED TO REPRESENT SITE SPECIFIC
BIOMASS (Z-AXIS) PREDICTION VALUES FROM RESPECTIVE GENERALIZED ADDITIVE
MODELS (GAMS). ... 77 FIGURE 14. BOX-WHISKER PLOTS OF ESTIMATED BIOVOLUME OVER TIME FOR PLOT 1 AND PLOT
2 AT SHEARON HARRIS. ... 78 FIGURE 15. BOX-WHISKER PLOTS OF ESTIMATED BIOVOLUME OVER TIME FOR PLOT 1, PLOT 2,
AND PLOT 3 AT ROANOKE RAPIDS. ... 79 FIGURE 16. MAP REVEALING PLOT SPECIFIC DEVELOPMENT PATTERN DIFFERENCES IN
BIOVOLUME OVER TIME AT SHEARON HARRIS. ... 80 FIGURE 17. MAP REVEALING PLOT SPECIFIC DEVELOPMENT PATTERN DIFFERENCES IN
x
CHAPTER 3:
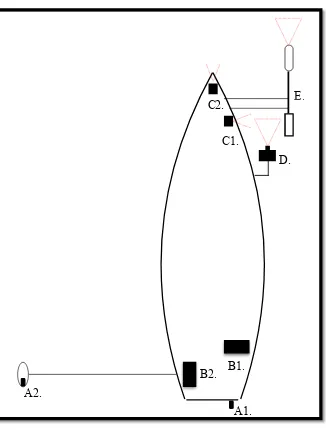
FIGURE 1. BOAT-BASED MULTIPLE SENSOR ARRAY DESIGN WITH RESPECTIVE REMOTE SENSING IMPLEMENT LOCATIONS.. ... 122 FIGURE 2. BOX-WHISKER PLOT OF CORRESPONDING NDVI VALUES OBTAINED FROM ADC
MULTISPECTRAL IMAGES, USED TO DISTINGUISH IF THE SPECIES PRESENTED IN THIS STUDY WERE SIGNIFICANTLY DIFFERENT THAN THE AVERAGE NDVI VALUE OF OPEN WATER. ... 123 FIGURE 3. MACROPHYTE CANOPY ESTIMATES FROM SPECIES SPECIFIC 3-BAND (NIR,R,G)
MULTISPECTRAL IMAGES CAPTURED WITH THE TETRACAM ADC SENSOR. ... 124 FIGURE 4. THE RELATIONSHIP BETWEEN FRACTIONAL GREEN CANOPY COVER AND NDVI USED
TO DEFINE INTERSPECIFIC VARIABILITY AND PROVIDE A THRESHOLD FOR EMPLOYING NDVI AS A TOOL FOR IDENTIFYING AQUATIC VEGETATION USED IN THIS STUDY. ... 125 FIGURE 5. RADIOMETRIC BRIGHTNESS INTENSITY RESPONSES FOR EACH SPECIES TESTED FROM
THE MULTISPECTRAL IMAGES. ... 126 FIGURE 6. LINE OF FIT FOR A NON-PARAMETRIC REGRESSION SMOOTHING TERM (LOESS)
PORTRAYING THE RELATIONSHIP BETWEEN BIOVOLUME AND NDVI VALUES CALCULATED FROM THE ADC IMAGER FOR SUBMERSED H. VERTICILLATA, SURFACE H. VERTICILLATA, AND OPEN WATER. ... 127 FIGURE 7. BOX-WHISKER PLOT OF CORRESPONDING NDVI VALUES OBTAINED FROM
GREENSEEKER RECORDINGS, USED TO DISTINGUISH IF THE SPECIES PRESENTED IN THIS STUDY WERE SIGNIFICANTLY DIFFERENT THAN THE AVERAGE NDVI VALUE OBTAINED FOR OPEN WATER. ... 128 FIGURE 8. MAP OF THREE SEPARATE LITTORAL (AOI) AREAS OF INTEREST WITHIN ROANOKE
RAPIDS LAKE TO DISCERN THE EFFICIENCY OF SIMULTANEOUSLY RECORDING TWO
TRANSDUCER TRACKS.. ... 129 FIGURE 9. DISTRIBUTION PLOTS OF DEPTH PROFILES FOR TRANSDUCERS 1 AND 2 DURING THE
DUAL TRANSDUCER TRIAL AT ROANOKE RAPIDS LAKE. THE RED DASHED LINES DEPICT THE MEDIAN DEPTH RANGE FOR EACH TRANSDUCER. ... 130 131
FIGURE 10. DISTRIBUTION PLOTS OF BIOVOLUME RANGES FOR TRANSDUCERS 1 AND 2 DURING THE DUAL TRANSDUCER TRIAL AT ROANOKE RAPIDS LAKE.. ... 131 FIGURE 11. MAP OF IMPROVED PRECISION OF LITTORAL CHARACTERISTICS USING THE DUAL
TRASDUCER ARRANGEMENT... ... 132 FIGURE 12. EXAMPLES OF RESULTING IMAGES PROCESSED THROUGH THE CANOPEO
APPLICATION FROM TWO ACTION CAMERA STILL FRAMES. ... 133 FIGURE 13. COLUMN CHART USED TO DEPICT DETECTION ACCURACY FOR BOTH THE
GREENSEEKER AND TETRACAM ADC MULTISPECTRAL IMAGER ON A SPECIES-WISE
CLASSIFICATION ASSESSMENT. ... 134 FIGURE 14. RESULTING OUTPUT EXAMPLE FROM THE MULTIPLE SENSOR ARRAY BOAT-BASED
PLATFORM TO ASSESS LAKEWIDE VEGETATION.. ... 135 CHAPTER 4:
xi FIGURE 2. DEPTH PROFILE OF RAONOKE RAPIDS LAKE CREATED USING POOLED
HYDROACOUSTIC TRANSECTS FROM 2012 AND 2015 SURVEY YEARS. ... 173 FIGURE 3. COMMUNITY RICHNESS INTERACTIONS AMONG DEPTH AVERAGES DETERMINED
THROUGH SPECIES OCCURRENCE OR CO-OCCURRENCE OBSERVATIONS. ... 174 FIGURE 4. SPECIES-WISE KERNEL DENSITY INTERPOLATION MAPS DEPICTING THE DISTRIBUTION
AND EXPANSE OF SUBMERSED VEGETATION WITHIN ROANOKE RAPIDS LAKE BASED UPON POINT-INTERCEPT SAMPLING REGIMES AND BATHYMETRIC PARAMETERS. ... 175 FIGURE 5. SPECIES-WISE KERNEL DENSITY INTERPOLATION MAPS DEPICTING THE DISTRIBUTION
AND EXPANSE OF SUBMERSED VEGETATION WITHIN ROANOKE RAPIDS LAKE BASED UPON BATHYMETRIC PARAMETERS AND POINT-INTERCEPT SAMPLING REGIMES DURING THE 2015 WHOLE-LAKE SURVEY. ... 176 FIGURE 6. KERNEL DENSITY INTERPOLATION MAPS DEPICTING THE DISTRIBUTION AND EXPANSE
1 CHAPTER 1
2 MACROPHYTES OVERVIEW
Freshwater aquatic vegetation is extensively recognized for contributing to the ecological structure of lentic, lotic, and wetland systems (Likens 1975; Madsen et al. 2001; Valley et al. 2004). As primary producers (Lehmann et al. 1994), macrophytes assist in the overall net primary production of aquatic environments (Likens 1975; Boston et al. 1989; Madsen and Sand-Jensen 1991; Dodson et al. 2000; Takamura et al. 2003; Brothers et al. 2013), and remain fundamental constituents of the global food web (Hanson and Butler 1994; Havens et al. 1996; Zeigler et al. 2015). Consequently, macrophytes act as trophic indicators of ecosystem quality (Lehmann et al. 1994) while offering habitat for macroinvertebrates, littoral fish species, and waterfowl (Heck and Crowder 1991; Petr 2000; Schmieder et al. 2006). Furthermore, macrophytes provide critical niches within aquatic assemblies which support lakewide sustainability and development. One class of macrophyte in particular, submersed aquatic vegetation (SAV), plays an essential role in the maintenance of aquatic environments by reducing shoreline erosion and stabilizing sediment loads for reduced turbidity (Carpenter and Lodge 1986; Barko et al. 1991; Madsen et al. 2001), operating as eutrophic sinks from anthropogenic impacts (Kufel and Kufel 2002; Gao et al. 2009), functioning in seasonal nutrient cycling (Twilley et al. 1985; Carpenter and Lodge 1986; Granéli and Solander 1988), and preserving fluvial regimes (Dodds and Biggs 2002; Doering et al. 2002). However, the absence of SAV within littoral regions may hinder the
3 Valley et al. 2004; Durocher et al. 2011), and ultimately reduce the ecologic and economic value of a waterbody.
The evolution and development of macrophytes relies upon a conditional mixture of physiological processes and abiotic parameters (Coops et al. 1996; Lehmann et al. 1997; Herb and Stefan 2003). Aquatic ecologists have acknowledged various limiting factors effecting submersed macrophyte growth and spatial occurrence, including: littoral slope and depth zonation (Daurte and Kalff 1986; Middelboe and Markager 1997; Sousa et al. 2011), thermal variability (Barko et al. 1982), nutrient availability (including P sources and C:N ratios) (Hough et al. 1989; Moss et al. 2012 ; Kovalenko and Dibble 2014), sediment suspension (Barko et al. 1991; Lauridsen et al. 1993), turbidity and light attenuation (Barko et al. 1982; Madsen et al. 2001; Hansel-Welch et al. 2003; Havens 2003), disturbance
(Lehmann et al. 1997; Valley and Drake 2005; Cao et al. 2012), and interspecific competition (Haller and Sutton 1975; Capers et al. 2007; Shekede et al. 2008; Meadows and Richardson 2012). Of these confines, carbon and light availability provide the greatest influence of submersed macrophyte occurrence (Hough and Fornwall 1988; Barko et al. 1991; Madsen and Sand-Jensen 1994; Sidorkewicj et al. 2004); however, this is highly dependent upon the waterbody of interest.
4 which lack heterogeneity, or which have low species richness, are recognized for reducing the intrinsic biodiversity of aquatic environments (Kovalenko and Dibble 2014), which is often an adverse response among waterbodies dominated with exotic, invasive species.
INVASIVE AND AQUATIC SPECIES MANAGEMENT Overview:
Invasive exotic species (IES) are non-native plants or fauna which have unfavorable effects upon native ecologic function and commonly generate economic hindrance among invaded areas (Keast 1984; Gordon 1998; Pimentel et al 2000; Santos et al. 2011; Gallardo et al. 2016). One reason IES tend to thrive among new ranges is the lack of predation and incapacity of native species opposition (Keane and Crawley 2002; Callaway and Ridenour 2004). Lacking predation, IES reduce innate ecosystem biodiversity through resource competition (Madsen 1991; Zhang and Boyle 2010), dominance (Houlahan and Findlay 2004), and habitat disruption (Thum and Lennon 2009; Schultz and Dibble 2012). Although IES threaten ecosystem processes (Wilcove et al. 1998), the expenditures associated with IES in the United States are of equal importance; costing stakeholders around $120 billion
annually (Pimental et al. 2005), which fiscally complicates the evolutionary issue of invasion.
5 dense, monoculture stands (Langeland 1996; Eiswerth et al. 2000), which increase chemical and biological competition, while excluding light interception from dense canopies (Smart et al. 1994; Spencer and Ksander 2000). In the case of H. verticillata, this competition often displaces native SAV beds (Madsen et al. 1991; Valley et al. 2004; True-Meadows et al. 2016), and can host cyanobacteria which create illness for fauna in some instances (Wilde et al. 2005). Likewise, exotic plant beds pose human health risks when surface mats provide breeding opportunities for mosquitos (eg. Aedes spp.) which vector disease (Hearnden and Kay 1997; Wersal et al. 2007; Cuda 2009). Moreover, these aquatic IES may reduce lakefront property values (Zhang and Boyle 2010), inhibit recreational activities and navigation, obstruct water intakes, and hinder power generation (Langeland 1996), which concurrently costs the United States over $100 million dollars annually towards macrophyte management (Rockwell 2003).
6 Hestir et al. 2008; Thum and Lennon 2009; Lambert et al. 2010). However, when SAV incursions arise, aquatic ecologists and plant managers must provide integrated weed management measures. Physical control methods, which often apply the use of benthic barriers, drawdown programs, and mechanical removal are effective actions in several situations (Murphy 1988; Madsen 1997; Shaw et al. 2016). However, destructive harvests of SAV are rarely applicable in southeastern U.S. reservoirs because of complex littoral
profiles, longer growing seasons, and SAV physiological properties (ie. H. verticillata can reproduce via fragmentation) (Haller 2009). Among many scenarios, managers will implement biological control methods to provide long-term management (Cuda 2009) whether it be with arthropods (Reeves and Lorch 2012) or herbivorous fish species like grass carp (Ctenopharyngodon idella) (Van Dyke et al. 1984; Bonar et al. 1993; Manuel et al. 2013). Still, these methods lack a comprehensive management regime due to biological agent mortality, semi-selective feeding (ie. can harm native vegetation), and regulation (Richardson 2008). Nevertheless, chemical control methods, which use registered aquatic herbicide
formulations (Parochetti et al 2008; Richardson 2008), provide an opportunity to treat regions of infestation and minimize further IES persistence to meet specific management goals (ie. weed suppression or eradication). Conversely, herbicide formulations and treatment applications are often mandated on a state-by-states basis, require knowledge of species selectivity to minimize off-target effects (ie. harm native species), and are often an expensive option in highly invaded systems (Netherland 2009). Therefore, to acquire a holistic
7 The benefits of early detection require water resource managers to conduct
waterbody-wide surveys which support the management opportunities previously described. Timely monitoring and proficient mapping tactics have continued as essential tools for evaluating native and exotic aquatic vegetation (Maceina et al. 1984; Lehmann &
Lachavanne 1997; Valley and Drake 2005; Hestir et al. 2008; Santos et al. 2011; Husson et al. 2016). While several macrophyte surveying techniques have been recognized (eg. Ackleson and Klemas 1987; Schneider et al. 2004; Gunn et al. 2010), in situ point-intercept sampling procedures have become industry standard for describing spatial patterns in SAV presence, distribution, and richness (Madsen 1999). However, there are several drawbacks to the point-intercept methodology, as assessments require a skilled workforce (ie. correctly identify species; boating proficiency) and there is often subjectivity among surveyors, which can reduce survey accuracy. Likewise, these methods demand extensive labor and time commitments as the extent of lakewide evaluations are highly correlated to the accuracy, coverage, and time spent appraising each sampling location. Therefore, researchers and lake managers seek to engage recent advances in remote sensing technologies to reduce the labor and economic expenditures involved in macrophyte surveys.
Hydrilla verticillata (L.f.) Royle:
H. verticillata (hydrilla or waterthyme), is an invasive, exotic submersed macrophyte within the Hydrocharitaceae family, which has been coined the “perfect aquatic weed” (Langeland 1996). Native to Asia (Cook and Lound 1982), H. verticillata was first
8 al. 2005). Since introduction, H. verticillata has expanded its range from Florida (Blackburn et al. 1969), northwest to Washington, and as far north as Maine (Spencer and Ksander 2000). Two H. verticillata biotypes occur in the United States, monoecious and dioecious (Cook and Lound 1982). Monoecious H. verticillata was first discovered in North Carolina in 1981 at Lake Umstead in Wake Co. (Harlan et al. 1985), and to date monoecious H. verticillata has spread to nearly half of the 100 counties within the state (Haug et al. 2016). H. verticillata has developed into an ecologic and economic epidemic. Nationwide, millions of dollars are spent annually towards H. verticillata management, with $14.5 million spent in Florida alone every year (Center et al. 1997). Given the invasive nature and burden of H. verticillata, the United States government has declared H. verticillata a federal noxious weed (USDA 2010), with state noxious listings occurring on a state-by-state basis.
9 waterbodies to find more than 1,700 tubers m-2 may be present within a given location, which further defines the temporal longevity and competitive advantage H. verticillata encompasses for developing monoculture stands (Havel et al. 2015).
Evolutionary adaptions to environmental factors also provide H. verticillata with competitive physiological leads that offer an ability to survive the harshest freshwater systems. H. verticillata has the capacity to intercept light in photic regions as low as one percent (Langeland 1996), which permits a multitude of depth, shading, and turbidity tolerances (Canfield et al. 1985). Similarly, H. verticillata has developed a lower CO2 compensation point due to its capability of C3 and C4-like production modification (Holaday and Bowes 1980; Ginkel et al. 2001), which allows H. verticillata to photosynthesize earlier than most other submersed angiosperms (Langeland 1996). Likewise, H. verticillata has adapted to pH, salinity, temperature, and nutrient tolerances (Haller et al. 1974; Van et al. 1976; Cook and Luond 1982; Steward and Van 1987; Steward 1991).
H. verticillata inhibits native macrophyte development and reduces ecosystem biodiversity through establishment of dense, monoculture stands (Langeland 1996; Eiswerth et al. 2000). Furthermore, H. verticillata produces more than 50% of standing biomass in the top 0.5 m-1 of the water column (Haller and Sutton 1975) which prohibits sunlight to
10 eagles (Haliaeetus leucocephalus) (Wilde et al. 2005). Similarly, H. verticillata mats pose human health risks when surface mats provide breeding opportunities for mosquitos (eg. Aedes spp.) which vector disease (Hearnden and Kay 1997; Wersal et al. 2007; Cuda 2009). Furthermore, H. verticillata inhibits recreational activities, boat navigation, obstruction of water intakes, and impedes power generation (Langeland 1996).
Arundo donax L.:
A. donax (giant reed), is a robust perennial cane species within the Poaceae family which prefers riparian areas (Wijte et al. 2005; Tarin et al. 2013; Corno et al. 2014). Closely resembling the phenotypic and morphologic growth patterns of Phragmites spp. and
Bambusa spp., A. donax has an erect growth stature of 7-10 m-1 (Coffman et al. 2010; Lambert et al. 2010; Saltonstall et al. 2010). Furthermore, the clump-forming A. donax (Lambert et al. 2010), follows a C3 photosynthetic pathway, though more comparable to the prolific growth patterns of C4 plants (Rossa et al. 1998). Once established, annual yield potential has been documented to be > 20 t/ha-1 (Perdue 1958; Angelini et al. 2009; Impagliazzo et al. 2016). Generating high seasonal biomass, A. donax continues to gain recognition among researchers examining second-generation biofuels (Birur et al. 2008; Mantineo et al. 2009; Baldini et al. 2016; Corno et al. 2016). Furthermore, some
11 For thousands of years, A. donax has been cultivated for its immense utilitarian
potential. Modern usages are documented in paper pulp production (Shatalov and Pereira 2006, Ge et al. 2016), erosion control and fodder (Hardion et al. 2014), construction material (Lambert et al. 2010; Karahancer et al. 2016), and reeds for musical instruments (Perdue 1958). From these practical characteristics, anthropologists and plant geneticists suggest human activity most likely contributed to the spread of A. donax from its origin in either Asia (Polunin and Huxley 1987; Angelini et al. 2009) or the Mediterranean (Tarin et al. 2013; Hardion et al. 2014), to eventually California, where it was planted for erosion control in the early 1800’s (Mariani et al. 2010).
Since first introduced into the United States, A. donax has expanded its range
longitudinally from California to Maryland (Bell 1997), and most recently, Delaware (USDA 2017). A. donax reproduction in North American occurs asexually through clonal
fragmentation of stems (apical internodes), and rhizomatous structures, since inflorescences are unable to produce viable seed (Wijte et al. 2005; Santín-Montanyá et al. 2013).
12 potential (Coffman et al. 2010). Therefore, officials have declared giant reed a state noxious weed in California, Nevada, and Texas (Koop et al. 2012).
REMOTE SENSING OF AQUATIC PLANTS
With the evolution of remote sensing platforms, monitoring and mapping strategies continually gain recognition for use among aquatic environments. Over the last several decades, the use of active hydroacoustic systems (Duarte 1987; Sabol et al. 2002; Valley and Drake 2005) and optical sensors (Ackleson and Klemas 1987; Sawaya et al. 2003; Nelson et al. 2006; Hestir et al. 2008), has forged important toolsets for aquatic plant scientists which aid in macrophyte survey procedures and support the classification of complex
spatiotemporal dynamics found with aquatic vegetation. Furthermore, coupling remotely sensed data with computer based programs, like geographic information system (GIS) (eg. ArcGIS; ENVI; RStudio), has increased the performance of mapping techniques (Lehmann and Lachavanne 1997; Shaw 2005; Santos et al. 2016).
Implementing photosynthetic principles and spectral canopy radiance, optical remote sensing facilitates the identification and measurement of submersed and emergent
13 strongly in the NIR region (Gao 1996). Exploiting these spectral features provides the
groundwork for remote sensing of aquatic vegetation and supports the classification of plant stands (Gilmore et al. 2008; Husson et al. 2016), macrophyte distribution (Valta-Hulkkonen et al. 2004; Khanna et al. 2012), and examining species heterogeneity (Hestir et al. 2008). Furthermore, by comparing spectral regions, band reflectance and absorbance attributes, spectral indices may be used to summarize key reflectance features. One of the most popular and simplistic plant science indexes, designed by Rouse et al. (1974), is the normalized difference vegetation index (NDVI), which summarizes the strong absorption in red due to leaf chlorophyll and the strong reflectance in the NIR due to leaf structure:
Index equation: !"#$ =&'()(&'(*( .
Remote sensing studies investigating macrophytes often use NDVI when distinguishing non-submersed vegetation against absorption features (ie. water or non-submersed vegetation) or quantifying vegetation across spatial expanses (Peñuelas et al. 1993; Cho et al. 2008; Shekede et al. 2008; Blanco et al. 2012). However, most aquatic studies implementing satellites lack the spatial resolution to describe communal dynamics, and are unable to differentiate among species using NDVI alone, since most macrophytes contain chlorophyll.
14 Klemas 1987; Peñuelas et al. 1997; Dogan et al. 2009; Martin et al. 2010). However, only hyperspectral units provide sufficient narrow spectral bandwidths for species differentiation (Williams et al. 2003; Khanna et al. 2012). Furthermore, the cost of repeated application over large spatial scales often limits the use of airborne hyperspectral sensors (Underwood 2003). However, multispectral open-source sensors, such as Landsat 7 TM/ETM+, provide the basic spectral ranges needed for accessing broad population estimates of emergent vegetation, but lack the spatial and temporal resolution (eg. ~ 30 m-2 and ~15 days-1; respectively) to
accurately represent SAV or between alike species. Some commercial multispectral images do provide the required spectral and spatial resolutions to discern community assemblages, but the economic hindrance associated with those images often financially excludes small-scale lake managers from this application (eg. WorldView-2 image). Still, there are several limitations for using multispectral platforms for acquisition of aquatic vegetation specifically, SAV.
Optical remote sensing of submersed vegetation varies greatly from that of emergent macrophytes. Both plant physiological and environmental factors create complications when evaluating SAV, especially when observing canopies above the water column. Issues include atmospheric properties (eg. cloud cover; scattering), water column interference (eg. light attenuation and absorption due to water and water quality constituents), and benthic
15 aquaticum, Cabomba caroliniana, and Ceratophyllum demersum was when submersed vegetation occurred < 0.3 m-1 from the water surface. Likewise, Hestir et al. (2008) noted the presence of algae also affected the accuracy of SAV detection using optical platforms.
Furthermore, Nelson et al. (2006) studied the use of Landsat-5 TM images for modeling SAV abundance and distribution, but discovered high variability in estimation could be
confounded by water clarity parameters (eg. secchi depth; chlorophyll a; water color). Nevertheless, Hestir et al. (2012) showed detection of SAV despite high turbidity using airborne imaging spectroscopy.
A common method to remotely assess SAV is with the use of hydroacoustic systems. Several studies have operated boat-based echosounding arrangements to meet the
aforementioned confines of optically sensed SAV (eg. Duarte and Kalff 1990; Lehmann 1998; Sabel et al. 2002; Valley et al. 2005). Using commercial grade, single-beam transducers, researchers have documented the capability to map and quantify waterbody parameters which include: bathymetry and littoral slope (Duarte and Kalff 1986; Reshitnyk et al. 2014), SAV biomass and biovolume (ie. percent of water column occupied) (Macéina and Shireman 1980; Thomas et al. 1990; Vis et al. 2003), spatial coverage and distribution (Haga et al. 2007; Valley and Drake 2005), and benthic composition (Lehmann et al. 1997). Most recently, the introduction of software programs and automated cloud-based systems (eg. EcoSAV and ciBioBase 5.2; respectively) further assist in acoustically derived
16 However, it is important to note that the ability to detect submersed vegetation using
hydroacoustic systems does not replace the ability to classify SAV species. Furthermore, the accuracy of acoustic data is limited to areas > 0.76 m-1 in depth due to heavy noise and backscatter from the transducer in shallower littoral regions (Duarte 1987; Valley et al. 2015).
Much like the management of invasive species, remote sensing requires a culmination of techniques, in situ observation, and specialized knowledge to accurately characterize aquatic vegetation. However, the big-data and information gained from the application of remotely sensed surveys will likely contribute to the management, sustainability, and stewardship of our aquatic systems in the future (Adam et al. 2010).
NOTEWORTHY STATISTICAL PROCEDURES Generalized Additive Models (GAMs)
Originally developed and described by Hastie and Tibshirani (1986), GAMs
transform non-parametric environmental parameters using smoothing (splining) techniques (eg. penalized least squares, cubic regression, Gaussian models, etc.) to predict an ecological response variable through addition of each individual model predictors (Hastie and
Tibshirani 1990; Yee and Mitchell 1991). This robust and modern statistical formula assists in accounting for environmental variations which do not behave in a linear fashion (Wood and Augustin 2002; Venables and Dichmont 2004; Ahmadi-Nedushan et al. 2006).
17 using predictors regressed from a fixed model like in the case of MLR predictions (Lehmann 1998; Guisan et al. 2002). Consequently, uneven data distributions and non-linear responses, may be explained or interpolated by expending any number of individual predictor variables to access responses of the dependent variable within an ecological limit (Yee and Mitchell 1991; Lehmann et al. 2002). An example of the base GAM function with covariate factors used for model considerations shown is derived from Hastie and Tibshirani (1990), Wood (2006), and Larson (2015):
Model elements: E(Y) = B0 + s1(x1) + s2(x2) + ... + sp(xp),
where Y is the dependent variable (eg. biomass), E(Y) signifies the expected value, and the covariates s1(x1) + s2(x2) + ... + sp(xp) represent the smoothing terms (eg. depth; biovolume).
GAMs have become increasingly utilized by aquatic ecologists over the last three decades to describe significant environmental effects which explain prediction outcomes of response variables estimated from compilations of independent ecologic characteristics (Guisan et al. 2002; Wood and Augustin 2002). Aquatic studies applying GAMs have included: macrophyte distributions (Lamon et al. 1996; Lehmann 1998; Valley et al. 2005), abiotic influences on water quality parameters such as eutrophication and nutrient removal rates, fetch, and turbidity (Reckhow and Qian 1994; Morton and Henderson 2008;
18 Kernel Density Estimators (KDEs)
Well described by Silverman (1986), KDEs are a robust, non-parametric spatial interpolation of locally weighted parameters which use a smoothing term (eg. Gaussian) to reflect the concentration of neighboring regions within a defined unit area. The resulting output provides density estimations which delineates the breadth of input features to estimate zonal expanses (ie. distribution) which are used to express regions of presence or likeness (Seaman and Powell 1996; Duong 2007; Bennion et al. 2011). One drawback to this method however, is the requirement of independence (Worton 1989; Fieberg 2007); as many
ecological parameters are inherently spatially autocorrelated (ie. dependent) (Legendre 1993). To reduce the probability of spatial autocorrelation, resampling and point elimination are needed to meet the requirement of independent observations and reduce the likelihood of over-estimating (ie. Type I error) (Legendre 1993). However, removing data values
ultimately reduces sampling size and ecologic significance (de Solla et al. 1999). Nevertheless, utilizing tests, such as Moran’s I index (Moran 1950; Gibson 2014),
19 Model elements: + , =
-./ 1
.
234 5)6/ 7 ,
where + , is the estimated density outcome, n is the length of observations, h is the
bandwidth (ie. search radius), x are the discrete spatial locations (ie. latitude, longitude), Xi define the input values (eg. binary terms for presence), and K(x) is the smoothing function (ie. Gaussian). Ecologically, fixed bandwidths are recognized for providing the greatest non-biased surface density estimations (Worton 1995; Seaman and Powell 1996; Vokoun 2003).
While not commonly used in macrophyte studies, several aquatic plant ecologists have employed the use of KDEs to correlate spatial trends of aquatic plant distribution to environmental elements (eg. Göktoǧan et al. 2010; Santos et al. 2011; Compton et al. 2012; Olsen et al. 2016). Still, in ecology, KDEs are most often found in home range analysis studies, such as modeling faunal dispersal in lentic and lotic environments (Quinn et al. 1996; Sanvicente-Añorve et al. 2003; Vokoun 2003), and describing wildlife habitat heterogeneity, spatial zones and land preference, and seasonal travel (Chochrane et al. 2006; Robinson et al. 2010; Palminteri and Peres 2012; Immell et al. 2014).
RESEARCH OBJECTIVES Chapter 2:
Submersed aquatic vegetation (SAV), contribute to whole-lake ecological
20 Hydrilla verticillata (L.f.) Royle, present negative impacts through competition and
displacement of native SAV (Van et al. 1999; Spencer and Ksander 2000; Meadows and Richardson 2012), and the impediment of recreational activities and power generation (Langeland 1996). One measure of determining the severity of an exotic macrophyte invasion is through in situ biomass sampling over time (Madsen 1993). Numerous studies have revealed valuable implications for utilizing hydroacoustic technology for macrophyte estimation (Macéina et al. 1984; Daurte 1987; Thomas et al. 1990; Sabol and Melton 1995; Valley and Drake 2005). Current hydroacoustic equipment and procedures are exponentially superior to those units used nearly three decades ago. Recent advancements in commercial grade echosounders solve many of the constraints described by Macéina et al. (1984), Daurte (1987), and Thomas et al. (1990). Furthermore, advancements in GIS technology enable timely post-processing of survey data (Sabol et al. 2002; Valley and Drake 2005). The objective of this investigation was to document the use of a commercially available echosounders to: 1) delineate and characterize a relationship between hydroacoustic
biovolume signature to in situ measured H. verticillata biomass; 2) develop an algorithm for the assessment of H. verticillata biomass from interpolated hydroacoustic biovolume records; 3) define seasonal H. verticillata growth patterns at two NC piedmont reservoirs; and 4) create a visual representation of temporal SAV development.
Chapter 3:
21 al. 1989; Madsen and Sand-Jensen 1991; Dodson et al. 2000; Takamura et al. 2003; Brothers et al. 2013). However, alien plant invasions, like those caused by the submersed non-native species, Hydrilla verticillata (L.f.) Royle, often require water resource managers to conduct lakewide surveys to support management opportunities for ecologic and economic
sustainability. Timely monitoring and efficient mapping strategies remain fundamental for assessing the abundance of native and exotic aquatic flora (Maceina et al. 1984; Lehmann & Lachavanne 1997; Hestir et al. 2008; Husson et al. 2016). To reduce labor, time, and alleviate some of the obstacles associated with in situ fixed-point sampling, research has focused on advances in commercially available remote sensing technologies to offer innovative approaches for assessing aquatic vegetation. Open source sensors, like Landsat 7 ETM+, provide coarse population dynamics, but lack the spatial and temporal resolution (eg. ~ 30 m -2 and ~15 days-1; respectively) to accurately represent submersed and emergent vegetation. Conversely, commercial satellite images deliver the required spectral and spatial resolutions to discern community assemblages, but the economic hindrance associated with these images often prohibits small-scale application. Furthermore, satellite sensors have increased issues with atmospheric properties (eg. cloud cover; scattering), water column interference (eg. light attenuation and absorption due to water and water quality components), light penetration, and benthic substrate (Ackleson and Klemas 1987; Blanco et al. 2012; Cho et al. 2012).
22 mapping and post-processing for aquatic ecologists and lake managers through visual and statistical descriptions of macrophyte abundance levels linked to communal and temporal dynamics.
Chapter 4:
Macrophytes serve as fundamental trophic indicators of environmental quality and provide critical ecological niches among lentic, wetland, and riverine systems (Ackleson and Klemas 1987; Melzer 1999; Cho et al. 2012). Likewise, submersed aquatic vegetation (SAV) often aid in lakewide ecological sustainability (Twilley et al. 1985; Madsen et al. 2001; Kufel and Kufel 2002). However, introduction of non-native, invasive species such as Hydrilla verticillata (L.f.) Royle and Myriophyllum spicatum (L.) can impede native macrophyte and fauna conservancy (Langeland 1996; Eiswerth et al. 2000). As the final impoundment prior to the estuarine Albemarle Sound of North Carolina, Roanoke Rapids Lake has become part of a diverse and ecologically critical system for a multitude of aquatic flora and fauna (Meitzen 2016); most notably providing spawning opportunity for indigenous ray-finned species, such as striped bass (Morone saxatilis) and American eel (Anguilla rostrate) (Olsen and Rulifson 1992; Nelson 1998; USFWS 2015). Additionally, Roanoke Rapids Lake serves utilitarian purpose by providing power to surrounding basin districts, real estate, and
23 decadal alteration among submersed macrophyte species. Our objective of this study was to investigate submersed macrophyte: 1) species-specific variations in occurrence, abundance, dominance, and spatial distributions among; 2) community richness, and co-occurrence; and 3) interspecific dynamics over time.
Chapter 5:
Over the last several decades, global demands for reduced carbon (CO2) and other greenhouse gas emissions due to fossil fuel consumption, have prompted research of
alternative energy sources from second-generation bio-ethanol crops (Ragauskas et al. 2006; Hastings et al. 2008; Naik et al. 2010; Xu et al. 2015). Giant reed (Arundo donax L.),
continues to gain recognition among researchers examining second-generation raw materials for biofuel production (Birur et al. 2008; Mantineo et al. 2009; Baldini et al. 2016; Corno et al. 2016). In North Carolina, recent incentives from federal and states agencies has
24 LITERATURE CITED
Ackleson, S.G. and Klemas, V. 1987. Remote Sensing of Submerged Aquatic Vegetation in Lower Chesapeake Bay: A Comparison of Landsat MSS to TM Imagery. Remote Sens Environ 22:235–248.
Adam, E., Mutanga, O., and Rugege, D. 2010. Multispectral and hyperspectral remote sensing for identification and mapping of wetland vegetation: a review. 18(3):281-296.
Ahmadi-Nedushan, B., St-Hilaire, A., Be´rube, M. et al. 2006. A Review Of Statistical Methods For The Evaluation Of Aquatic Habitat Suitability For Instream Flow Assessment. River Res. Applic. 22:503–523.
Alberotanza, L., Cavalli, R.M., Pignatti, S., et al. 2006. Classification of Submersed Aquatic Vegetation of the Venice Lagoon using MIVIS Airborne Data. Ann Geophys.
49:271–276.
Angelini, L.G., Ceccarini, L., Nassi o Di Nasso, N., et al. 2009. Comparison of Arundo donax L. and Miscanthus x giganteus in a long-term field experiment in Central Italy: Analysis of productive characteristics and energy balance. Biomass and Bioenergy. 33(4):635-643.
Baldini, M., da Borso, F., Ferfuia, C., et al. 2016. Ensilage suitability and bio-methane yield of Arundo donax and Miscanthus × giganteus. Industrial Crops and Products. 95:264-275.
Barko, J.W., Hardin, D.G., and Matthews, M.S. 1982. Growth and morphology of submersed freshwater macrophytes in relation to light and temperature. Canadian Journal of Botany. 60:877-887.
Barko, J.W., Gunnison, D., Carpenter, S.R. 1991. Sediment interactions with submersed macrophyte growth and community dynamics. Aquatic Botany. 41:41-65.
Bell, G. 1997. Ecology and management of Arundo donax L. and Approaches to Riparian Habitat Restoration in Southern California. Plant Invasions: Studies from North America and Europe. 103-113.
Bennion, H., Battarbee, R.W., Sayer, C.D., et al. 2011. Defining reference conditions and restoration targets for lake ecosystems using palaeolimnology: A synthesis. Journal of Paleolimnology. 45:533-544.
25 Blackburn, R.D., Weldon, L.W., Yeo, R.R., and Taylor, T.M. 1969. Identification and
distribution of certain similar-appearing submersed aquatic weeds in Florida. Hyacinth Control Journal. 8:17-23.
Blanco, A., Qu, J.J., and Roper, W.E. 2012. Spectral signatures of hydrilla from a tank and field setting. Front Earth Sci 6:392–404.
Bonar, S.A., Thomas, G. L., Steven, L., et al. 1993. Effect of Triploid Grass Carp on the Aquatic Macrophyte Community of Devils Lake, Oregon. North Amer Journ Fish Manage. 13(4):757-765.
Boston, H.L., Adams, M.S., and Madsen, J.D. 1989. Photosynthetic strategies and productivity in aquatic systems. Aquat Bot. 34:27–57.
Brosse, S. and Lek, S. 2002. Relationships between environmental characteristics and the density of age-0 Eurasian perch Perca fluviatilis in the littoral zone of a lake: a nonlinear approach. Transactions of the American Fisheries Society. 131:1033–1043. Brothers, S.M., Hilt, S., Meyer, S. et al. 2013. Plant community structure determines primary
productivity in shallow, eutrophic lakes. Freshw Biol 58:2264–2276.
Bustamante, J., Pacios, F., Díaz-Delgado, R., et al. 2009. Predictive models of turbidity and water depth in the Doñana marshes using Landsat TM and ETM+ images. Journal of Environmental Management. 90:2219-2225.
Callaway, R.M. and Ridenour, W.M. 2004. Novel weapons: invasive success and the evolution of increased competitive ability. Front Ecol Environ. 2(8):436–444. Canfield, D.E., Langeland, K.A., Linda, S.B., and Haller, W.T. 1985. Relations between
water transparency and maximum depth of macrophyte colonization in lakes. Journal of Aquatic Plant Management. 23:25-28.
Cao, J., Wang, Y., and Zhu, Z. 2012. Growth response of the submerged macrophyte Myriophyllum spicatum to sediment nutrient levels and water-level fluctuations. Aquatic Biology 17(3):295-303.
Capers, R.S., Selsky, R., Bugbee, G.J. et al. 2007. Aquatic Plant Community Invasibility and Scale-Dependent Patterns in Native and Invasive Species Richness. Ecology.
88(12):3135-3143.
Carpenter, S.R. and Lodge, D.M. 1986. Effects of submersed macrophytes on ecosystem processes. Aquatic Botany. 26:341-370.
26 Chipman, J.W., Olmanson, L.G. and Gitelson, A.A. 2009. Remote Sensing Methods for Lake Management: A guide for resource managers and decision-makers. Developed by the North American Lake Management Society in collaboration with Dartmouth College, University of Minnesota, and University of Nebraska for the United States
Environmental Protection Agency. 1-126.
Cho, H.J., Kirui, P., and Natarajan, H. 2008. Test of Multi-spectral Vegetation Index for Floating and Canopy-forming Submerged Vegetation. Int. J. Environ. Res. Public Health. 5(5):477-483.
Cho, H.J., Mishra, D., and Wood, J. 2012. Remote Sensing of Submerged Aquatic Vegetation, Remote Sensing - Applications, Dr. Boris Escalante (Ed.). 297-308. Cochrane, J.C., Kirby, J.D., Jones, I.G., et al. 2006. Spatial Organization of Adult Bobcats in
a Longleaf Pine-Wiregrass Ecosystem in Southwestern Georgia. Southeastern Naturalist. 5(4):711-724.
Coffman, G.C., Ambrose, R.F., and Rundel, P.W. 2004. Invasion of Arundo donax in river systems of Mediterranean climates: causes, impacts and management strategies. Abstract. In: Proceedings 10th MEDECOS Conference, April 25 – May 1, 2004, Rhodes, Greece. 138.
Coffman, G.C., Ambrose, R.F., and Rundel, P.W. 2010. Wildfire promotes dominance of invasive giant reed (Arundo donax) in riparian ecosystems. Biological Invasions. 12(8):2723-2734.
Compton, T.J., De Winton, M., Leathwick, J.R., et al. 2012. Predicting spread of invasive macrophytes in New Zealand lakes using indirect measures of human accessibility. Freshwater Biology. 57(5):938-948.
Conrad, J.L., Bibian, A.J., Weinersmith, K.L., et al. 2016. Novel Species Interactions in a Highly Modified Estuary: Association of Largemouth Bass with Brazilian Waterweed Egeria densa. Transactions of the American Fisheries Society. 145(2):249-263. Cook, C.D.K. and Lüönd, R. 1992. A revision of the genus Hydrilla (Hydrocharitaceae).
Aquatic Botany. 13:485-504.
Coops, H., Geilen, N., Verheij, H.J., et al 1996. Interactions between waves, bank erosion and emergent vegetation: an experimental study in a wave tank. Aquat Bot 53:187– 198.
Corno, L., Pilu, R., Cantaluppi, E., et al. 2016. Giant cane (Arundo donax L.) for biogas production: The effect of two ensilage methods on biomass characteristics and biogas potential. Biomass and Bioenergy. 93:131-136.
27 Management Practices Handbook (eds. Gettys, LA., Haller, W.T., and Bellaud, M.). 47-54.
Duarte, C.M. 1987. Use of echosounder tracings to estimate the aboveground biomass of submerged plants in lakes. Can. J. Fish. Aquat. Sci. 44:732-735.
Duarte, C.M. and Kalff J. 1986. Littoral slope as a predictor of the maximum biomass of submerged macrophyte communities. Limnol. Oceanogr. 31:1072-1080.
Davies, K.W. and Johnson, D.D. 2011. Are we “missing the boat” on preventing the spread of invasive plants in rangelands?. Invasive Plant Science and Management. 4(1):166-171.
de Solla, S.R., Bonduriansky, R. and Brooks, R.J. 1999. Eliminating autocorrelation reduced biological relevance of home range estimates. Journal of Animal Ecology. 68(2):221-234.
Dodds, W.K. and Biggs, B.J.F. 2002. Water Velocity Attenuation by Stream Periphyton and Macrophytes in Relation to Growth Form and Architecture. Journal of the North American Benthological Society. 21(1):2-15.
Dodson, S.I., Arnott, S.E., and Cottingham, K.L. 2000. The Relationship in Lake Communities Between Primary Productivity and Species Richness. Ecology 81:2662–2679.
Doering, P.H., Chamberlain, R.H., and Haunert, D.E. 2002. Using submerged aquatic vegetation to establish minimum and maximum freshwater inflows to the Caloosahatchee estuary, Florida. Estuaries. 25(6B):1343–1354.
Dogan, O.K., Akyurek, Z., and Beklioglu, M. 2009. Identification and mapping of
submerged plants in a shallow lake using quickbird satellite data. J Environ Manage 90:2138–2143.
Duarte, C.M. 1987. Use of echosounder tracings to estimate the aboveground biomass of submerged plants in lakes. Can. J. Fish. Aquat. Sci. 44:732-735.
Duarte, C.M. and Kalff J. 1990. Patterns in the Submerged Macrophyte Biomass of Lakes and the Importance of the Scale of Analysis in the interpretation. Can J Fish Aquat Sci. 47:357–363.
Duong, T. 2007. ks: Kernel Density Estimation and Kernel Discriminant Analysis for Multivariate Data in R. Journal Of Statistical Software. 21(7):1-18.
28 Egertson, C.J., Kopaska, J.A., and Downing, J.A. 2004. A century of change in macrophyte
abundance and composition in response to agricultural eutrophication. Hydrobiologia. 524(1):145-156.
Eiswerth, M.E., Donaldson, S.G., and Johnson, W.S. 2000. Potential Environmental Impacts and Economic Damages of Eurasian Watermilfoil (Myriophyllum spicatum) in Western Nevada and Northeastern California. Weed Technology. 14(3):511-518. Everitt, J. H., Yang, C., and Deloach, C.J. 2005. Remote Sensing of Giant Reed with
QuickBird Satellite Imagery. Journal of Aquatic Plant Management. 43:81-85. Everitt, J.H., Summy, K.R., and Yang, C. 2009. Spectral Reflectance and Digital Image
Relations Among Five Aquatic Weeds. Subtropical Plant Science. 61:15-23.
Fagnano, M., Impagliazzo, A., Mori, M. et al. 2015. Agronomic and environmental impacts of giant reed (Arundo donax L.): results from a long-term field experiment in hilly areas subject to soil erosion. Bioenergy Res. 8:415–422.
Fieberg, J. 2007. Kernel density estimators of home range: Smoothing and the autocorrelation red herring. Ecology. 88:(4):1059–1066.
Gallardo, B., Clavero, M., Sánchez, M.I., et al. 2016. Global ecological impacts of invasive species in aquatic ecosystems. Global Change Biology. 22(1):151-163.
Gao, B. 1996. NDWI - A normalized difference water index for remote sensing of vegetation liquid water from space. Remote Sensing of Environment. 58(3):257-266.
Gao, J., Xiong, Z., Zhang, J. et al. 2009. Phosphorus removal from water of eutrophic Lake Donghu by five submerged macrophytes. Desalination. 242:193-204.
Ge, X., Xu, F., Vasco-Correa, J., and Li, Y. 2016. Giant reed: a competitive energy crop in comparison with miscanthus. Renew. Sustain. Energy Rev. 54:350–362.
Gibson, D.J. 2014. Methods in comparative plant population ecology. Oxford University Press. 1-320.
Gilmore MS, Wilson EH, Barrett N, et al. 2008. Integrating multi-temporal spectral and structural information to map wetland vegetation in a lower Connecticut River tidal marsh. Remote Sens Environ 112:4048–4060.
Ginkel, L.C., Bowes, G., and Reiskind, J.B. 2001. A CO2-flux mechanism operating via pH-polarity in Hydrilla verticillata leaves with C-3 and C-4 photosynthesis. Photosynth Res 68:81–88.
29 Gordon, D. 1998. Effects of Invasive, Non-Indigenous Plant Species on Ecosystem
Processes: Lessons From Florida. Ecological Applications. 8(4):975–989.
Granéli, W. and Solander, D. 1988. Influence of aquatic macrophytes on phosphorus cycling in lakes. Hydrobiologia. 170:245–266.
Guisan, A., Edwards, T.C., and Hastie, T. 2002. Generalized linear and generalized additive models in studies of species distributions : setting the scene. Ecological Modelling. 157:89-100.
Gunn, I.D.M., O’Hare, M., Carvalho, L., et al. 2010. Assessing the condition of lake habitats: a test of methods for surveying aquatic macrophyte communities. Hydrobiologia 656(1):87–97.
Haga, H., Ohtsuka, T., and Matsuda, M. 2007. Echosounding observations of coverage, height, PVI , and biomass of submerged macrophytes in the southern basin of Lake Biwa , Japan. Limnology 95–102.
Haller, W.T., Sutton, D.L., and W.C. Barlowe. 1974. Effects of salinity on growth of several aquatic macrophytes. Ecology. 55:891-894.
Haller, W.T. 2009. Mechanical Control of Aquatic Weeds. in: Aquatic Ecosystem
Restoration Foundation: Biology and Control of Aquatic Plants, A Best Management Practices Handbook (eds. Gettys, LA., Haller, W.T., and Bellaud, M.). 41-46.
Haller, W.T. and Sutton, D.L. 1975. Community structure and competition between Hydrilla and Vallisneria . Hyacinth Control J. 13:48-50.
Hansel-Welch, N., Butler, M.G., Carlson, T.J., et al. 2003. Changes in macrophyte
community structure in Lake Christina (Minnesota), a large shallow lake, following biomanipulation. Aquatic Botany. 75(4):323-337.
Hanson, M.A. and Butler, M.G. 1994. Responses to food web manipulation in a shallow waterfowl lake. Hydrobiologia. 279/280:457-466.
Hardion, L., Verlaque, R., and Saltonstall, K. 2014. Origin of the invasive Arundo donax (Poaceae): a trans-Asian expedition in herbaria. Annals of Botany. 114(3):455-462. Harlan, S. M., Davis, G. J., and Pesacreta, F. J. 1985. Hydrilla in Three North Carolina
Lakes. J. Aquat. Plant Manage. 23:68-71.
Hastie, T. and Tibsshirani, R. 1986. Generalized Additive Models. Statistics. 1(3):297-318. Hastie, T. J. and Tibshirani, R. J. 1990. Generalized Additive Models. Chapman and Hall,
London. 335.
Hastings, A., Clifton-Brown, J., Wattenbach, M. et al. 2008. Potential of Miscanthus grasses to provide energy and hence reduce greenhouse gas emissions. Agronomy for
30 Haug, E.J., Auell, S.M., Nawrocki, J.J., Hoyle, S.T., and Richardson, R.J. 2016. Monoecious
Hydrilla verticillata in North Carolina Lotic Systems. Presentation. In: Proceedings of the 17th Annual Northeast Aquatic Plant Management Society Meeting
(NEAPMS). Jan 12–14. Saratoga Springs, New York.
Havel, J.E., Kovalenko, K.E., Thomaz, S.M. et al. 2015. Aquatic invasive species: challenges for the future. Hydrobiologia. 750(1):147-170.
Havens, K.E. 2003. Submerged aquatic vegetation correlations with depth and light attenuating materials in a shallow subtropical lake. Hydrobiologia. 493:173–186. Havens, K.E., Bull, L.A., Warren, G.L., et al. 1996. Food Web Structure in a Subtropical
Lake Ecosystem. Oikos. 75(1):20-32.
Hearnden, M.N. and Kay, B.H. 1997. Importance of Hydrilla verticillata (hydrocharitaceae) as habitat for immature mosquitoes at the Ross River reservoir, Australia. Journal of the American Mosquito Control Association. 13(2):164—170.
Heck, K.L. and Crowder, L.B. 1991. Habitat structure and predator---prey interactions in vegetated aquatic systems. In: Bell SS, McCoy ED, Mushinsky HR (eds) Habitat Structure: The physical arrangement of objects in space. Springer Netherlands, Dordrecht. 281–299.
Herb, W. and Stefan, H. 2003. Integral growth of submersed macrophytes in varying light regimes. Ecological Modelling. 168:77-100.
Hestir, Erin.L., Khanna, S., Andrew, M.E., et al. 2008. Identification of invasive vegetation using hyperspectral remote sensing in the California Delta ecosystem. Remote Sensing of Environment. 112(11):4034-4047.
Holaday, A.S. and Bowes, G.. 1980. C4 acid metabolism and dark CO2 fixation in a submersed aquatic macrophyte (Hydrilla verticillata). Plant Physiol. 65:331-35. Hough, R. and Fornwall, M. 1988. Interactions of inorganic carbon and light availability as
controlling factors in aquatic macrophyte distribution and productivity. Limnology and Oceanography. 33(5):1202-1208.
Hough, R.A., Fornwall, M.D., Negele, B.J., et al. 1989. Plant community dynamics in a chain of lakes: principal factors in the decline of rooted macrophytes with eutrophication. Hydrobiologia. 173(3):199-217.
Houlahan, J. and Findlay, C. 2004. Effect of invasive plant species on temperate wetland plant diversity. Conservation Biology. 18(4):1132-1138.
31 Immell, D., Jackson, D.H., and Boulay, M.C. 2014. Home-Range Size And Subadult
Dispersal Of Black Bears In The Cascade Range Of Western Oregon. Western North American Naturalist, 74(3):343-348.
Impagliazzo, A., Mori, M., Fiorentino, N. et al. 2016. Crop growth analysis and yield of a lignocellulosic biomass crop (Arundo donax L.) in three marginal areas of Campania region. Italian Journal of Agronomy. 11:1-20.
Jowett, I. and Davey, A. 2002. A comparison of composite habitat suitability indices and generalized additive models of invertebrate abundance and fish presence–habitat availability. Transactions of the American Fisheries Society. 136(2):428-444. Karahancer, S.S., Eriskin, E., Sarioglu, O. et al. 2016. Utilization of Arundo donax in Hot
Mix Asphalt as a fiber. Construction and Building Materials. 125:981-986.
Keane, R. and Crawley, M. 2002. Exotic plant invasions and the enemy release hypothesis. Trends in Ecology and Evolution. 17(4):164-170.
Keast, A. 1984. The introduced aquatic macrophyte, Myriophyllum spicatum, as habitat for fish and their invertebrate prey. Canadian Journal of Zoology. 62(7):1289-1303. Khanna, S., Santos, M.J., Hestir, E.L., and Ustin, S.L. 2012. Plant community dynamics
relative to the changing distribution of a highly invasive species, Eichhornia crassipes: A remote sensing perspective. Biological Invasions. 14(3):717-733. Knipling, E. 1970. Physical and physiological basis for the reflectance of visible and
near-infrared radiation from vegetation. Remote Sensing of Environment. 1(3):155-159. Koop, A.L., Fowler, L., Newton, L.P. et al. 2012. Development and validation of a weed
screening tool for the United States. Biological Invasions. 14(2):273-294.
Kovalenko, K. and Dibble, E. 2014. Invasive macrophyte effects on littoral trophic structure and carbon sources. Hydrobiologia 721(1):23-34.
Kufel, L. and Kufel, I. 2002. Chara beds acting as nutrient sinks in shallow lakes - A review. Aquatic Botany. 72:249-260.
Lambert, A.M., Dudley, T.L., Saltonstall, K. 2010. Ecology and impacts of the large-statured invasive grasses Arundo donax and Phragmites australis in North America. Invasive Plant Science and Management. 3:489-494.
Lamon, E.C. III, Reckhow, K.H., and Havens, K.E. 1996 . Using generalized additive models for prediction of chlorophyll a in Lake Okeechobee, Florida. Lakes & Reservoirs: Research and Management 2:37-46.
32 Langeland, K.A. and Sutton, D.L. 1980. Regrowth of hydrilla from axillary buds. J. Aquat.
Plant Manage. 18:27-29.
Larson, K. 2015. GAM: The Predictive Modeling Silver Bullet. 1-27. http://multithreaded.stitchfix.com/blog/2015/07/30/gam/
Lauridsen, T.L., Jeppesen, E., and Andersen, F.Ø. 1993. Colonization of submerged macrophytes in shallow fish manipulated Lake Vamg: impact of sediment composition and waterfowl grazing. Aquatic Botany. 46(1):1-15.
Legendre, P. 1993. Spatial Autocorrelation: Trouble or New Paradigm?. Ecology. 74(6):1659-1673.
Lehmann, A. and Lachavanne, J.B. 1997. Geographic information systems and remote sensing in aquatic botany. Aquat Bot 58:195–207.
Lehmann, A. 1998. GIS modeling of submerged macrophyte distribution using Generalized Additive Models. Plant Ecology. 139:113-124.
Lehmann, A. and Lachavanne, J.B. 1997. Geographic information systems and remote sensing in aquatic botany. Aquat Bot 58:195–207.
Lehmann, A., Jaquet, J.M., and Lachavanne, J.B. 1994. Contribution of GIS to submerged macrophyte biomass estimation and community structure modeling, Lake Geneva, Switzerland. 47(2):99-117.
Lehmann, A., Jaquet, J.M., and Lachavanne, J.B. 1997. A GIS approach of aquatic plant spatial heterogeneity in relation to sediment and depth gradients, Lake Geneva, Switzerland. 58:347–361.
Lehmann, A., Overton, J.M., and Leathwick, J.R. 2002. Ecological Modelling. 157:189-207. Likens, G.E. 1975. Primary Production of Inland Aquatic Ecosystems. In: Lieth H, Whittaker
RH (eds) Primary Productivity of the Biosphere. Springer Berlin Heidelberg, Berlin, Heidelberg. 185–202.
Maceina, M.J. and Shireman, J.V. 1980. The use of a recording fathometer for determination of distribution and biomass of hydrilla. J. Aquat. Plant Manage. 18:34-39.
Maceina, M.J. and Shireman, J.V., Langeland, K.A. and Canfield J.R., D.E. 1984. Prediction of Submersed Plant Biomass by use of a Recording Fathometer. J. Aquat. Plant Manage. 22:35-38.
Madsen, J.D., Sutherland, J.W., Bloomfield, J.A., et al. 1991. The decline of native vegetation under dense Eurasian Watermilfoil canopies. J. Aquat. Plant Mange. 29:94:99.
33 Madsen, J.D. 1997. Methods for management of nonindigenous aquatic plants. In J.O. Luken
and J.W. Thieret, eds. Assessment and Management of Plant Invasions. New York: Springer. 145–171.
Madsen, J. D. 1999. Point intercept and line intercept methods for aquatic plant management. APCRP Technical Notes Collection (TN APCRP-M1-02). U.S. Army Engineer Research and Development Center, Vicksburg, MS. 1-17.
Madsen, T.V., Sand-Jensen, K. 1991. Photosynthetic carbon assimilation in aquatic macrophytes. Aquat Bot 41:5–40.
Madsen, T. and Sand-Jensen, K. 1994. The interactive effects of light and inorganic carbon on aquatic plant growth. Plant, Cell and Environment. 17:955-962.
Madsen, J.D., Sutherland, J.W., Bloomfield, J.A., et al. 1991. The decline of native vegetation under dense Eurasian Watermilfoil canopies. J. Aquat. Plant Mange. 29:94:99.
Madsen, J.D., Chambers, P.A., James, W.F. et al. 2001. The interaction between water movement, sediment dynamics and submersed macrophytes. Hydrobiologia. 444: 71. Mantineo, M., D'Agosta, G.M., Copani, V. et al. 2009. Biomass yield and energy balance of
three perennial crops for energy use in the semi-arid Mediterranean environment. Field Crops Research. 114(2):204-213.
Manuel, K.L., Kirk, J.P., Barwick, D.H, et al. 2013. Hydrilla Management in Piedmont Reservoirs Using Herbicides and Triploid Grass Carp: A Case Study. North American Journal of Fisheries Management. 33(3):488-492.
Mariani, C., Cabrini, R., Danin, A. et al. 2010. Origin, diffusion and reproduction of the giant reed (Arundo donax L.): A promising weedy energy crop. 157(2):191-202.
Martin, S., Nicolas, H., Bottner, B., et al. 2010. Mapping and Monitoring of an Aquatic Invasive Plant (Ludwigia grandiflora) with Multispectral Remote Sensing in a Large Wetland in West of France.Presented at International Symposium on Aquatic Plants - Plants in hydrosystems: from functional ecology to weed research, Poznan, POL (2012-08-27 - 2012-08-31).
Meadows ST, Richardson RJ. 2012. Competition of monoecious hydrilla with other submersed macrophytes. Abstract. In: Proceedings of the 52nd Annual Meeting Aquatic Plant Management Society (APMS), July 22–25, Salt Lake City, UT. Meitzen, K. 2016. Stream flow changes across North Carolina (USA) 1955-2012 with
implications for environmental flow management. Geomorphology 252:171-184. Melzer, A. 1999. Aquatic macrophytes as tools for lake management. Hydrobiologia
34 Middelboe, A.L. and Markager, S. 1997. Depth limits and minimum light requirements of
freshwater macrophytes. Freshwater Biology. 37(3):553-568.
Milner, A.M., Brittian, J.E., Castellas, E., et al. 2001. Trends of macroinvertebrate
community structure in glacier-fed rivers in relation to environmental conditions: a synthesis. Freshwater Biology. 46:1833-1847.
Mitchell, A. 2005. The ESRI Guide to GIS Analysis: Spatial Measurements and Statistics. ESRI Press. 2:1-252.
Moran, P.A.P. 1950. Notes on Continuous Stochastic Phenomena. Biometrika. Oxford University Press. 37:17-23.
Morton, R. and Henderson, B. 2008. Estimation of nonlinear trends in water quality: An improved approach using generalized additive models. Water Resources Research. 44(7):1-11.
Moss, B., Jeppesen, E., Søndergaard, M., et al. 2013. Nitrogen, macrophytes, shallow lakes and nutrient limitation: resolution of a current controversy? Hydrobiologia. 710:3–21. Murphy, K. 1988. Aquatic weed problems and their management: a review. II. Physical
control measures. Crop Protection. 7(5):283-302.
Naik, S.N., Goud, V.V., Rout, P.K., and Dalai, A.K. 2010. Production of first and second generation biofuels: A comprehensive review. Renewable and Sustainable Energy Reviews. 14:2. 578-597.
Nassi o Di Nasso, N., Roncucci, N., and Bonari, E. 2013. Seasonal dynamics of aboveground and belowground biomass and nutrient accumulation and remobilization in giant reed (Arundo donax L.): a three-year study on marginal land. Bioenerg. Res. 6:725-736. Nawrocki, J.J. 2011. Environmental and Physiological Factors Affecting Submersed Aquatic
Weed Management . MS thesis. North Carolina State University. Raleigh, NC. http://www.lib.ncsu.edu/resolver/1840.16/7126.
Nelson, K. 1998. Catch-and-release mortality of striped bass in the Roanoke River, North Carolina. North American Journal of American Fisheries Management 18(1988):25-30.
Nelson, S.A.C., Cheruvelil, K.S., and Soranno, P.A. 2006. Satellite remote sensing of freshwater macrophytes and the influence of water clarity. Aquat Bot 85:289–298. Netherland, M.D. 2009. Chemical Control of Aquatic Weeds. in: Aquatic Ecosystem
Restoration Foundation: Biology and Control of Aquatic Plants, A Best Management Practices Handbook (eds. Gettys, LA., Haller, W.T., and Bellaud, M.). 65-78.
35 Olsen, J.L., Rouzé, P., Verhelst, B., et al. 2016. The genome of the seagrass Zostera marina
reveals angiosperm adaptation to the sea. Nature. 530:331-335.
Palminteri, S. and Peres, C.A. 2012. Habitat Selection and Use of Space by Bald-Faced Sakis (Pithecia irrorata) in Southwestern Amazonia: Lessons from a Multiyear, Multigroup Study. International Journal of Primatology. 33(2):401-417.
Parcell, J.L. and Westhoff, P. 2005. Economic effects of biofuel production on states and rural communities. Journal of Agricultural and Applied Economics. 38(2):337 - 387. Parochetti, J., Arsenovic, M., Getsinger, K., et al. 2008. Addressing the need for herbicides
for aquatic weeds in irrigation water in the US. Outlooks on Pest Management. 19(3):112-116.
Peñuelas, J., Gamon, J.A., Griffin, K.L., et al. 1993. Assessing community type, plant biomass, pigment composition, and photosynthetic efficiency of aquatic vegetation from spectral reflectance. Remote Sens Environ 46(2):110–118.
Peñuelas, J., Filella, I., Gamon, J.A., et al. 1997. Assessing photosynthetic radiation-use efficiency of emergent aquatic vegetation from spectral reflectance. Aquat Bot 58(3-4):307–315.
Perdue, R.E. Jr. 1958. Arundo donax - Source of musical reeds and industrial cellulose. Econ. Bot. 12:368-404.
Petr, T. 2000. Interactions between fish and aquatic macrophytes in inland waters. A review: FAO fisheries technical paper. FAO. Rome, Italy. 396:185.
Pilu, R., Bucci, A., Badone, F.C., and Landoni, M. 2012. Giant reed (Arundo donax L.): A weed plant or a promising energy crop? Afr. J. Biotchnol. 11(38):9163-9174.
Pimentel, D., Zuniga, R., and Morrison, D. 2005. Update on the environmental and economic costs associated with alien-invasive species in the United States. Ecological
Economics. 52:273-288.
Pimentel, D., Lach, L., Zuniga, R., et al. 2000. Environmental and economic costs of nonindigenous species in the United States. Bioscience 50(1):53–65.
Ploskey, G. 1981. Factors affecting fish production and fishing quality in new reservoirs, with guidance on timber clearing, basin preparation and filling. Environmental and Water Quality: Technical Report. U.S. Fish and Wildlife Service. 1-68.
Polunin, O. and Huxley, A. 1987. Flowers of the Mediterranean. Hogarth Press, London. Quinn, G.P., Lake, P.S., and Schreiber, E.S.G. 1996. Littoral benthos of a Victorian lake and