A N U M E R IC A L S IM U L A T IO N AND V IS U A L IZ A T IO N OF BLOOD F L O W TH RO U G H A STENOSED A R T E R Y W IT H THE D IFFERENT SE V E R ITY
Siti Zulaiha Binti Abd Rahim & Dr. Norzieha Binti Mustapha
1.1 IN TR O D U C TIO N
The cardiovascular system consist of the heart and blood vessels that carrying blood in whole human bodies. The heart is a vital organ in the human body. The heart disease is the most common chronic disease o f the coronary arteries is called atherosclerosis. Atherosclerosis occurs when a build-up o f plaque or cholesterol deposits on artery walls. Over time, plaque can accumulate, harden and narrow the arteries and impede blood flow to the heart. Coronary artery disease or coronary artery disease (CAD) is the basically can caused heart attacks, strokes, various heart disease including congestive heart failure and most cardiovascular disease in general. A blockage in one or more coronary arteries can cause heart attack suddenly.
In addition, diseased arteries also tend to experience sudden muscle contractions. Thus, a piece o f a blood crust can form a contraction, release chemicals which then result in narrowing the artery wall, triggering a heart attack. I f the working system o f the heart is damage, the normal rhythm o f the heart can become chaotic and the heart began to tremble with uncertainty or experiencing fibrillation. This abnormal rhythm known as arrhythmia is a deviation from the normal heart rhythm. This will cause the heart’ s ability to pump blood effectively to the brain.
1.2 LIT E R A T U R E R E V IE W
1.2.1 Atherosclerosis
Atherosclerosis is a disease affecting arterial blood vessels (as well as veins that have been surgically moved to function as arteries). A stenosed artery is the result o f atherosclerosis that is hardening o f the artery due to the growth o f a calcified plaque layer on the inner walls o f the artery (Layak et al., 2007). Stenosis is defined as a partial occlusion o f the vessels caused by abnormal growth o f tissues o f the deposition o f cholesterol as substances on the arterial wall.
(2011), Minagar et al. (2006) have been carried out a studies to understand the effects o f double stenoses on blood circulation in the arteries. However, Ang and Mazumdar (1995) worked on triplet stenoses and their research presented that multiple stenoses have more significant effects on blood flow compared to the sum of the consequences o f the individual stenoses.
In fact, the geometry o f the stenosis is irregular. Dasgupta et al. (2010) observed a few irregular geometries o f plaque and the most prevalent one was the Cosine shape geometry. Mustapha et al. (2010) carried out a numerical simulation o f unsteady blood flow through multi irregular arterial stenoses. In their study, they solved numerically the governing equations with boundary conditions by M AC (Marker and Cell) method and the pressure-Poisson equation has been solved by successive-over-relaxation (SOR). The flow pattern reveals that the separation Reynolds number for the multi-irregular stenoses is lower than those for cosine-shaped stenoses and a long single irregular stenoses, obtained from their study.
1.2.2 Marker and Cell (M A C ) Method
The M AC method is a finite difference solution technique for investigating the dynamics of an incompressible viscous fluid.The original Mac method was solved on an Eulerian grid and the free surface was defined by whether a cell contained fluid or did not contained.It was said to contained fluid if the cell contained one or more marker particles and it was defined to be empty i f it had no marker particles. Marker and cell accurate resolution o f interface (and free surface) by accurately determining the surface normal and curvature, by Sousa et
al., 2004.
1.2.3 The Governing Equations
The governing equation for blood flow are the continuity and momentum conservation equations (Sidik (2013)). The governing equations o f Newtonian model are stated as follows:
dw d ( u r)
r a F + ~ = 0
du du2 d(uw) u 2 1 dp u
+ + —— + — = +
-dt dr dz r p dr p
d2u 1 du d2u
d r 2 + r dr + dz2 u
dw d(uw) dw2
dt + dr
dw2 uw 1 dp u
+ + — = +
-dz r p dz p
d2w 1 du d2u
+ - — + ■
d r 2 r dr dz2 + G( t)
Where u (r, z, t ) is the radial velocity component, w(r, z, t ) is the axial velocity component. Next, p and ^ is the density and viscosity o f blood respectively. Lastly, G ( t ) represented as body force. In present study, we consider G (t) = 0.
The boundary and initial condition are given by:
u (r, z , t ) = 0 , w(r, z , t ) = 0
dw(r, z, t) u (r, z , t ) = 0 , --- = 0
dr for r = 0
u ( r , z , t ) = 2(1 — —) , w ( r , z , t ) = 0 for z = 0
d u ( r , z , t ) d u ( r , z , t )
= 0 = ---for z = L
dz dz
u (r, z, t ) = 0, w(r, z, t ) = 0, p(r, z,0) = 0 for z > 0
1.3 SO LU TIO N PROCEDURE
1.3.1 Geometry of The Stenosis
The graph o f stenosis was plotted using Matlab programme. According to Mustapha (2008), the geometry of the stenosis is assumed to be manifested in the arterial segment is described as:
5 /i , ( n ( z — S i)
R ( z ) = r —i [ 1 + c o s ( —
r0 , otherwise
y
0
— ^7(1
+ cos ( ---- —--- ) ) , 51 — Z i < z < Si + Z iwhere R (z ) and r0 are the radius o f the artery with and without stenosis, respectively. Z 1 is the length o f the stenosis and S1 indicates its location, S is the severity o f the stenosis.
1.3.2 Derivation of Governing Equation
The governing equation for continuity equation becomes as:
dH H dw
The governing equations for r -component and z-component o f momentum together with continuity in non-conservative form written as follows:
da H dw
dr r dz
da da da
1
dp /d2a1
da d2a adt dr dz p d f \ d r2 r dr dz2 f 2
dw dw _ d w 1dp ( d 2w 1dw d2w
■ + u —= + w — r = ----— + + —~—r +
dt dr dz p dz \ d r 2 r dr dz2
denoted 0. and w are the axial and radial velocity components, respectively. While p is the pressure and v=^ , ^ as the viscosity o f blood.
The boundary condition and sometime initial conditions, dedicate the particular solution to be obtained from the governing equation.
dw(r, z, t)
u(r, z , t ) = 0 , --- = 0 for r = 0
dr
u(r, z , t ) = 0 , w(r, z , t ) = 0 for t = 0
u ( r , z , t ) = 2(1 — ^ ), w ( r , z , t ) = 0 for z = 0
R
1.3.3 Non-dimensionalization of the Equation
The following dimensionless variables are considered as:
_ U r z w u p R
t = t ~o’ r = ~a'Z = ~o’ W = U ,U = U ,V = W * , R = ~o
Then, all the non-dimensionalization equations are stated as below:
du u dw
---= 0
dr r dz
du du du dp 1 /d2(u ) 1 du d2u u
dt + U dr + W dz dr + Re ( d r 2 + r dr + dz2 r 2
dw dw dw dp 1 /d2w 1dw d2w
dw(r, z, t) u(r, z , t ) = 0 , --- = 0
o r for r = 0
u ( r , z , t ) = 2(1 — —), ux ( r , z , t ) = 0 for z = 0
u (r, z , t ) = 0 , w(r, z , t ) = 0
1.3.4 Radial Coordinate Transformation
The radial coordinate transformation is given by
x =
R(z, t)
Simplifying all the radial coordinate transformation, gives:
1 du u dw x dw dR
R ' dx + xR + dz R dx dz
du 1 dp 1
dt R d x R
+
—u + wx
1
dR du du
ReR2
dz
1 + ( x
---w —
dx dz
dR\2) d 2u (1 /dR
W \ a P + { - + 2xQ 2
u + —
X2
xRd2R + R2d2u
dz2 \ dx dz2
dw dp 1
dt dz + R —u + wx
dR dw dw
+ ReR2
dz
1 + \x
---w —
dx dz
dR\2) d 2w (1 (dR
xRd2RI dw+ R2d2w
dz2 ( dx dz2
The non-dimensionalization o f the boundary and initial conditions becomes:
w(z, x, t ) = 0, u(z, x , t ) = 0 for x = 1
dw(z,x,t)
dx = 0, u(z, x , t ) = 0 for x = 0
w(z, x, 0) = u(z, x, 0), p(x, z,0) = 0 for z > 0
The governing equation with the boundary condition can be solved numerically by using finite difference method, finite volume method, finite element method, FIDAP (CFD package), marker and cell (M AC ) and successive-over-relaxation (SOR).
r
1.3.5 Graphical User Interface (G U I)
The equations are solved by using the existing Matlab programming and the result will visualized it by using GUI.A graphical user interface (GUI) is one o f tools in Matlab programming used to visualize the results. The process o f GUI development are stated as below:
1. Design o f GUI and start GUIDE
2. Choose, rearrange and set properties o f the components 3. Save and generate file: Code file and FIG-file
4. Add code for components in Callbacks (Code file) and run 5. Compile by using Matlab Compiler (Standalone application)
1.4 N U M E R IC A L RESULTS AND DISCUSSION
1.4.1 The Geometry of the Stenosis
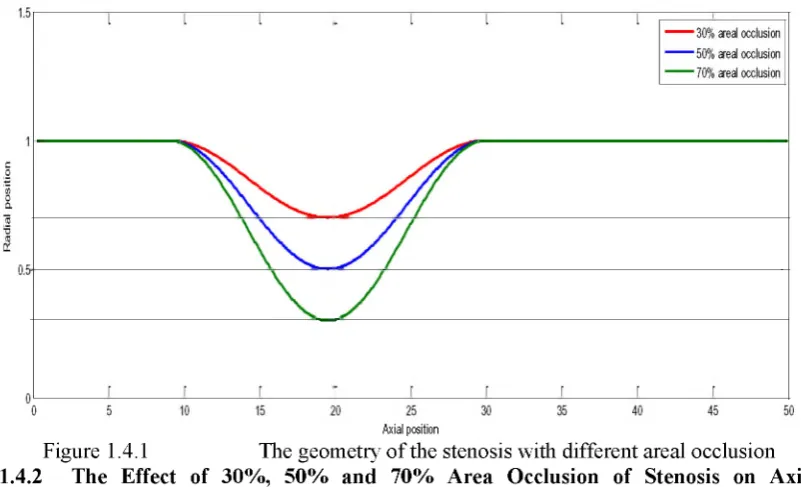
Figures 1.4.1 shows the geometry o f the stenosis on 30%, 50% and 70% area occlusion respectively. It is noticed that the stenosis reaches its critical height at the position z = 20.0.
A x ia l p o s itio n
Figure 1.4.1 The geometry o f the stenosis with different areal occlusion 1.4.2 The Effect of 30%, 50% and 70% Area Occlusion of Stenosis on Axial
Figure 1.4.2(a) - 1.4.2(f) shows how a stenosed artery with 30%, 50% and 70% areal occlusion influences the pattern o f the flow field at the lowest and highest Reynolds number, respectively.
Figure 1.4.2(a) The axial velocity profile at different radial position with 30% area occlusion at Re=100
D im e n s io n le s s a x ia l v e lo c it y D im e n si o n le ss a x ia l p o s it io n
Figure 1.4.2(c) The axial velocity profile at different radial position with 50% area occlusion at Re=100
Dim ensionless radial position
D im e n s io n le s s a x ia l v e lo ci ty D im e n s io n le s s a x ia l v e lo c it y
Figure 1.4.2(e) The axial velocity profile at different radial position with 70% area occlusion at Re=100
Figure 1.4.2(f) The axial velocity profile at different radial position with 70% area occlusion at Re=1000
substantially at higher Reynolds number. Besides that, the negative value velocity show there exist the back flow in artery after blood passed through the stenosed area (z=30.00 and z=37.50).
1.4.3 The Effect of 30%, 50% and 70% Area Occlusion of Stenosis on Wall Shear Stress with Different Reynolds Number
The illustrations on the wall shear stress effected by a stenosed artery with 30%, 50% and 70% area o f occlusion at Re=100 and Re=1000 shows in Figure 1.4.3(a) until Figure 1.4.3(f) respectively.
D im ensionless axial position
D
im
e
n
s
io
n
le
s
s
w
al
l
sh
e
a
r
s
t
r
e
s
s
Figure 1.4.3(b) The wall shear stress of a stenosed artery with 30% area occlusion at Re=1000
D im ensionless axial position
_101_ _ _ _ _ _ _ _ _ _ _ I_ _ _ _ _ _ _ _ _ _ _ I_ _ _ _ _ _ _ _ _ _ _ I_ _ _ _ _ _ _ _ _ _ _ I_ _ _ _ _ _ _ _ _ _ _ I_ _ _ _ _ _ _ _ _ _ _ I_ _ _ _ _ _ _ _ _ _ _ I_ _ _ _ _ _ _ _ _ _ _ I—
5 10 15 20 25 30 35 40 45
Dimensionless axial position
Figure 1.4.3(d) The wall shear stress o f a stenosed artery with 50% area occlusion at Re=1000
Dim ensionless axial position
Figure 1.4.3(f) The wall shear stress o f a stenosed artery with 70% area occlusion at Re=1000
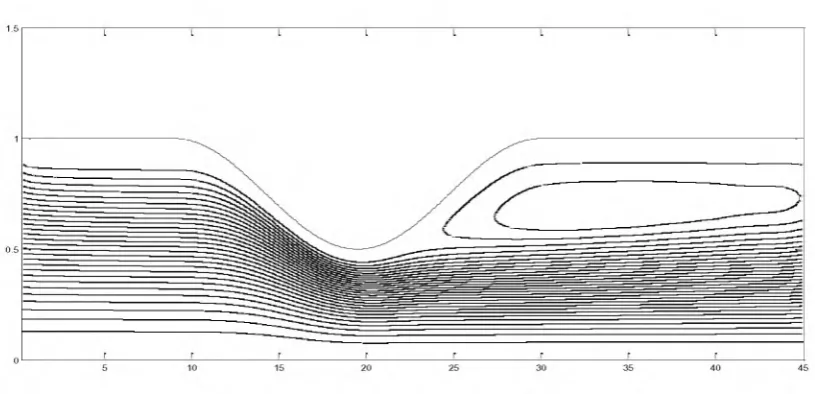
The graphs shows that the high Reynolds number has high wall shear stress compared to lower Reynolds number. The wall shear stress also increased i f the area occlusion become larger.As the area occlusion increase, the recirculation region become large. So that, it can conclude that the larger separated region occur for more severe stenosis and highest Reynolds number.
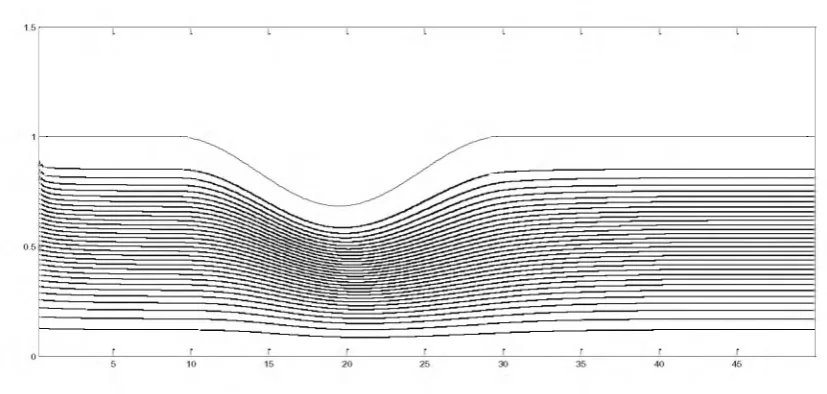
1.4.4 The Effect of 30%, 50% and 70% Area Occlusion of Stenosis on Pattern Streamlines with Different Reynolds Number
Figure 1.4.4(a) The pattern o f streamlines for a stenosed artery with 30% area occlusion at Re=100
Figure 1.4.4(c) The pattern o f streamlines for a stenosed artery with 50% area occlusion at Re=100
Figure 1.4.4(e) The pattern o f streamlines for a stenosed artery with 70% area occlusion at Re=100
Figure 1.4.4(f) The pattern o f streamlines for a stenosed artery with 70% area occlusion at Re=1000
1.4.5 The Visualization of Blood Flow through a Stenosed Artery
The figures below show the visualization o f blood flow through a stenosed artery. All the result on blood flow through a stenosed artery obtained are visualized by using Graphical User Interface (GUI) in Matlab programming.
- D e s k to p D i
H o m e S h a re
T X
C o p y P a s te
C lip b o a r d
▼ 'I s | H D e s k t o p
F a v o r it e s
D e s k t o p
li. D o w n l o a d s
yjy’.l R e c e n t p la c e s
3 * P T h is P C
M D e s k t o p
_ D o c u m e n t s ig . D o w n l o a d s
M u s i c v
7 6 i t e m s 1 i t e m s e l e c t e d
^ M o v e t o D e le t e
IM IQS '
|01 C o p y t o - R e n a m e N e w f o l d e r
P r o p e r t ie s
O r g a n i z e O p e r
Cj S e a r c h D e ... P
f t
/
Click
G U I s t a n d a lo n e
Hi G U I W o r k s h o p
Open the ‘ GUIstandalone’ file
a i
tu
Favorites H Desktop
Downloads Recent places
[ j | i Move to " 1 ySl Copy to »
Delete — Rename
t i '43* New folder
o
Properties
m * ' I-M Select all So Select none rifS Invert selection Organize New Oper Select « Visualizatioin ►GUIstaridalone ►distrib - C/ Search dis... >3
Network
A Num erical Sim ulation and Visualization of Blood Flow Through a Stenosed Artery with The Different Severity
The Effect on Axttl Velocity Profile with Otflerflfll Seventy ol Stefio ns and Reynolds Number
sm ZUl AHIA DIMTI ADD RAHIM •2122MMm
RACHFI OR O f SOFMCF (UATFHAUATIf S)
The Effect of Dfflerent Reynolds Humber on Axial Velocity IM S Areal Occlusion)
Click
The Effect ol Different Reynolds Number on Wall Shear s tr e s s (64% Areal Occlusion)
OR. NOR/IF HA BINTI MIJSTAPHA
■ H Click on any button
1.5 CO NCLUSIO N
First we have discussed the result for axial velocity profile, wall shear stress and flow rate for 30%, 50% and 70% area o f occlusion for lower and higher Reynolds number. From the results obtained, we can conclude that the more severe stenoses will give more effect on blood flow. Secondly, we have investigated that when Reynolds number is high, many flow separation will occurs and effect the flow rate.Lastly, we have visualized all the results obtained by using Graphical User Interface (GUI). GUI are ease o f use to visualize the results, higher productivity and better accessibility. GUI is the basic tools use to visualize the results before develop a software.
REFERENCES
Ang, K.C. and Mazumdar, J. (1995). Mathematical modelling o f triple arterial strenoses.
Australian Physical and Engineering Sciences in Medicine. 18(2): 89 - 94.
Dasgupta, K., Chanda, A., Choudhury, A.R., and Nag, D. (2010). Geometry & Hemodynamics o f Arterial Stenosis: a Clinical and Computational study. Proceeding o f
2010 International Conference on System in Medicine and Biology, India.
Layak, G.C., Midya, C. (2007). Effect o f Constriction Height on Flow Seperation in a Two dimensional Channel. Journal on Cummunications in Nonlinear Science and Numerical
Simulation., 754 - 759.
Minagar, A., Jimenez, J.J. and Alexander, J.S. (2006). Multiple sclerosis as a vascular disease. Neurological Research. 3: 230 - 235.
Mishra, B.K., & Verma, N. (2010). Effect o f stenosis on Non-Newtonian Flow o f Blood in Blood Vessels. Australian Journal o f Basic and Applied Sciences, 4(4), 588 - 601.
Mustapha, N., Mandal, P.K., Johnston, P.R. and Amin, N. (2010). A Numerical Simulation o f Unsteady Blood Flow through Multi-Irregular Arterial Stenoses. Applied Mathematical
Modelling. 34: 1559 - 1573.