CARLTON, NIGEL PATRICK. Effective Methods for the Evaluation of Thermal Protective Performance of Firefighter Protective Hoods (Under the direction of Dr. R. Bryan Ormond and Dr. Roger L. Barker).
In recent years, firefighting and cancer have become nearly synonymous with one another. To combat the infiltration of the possibly carcinogenic materials in soot and smoke, an optional particulate blocking layer has been added to the firefighter protective hoods in the NFPA 1971 standard which governs the protective equipment of structural firefighters. However, the performance of these materials under flashover conditions must be evaluated first and foremost. There are several test methods that evaluate the performance of materials and garments under flashover conditions, but these test methods must also be evaluated for efficacy and efficiency of their procedures and results.
Firefighter protective hood materials and composites were tested using two bench-level thermal protective performance test methods. These were used to evaluate a material’s and composite’s performance under flashover conditions. The first test method used was with a continuous exposure until predicted second-degree burn while the second involved an abbreviated exposure with continued data collection until a predicted second-degree burn is realized. These methods showed that the addition of a particulate blocking layers increases the thermal protective performance of composites. Thickness and weight also were shown to have a significant effect on thermal protective performance.
procedure had to be determined for effective evaluation. After rounds of testing and evaluation, the suggested testing procedure for testing firefighter protective hoods on PyroHead™ was to follow ASTM F1930 and test just the hood on the head form at seven seconds and run five replicates.
by
Nigel Patrick Carlton
A thesis submitted to the Graduate Faculty of North Carolina State University
in partial fulfillment of the requirements for the degree of
Master of Science
Textile Engineering
Raleigh, North Carolina 2019
APPROVED BY:
_______________________________ _______________________________ Dr. R. Bryan Ormond Dr. Roger L. Barker
Committee Co-Chair Committee Co-Chair
DEDICATION
First and foremost, this research is dedicated to and intended for our men and women in not only the fire service, but our first responders and military personnel whom put their lives on the line every day for ideas of safety, liberty, justice and freedom. My only hope is that this research is able to assist you in some way, shape, or form while you are protecting these ideologies.
More thanks are due to the following people have also made a significant impact on my life, well-being, drive and continued success as an individual:
• My mom, Barbara, whom through it all, loved, taught, challenged and shaped four young people to be the best versions of themselves. We will forever be thankful for being brought into this world by such a woman whom we are slowly finding traits about ourselves that are exactly like her.
• My dad, A. Nigel, whom taught us discipline and accountability through three simple rules: “mind, do your homework and listen to your momma.”
• My siblings, whose annoyance and admiration taught me that someone is always watching and looking up to you, so always set a good example.
• My friends and roommates in Raleigh, who distracted me from my studies more than I needed but less than I wanted.
• My a cappella groups, Acappology and Triadic, who gave me an outlet from the everyday and allowed me to add diversity to my life and friends.
• Brooke, who always showed her dedication and support, no matter the situation or circumstance.
BIOGRAPHY
Nigel (phonetically: nɪgɛl, not traditional British pronunciation) Patrick Carlton was born on November 22, 1994 to A. Nigel (same pronunciation) and Barbara Carlton in Burlington, NC. Nigel is the eldest of four children. His brother Mendé, is four years younger and his twin sisters, Lauryn and Silken, are six years younger. Nigel grew up in an athletic household and participated in a combination of American football, basketball, and baseball up through his time at Western Alamance High School. Nigel went to The North Carolina State University for his undergraduate degree in pursuit for an engineering degree of some sort.
ACKNOWLEDGMENTS
My journey through graduate school would not have been possible without the help and confidence of Dr. Bryan Ormond. If he did not believe that every interaction is an interview, then I may not have been able to have the unique opportunity to work and learn in a place such as the Textile Protection and Comfort Center. You are invaluable to not only TPACC but also the Wilson College of Textiles and NC State as a whole. The way you are able to understand the needs of your research and students while also using undeniable experience and logic to drive your decisions should not go overlooked and will propel you forward for years to come. You have been a true friend and mentor and I can only hope that your future students will appreciate you as much as I have the past two years.
TABLE OF CONTENTS
LIST OF TABLES ... viii
LIST OF FIGURES ... x
LIST OF EQUATIONS ... xiii
CHAPTER 1: Introduction and Proposal ... 1
1.1. Purpose ... 1
1.2. Research Objectives ... 2
CHAPTER 2: Firefighting Tactics and Personal Protective Equipment ... 3
2.1. Evolution of Tactics ... 3
2.1.1. Cohorts of the Watchmen ... 3
2.1.2. Middle Ages Europe ... 4
2.1.3. American Colonization through Industrial Revolution ... 4
2.1.4. Layman versus Modern Tactics ... 5
2.2. Changes in Turnout Gear ... 8
2.2.1. Legacy Turnout Gear ... 9
2.2.2. Modern Structural Turnout Gear ... 11
2.3. Protective Hoods ... 12
2.3.1. NFPA 1971-18 Hood Requirements ... 13
2.3.2. Response to Hoods ... 16
2.3.3. Cancer Problem ... 18
2.4. Protective Hood Materials ... 22
2.4.1. Aramids ... 22
2.4.2. Fire-Resistant Viscose Rayon ... 26
2.4.3. Oxidized Polyacrylonitrile (OPAN) ... 28
2.4.4. Polybenzimidazole (PBI) ... 29
CHAPTER 3: Skin and Thermal Protection ... 33
3.1. Skin Burns ... 33
3.2. Skin Burn Models ... 34
3.2.1. Studies of Thermal Injury – Henriques ... 35
3.2.2. Stoll Curve ... 36
3.3. Bench-Level Test Methods ... 38
3.3.1. ISO 17492 ... 38
3.3.2. ASTM F2703 ... 40
3.4.1. PyroMan™ Fire Test System ... 41
3.4.2. PyroHands™ Fire Test System ... 43
3.5. PyroHead™ Fire Test System ... 45
3.5.1. Overview ... 45
3.5.2. Burn Model Parameters – Head Skin Thicknesses ... 46
3.5.3. Military Flash Hood Testing ... 47
CHAPTER 4: Bench-Level Thermal Protective Performance Testing on Firefighter Protective Hood Materials ... 50
4.1. Introduction and Background ... 50
4.2. Materials and Methods ... 50
4.3. Results and Discussion ... 54
4.3.1. Full Results ... 54
4.3.2. Addition of Particulate-Blocking Layer... 55
4.3.3. Effect of Rayon ... 59
4.4. Conclusions ... 61
CHAPTER 5: Determining a Standard Testing Procedure for Testing Firefighter Protective Hoods on PyroHead™ Fire Test System ... 62
5.1. Introduction and Background ... 62
5.2. Materials and Methods ... 62
5.2.1. Materials ... 62
5.2.2. Methods... 65
5.3. Results and Discussion ... 67
5.3.1. Determining Exposure Time ... 67
5.3.2. Determining a Mounting Configuration ... 69
5.3.3. Determining Number of Replicates ... 72
5.4. Conclusions ... 75
CHAPTER 6: Testing of Firefighter Protective Hoods on PyroHead™ Fire Test System using Determined Standard Testing Procedure ... 77
6.1. Introduction and Background ... 77
6.2. Materials and Methods ... 77
6.2.1. Materials ... 77
6.2.2. Methods... 79
6.3. Results and Discussion ... 80
CHAPTER 7: Comparison of Bench-Level Flashover Exposure Test Methods to
PyroHead™ Fire Test System... 86
7.1. Introduction and Background ... 86
7.2. Materials and Methods ... 86
7.3. Results and Discussion ... 86
7.4. Conclusions ... 89
CHAPTER 8: Conclusions and Future Works ... 90
8.1. Bench-Level Conclusions ... 90
8.2. PyroHead™ Conclusions ... 90
8.3. Suggestions for NFPA 1971 ... 91
8.3.1. Certification Testing ... 91
8.3.2. The Certifying TPP Rating ... 92
LIST OF TABLES
Table 2.1: Descriptions of the divisions of firefighting tactics as described by Layman [5]...6
Table 2.2: Description of the divisions of firefighting tactics as described by NFPA [7]. ... 7
Table 2.3: Compares the Modern NFPA tactical divisions with their origin Layman divisions [6], [7]. ... 8
Table 2.4: Outlines the turnout gear components and their governing sections in NFPA 1971, descriptions, and popular materials used in each component [12]-[15]. ... 12
Table 2.5: Mandatory protective hood performance requirements described in NFPA 1971-18 [12]. ... 15
Table 2.6: Protective hood requirements for the optional protective barrier hoods described in NFPA 1971-18 [12]. ... 15
Table 2.7: Likelihood of Cancer Risk and Summary Risk Estimate for different types of cancers [19]. ... 20
Table 2.8: Properties of para-aramid fibers [24]-[27]. ... 24
Table 2.9: Properties of meta-aramid fibers [24], [26], [27]. ... 26
Table 2.10: Properties of Fire-Resistant Viscose Rayon [30], [31]. ... 27
Table 2.11: Properties of oxidized polyacrylonitrile (OPAN) [30]. ... 29
Table 2.12: Properties of Polybenzimidazole Fiber [26], [33], [37]-[39]. ... 31
Table 2.13: Physical property comparison of high performance fibers used in firefighter protective hoods. ... 32
Table 3.1: Estimated values of the depth of the different layers of skin at different areas around the head, face and neck compared to the estimated values used in ASTM F1930. ... 47
Table 4.1: An explanation as to what each material and composite was composed of in this study. ... 52
Table 4.3: All bench-level test method material results. Where the ISO 17492 test method is the continuous heating TPP method, and the ASTM F2703 test method is the abbreviated heating TPP method. ... 54
Table 4.4: Regression R2 values of material properties with test results. ... 59
Table 5.1: Table outlining the compositions of the hoods used in the STP studies. ... 64 Table 5.2: Number of random data sets generated for each sample size. ... 73 Table 6.1: A description of the hoods in use and what their layering looks like, where the
LIST OF FIGURES
Figure 2.1: Typical turnout gear for firefighters around the 1950s, including rubber trench
coat and three-quarter length rubber boots [9]. ... 10
Figure 2.2: An indirect method of attack through a corner of a window while the nozzleman makes sure they are keeping below the opening to avoid escaping smoke and steam [6]. ... 10
Figure 2.3: Shows the turnout ensemble from the chest up to the head with a protective hood being utilized, concealing any skin from environmental exposure. ... 13
Figure 2.4: Shows turnout ensemble from the chest up to head without a protective hood being utilized, exposing skin around the neck to environmental exposure. ... 13
Figure 2.5: Before and After photos of the head and neck areas showing particle penetration produced from the Fluorescent Aerosol Screening Test performed by RTI International in 2015 [65]. ... 21
Figure 2.6: Comparison of normal polyamides versus aromatic polyamides [62]. ... 22
Figure 2.7: Chemical structure of the para-aramid polymer [21]. ... 23
Figure 2.8: Chemical structure of the meta-aramid polymer [21]. ... 25
Figure 2.9: Chemical structure of the Exolit® 5060 FR additive [29]. ... 27
Figure 2.10: Chemical structure change of PAN into OPAN after oxidation [63]. ... 28
Figure 2.11: Original preferred polybenzimidazole as discussed by Clark and Maxwell [35]. .... 30
Figure 2.12: Poly-2,2'-(m-phenylene)-5,5'-bibenzimidazole [33]. ... 30
Figure 3.1: Illustrations of the layers of normal, healthy skin versus skin that has suffered from first, second, and third-degree burns [64]. ... 34
Figure 3.2: Stoll curve that models second-degree burns at varying levels of exposure at different durations [49]. ... 37
Figure 3.3: Visualization of Equation 3.2 and where the burn/no burn criterion lies on the resultant raw data graph. ... 37
Figure 3.4: TPP testing device in use. ... 39
Figure 3.5: Chart showing that the intersection of the Stoll curve and temperature data results in a predicted second degree burn for an ISO 17492 test. ... 39
Figure 3.7: The mounted PyroMan™ Fire Test System in use [49]. ... 42 Figure 3.8: Typical display after a PyroMan™ test where yellow indicates No Burn, red
indicates Second-Degree Burn and purple indicates Third-Degree Burn [49]. ... 43 Figure 3.9: The mounted PyroHands™ Fire Test System [49]. ... 44 Figure 3.10: Typical display after a PyroHands™ test where yellow indicates No Burn, red
indicates Second-Degree Burn and purple indicates Third-Degree Burn [49]. ... 44 Figure 3.11: The mounted PyroHead™ Fire Test System. ... 45 Figure 3.12: Typical display after a PyroHead™ test where yellow indicates No Burn, red
indicates Second-Degree Burn and purple indicates Third-Degree Burn. ... 46 Figure 3.13: Graph showing that the results of the effect of exposure time on the PyroHead™ test
during its development [51]. ... 48 Figure 3.14: Graph showing that the results of the predicted standard error for multiple burns
on the PyroHead™ fire Test System [51]. ... 49 Figure 4.1: A visual representation of the firefighter protective hood materials used in this
study. ... 51 Figure 4.2: Time to second-degree burn for two-layer PBI/FR rayon compared to three-layer
particulate-blocking composite. Error bars indicate the maximum and minimum values for the ISO bars and the 95% confidence interval for the ASTM bars. ... 56 Figure 4.3: Time to second-degree burn for two-layer OPAN carbon compared to three-layer
particulate-blocking composite. Error bars indicate the maximum and minimum values for the ISO bars and the 95% confidence interval for the ASTM bars. ... 58 Figure 4.4: The time after exposure values for the materials using the ASTM F2703 test
method. Materials A, C, D, and C.1 are composed of greater than 50% FR rayon. . 60 Figure 5.1: The three different hoods used for the exposure time study donned on
PyroHead™. From left to right: Hood 1, Hood 2, Hood 2.1. ... 63 Figure 5.2: Locations of the heat flux sensors on PyroHead™. ... 66 Figure 5.3: The three different mounting configurations donned on PyroHead™. From left to
right: Hood Only, Hood/Mask, Hood/Mask/Helmet. ... 67 Figure 5.4: Demonstration of the effect of changing exposure times in a test using
Figure 5.5: Demonstration of the effect of adding masks and helmets to a test at a seven second exposure using PyroHead™. Error bars represent the 95% confidence interval. ... 70 Figure 5.6: Different angles of a mask donned on PyroHead™ to show that a large
proportion of sensors are either partially or fully covered. ... 70 Figure 5.7: Demonstration of the intraday variability of using PyroHead™ with different
mounting configurations. Error bars represent the maximum and minimum
values. ... 71 Figure 5.8: Plot of the change in variability of PyroHead™ test results as sample size
increases. ... 74 Figure 5.9: 95% confidence interval of sample size standard error of the estimated sample
standard deviations of every hood tested on PyroHead™ in this research project. .. 75 Figure 6.1: Traditional (top) and particulate-blocking (bottom) hoods. Traditional hoods
(from left to right) are 4, 5, and 6. Particulate-blocking hoods (left to right) are 4.2, 5.1, and 6.1. ... 78 Figure 6.2: Custom hoods made with particulate blocking layers of different air permeability.
Hoods from left to right starting at top left are as follows: 4, 4.1, 4.2, 4.3, 4.4. ... 78 Figure 6.3: Graph of the percent change in predicted percent head burn from the traditional
hood to its particulate blocking counterpart. Percent change was calculated by the difference divided by the traditional hood burn percentage. ... 80 Figure 6.4: Post-test PyroHead™ sensor schematics in the Traditional vs. Particulate
Blocking Study... 81 Figure 6.5: Effect of adding or replacing a knit layer with a particulate-blocking layer on
thermal protection. Error bars represent the 95% confidence interval. ... 82 Figure 6.6: Graph of the effect of air permeability of particulate blocking layers on
PyroHead™. Error bars represent the 95% confidence interval. ... 83 Figure 6.7: T-test run to compare the true means of predicted head burn of the different air
permeable particulate blocking layers on PyroHead™... 84 Figure 6.8: Photograph demonstrating the cinching of a firefighter protective hood to
mitigate openings where heat and flames could travel. ... 85 Figure 7.1: Averages of the results of all the hoods run on PyroHead™. The three on the
right are three-layer hoods while the other 10 are two-layer hoods. ... 88 Figure 7.2: T-test to compare the true means of predicted head burn of the different numbers
LIST OF EQUATIONS
Equation 3.1: Predicted Burn Injury Equation ... 35
Equation 3.2: Stoll Curve Mathematical Criterion Model ... 36
Equation 3.3: Calculation of Standard Error... 49
CHAPTER 1:Introduction and Proposal 1.1.Purpose
Firefighters put themselves in harm’s way every day to protect and rescue those who have been affected by disaster. Structure fires could become catastrophic when the fuel of home décor and furnishings was all wood and other natural materials. However, with the rise in cheap, synthetic modern home décor and furnishings, structure fires are reaching their most dangerous levels more quickly and the by-products of combustion are as frightening. Even though firefighters are adequately trained and protected from the fires themselves, they are experiencing alarmingly high rates of cancer. This rise in cancer rates is believed to be attributed to the large number of carcinogens in the potential toxic by-products found in smoke and soot.
The purpose of this research is to delve deeper into looking at the thermal protective performance of these hoods and their prospective materials. There are many methods and tools of evaluating fabric and garment performance under flashover exposures and this research will explore and evaluate those methods against themselves and against each other. In order to understand the relationships these methods have with different material properties as well as with each other. A successful research project will be able to identify the factors affecting these relationships and through working with the standard committee, impact the NFPA 1971 requirements. All this is done to ensure that firefighters present and future not only come home at the end of their shifts but allow them to fully use their pensions when they decide to retire. 1.2.Research Objectives
The research objectives this project assesses are:
1. To determine how added particulate blocking layers affect the thermal protection of hoods at both the material and hood-level.
2. To determine how hood-level results compare with legacy bench-level thermal protection test methods and their results.
CHAPTER 2:Firefighting Tactics and Personal Protective Equipment 2.1.Evolution of Tactics
Ever since its discovery, fire has been one of mankind’s greatest allies as well one of its greatest foes. From being used for cooking and keeping warm to accidentally resulting in destruction and loss of life, fire has been present through it all. This beautiful product of combustion has captured the hearts and minds of mankind throughout time and new scientific discoveries dealing with fire are being made on a regular basis. Figuring out how to control and mitigate unwanted losses have and will continue to be on the minds of mankind so long as all the necessary ingredients for combustion are available: heat, fuel, and oxygen. This review will explore the evolution of the tactics and the equipment used by those who attempt to contain rogue fires.
2.1.1.Cohorts of the Watchmen
were too large to control, the Vigiles would begin tearing off roofs and walls of the lit building or by destroying surrounding buildings in an attempt to mitigate the further spread of the fire and contain it to one specific area [3].
2.1.2.Middle Ages Europe
After the fall of the Roman Empire, another dedicated fire service was not seen or implemented until the 11th or 12th century [1]. Technology for fire control was still in its infancy and as a result, advancements were made socially instead of technologically. From the 12th to 17th centuries, laws were put into place to assist those that monitored towns at night looking for fires. These laws consisted of requiring residents to have ladders and buckets available for quick use of neighbors and fire servicemen so that they did not have to waste time going back and forth from a water source, especially if the fire was still small upon its discovery [1]. At this point in time, tactics were still centered around prevention of fire and spreading of conflagration as opposed to fire combat.
2.1.3.American Colonization through Industrial Revolution
foundations were laid for modern fire protection, departments, prevention, and suppression. To help with the inherent dangers of firefighting, the fire service was quick to adopt ideas and innovations from inventors during the industrial revolution. Larger and more powerful water pumps, silhouettes of modern American fire helmets and steam powered engines were all designed or redeveloped in the 1800s and were shown as a testament to how much innovation occurred during this period. In the late 1800s, the National Fire Protection Association (NFPA) was created to govern and standardize fire protection efforts across the country [1].
2.1.4.Layman versus Modern Tactics
2.1.4.1.Layman Tactics
Table 2.1: Descriptions of the divisions of firefighting tactics as described by Layman [5].
Division Description
1 Size-Up Situational estimate by the officer in charge where they decide what to do and how to do it.
2 Rescue Remove any people out of harm’s way from the building to safety.
3 Exposures Preventative methods of the spreading of fire to other structures. 4 Confine Fire Preventative methods of the spreading of fire to other parts of
the building on fire.
5 Extinguish Fire Attack and extinguishing of the main body of fire. 6 Overhaul Procedures to prevent rekindling after the fire has been
extinguished.
6a Ventilation Removal of smoke, gasses and hot air.
6b Salvage Protect building and contents from unnecessary damage from water, smoke and other elements.
Layman also came up with a methodology called “the indirect method of attack” [6]. This methodology was developed during his time with the United States Coast Guard in 1943 to extinguish fuel oil fires in confined spaces on commercial and military boats and ships. This methodology showed that it was possible to control and extinguish fires in confined spaces without having to apply water directly to the surface of the burning oil. Previously, directly applying water had the potential to spread the fire as water and oil do not mix. This new methodology also allowed those fighting the fire the opportunity to diminish the conditions down to a suitable level for firefighters to enter the room or structure. After he left the U.S. Coast Guard, Layman brought these findings back to his home fire department and implemented this methodology in the late 1940s to early 1950s [6].
2.1.4.2.Modern Tactics
that outlines suggested procedure on a fire ground. This statement is split up into nine divisions and were developed from years of research and experience. These divisions are outlined and described in Table 2.2. [7]
Table 2.2: Description of the divisions of firefighting tactics as described by NFPA [7].
Division Description
1 Size-Up Get a 360-degree view of structure, and report fire location, extent, and smoke conditions.
2 Identify the Flow Path Figure out smoke and fire entry and exit points, where to send attack crews, and where ventilation is happening.
3 Soften the Target Cooling gases improves interior conditions, apply solid stream to ceiling or seat of fire.
4 Read Smoke A rapid intake of air could indicate a ventilation-limited fire (the fire needs more air to grow).
5 Vent Close to Fire Origin
Venting far away from the fire can increase chances of spreading and quicken flashover.
6 Coordinate Ventilation with Hose Attack
Venting causes fire to grow, use water in tandem with ventilation to take fire from ventilation-limited to fuel limited.
7 Vent, Enter, Isolate, Search (VEIS)
Closing door of occupied room increases tenability while smoke vents and gives ability to search isolated space.
8 Close the Door Room will remain tenable and increases survivability. 9 Control the Access
Door
Limits airflow until attack crew gets leverage on fire, then door can be opened to release hot gasses and smoke.
2.1.4.3.Comparison of Tactics
Table 2.3: Compares the Modern NFPA tactical divisions with their origin Layman divisions [6], [7].
Layman Division Corresponding Modern NFPA Division(s) 1 Size-Up 1, 2 Size-Up, Identify Flow Path
2 Rescue 7, 8 VEIS, Close Door
3 Exposures 3, 4 Soften the Target, Read Smoke 4 Confine Fire 4, 5, 6,
7, 8
Read Smoke, Vent Close to Fire Origin, Coordinate Ventilation, VEIS, Close Door
5 Extinguish Fire 6, 9 Coordinate Ventilation, Control Access Door
6 Overhaul N/A N/A
There is no doubt that technology influences all phases of life and the fire service’s tactical procedures are no different. Changes in turnout gear are a heavy influence in why the fire service has felt the need to change and update how they approach and attack a fire. Modern turnout gear has given those in the fire service more of an opportunity to go deeper into the fire to perform their duty to protect others and property. This is apparent in the tactical procedures because modern tactics mandate ventilation close to the source of the fire, which was not possible with legacy personal protective equipment. Also, rescue operations are performed later in the order of duties, showing that firefighters can control the fire enough to increase survivability for potential occupants.
2.2.Changes in Turnout Gear
require interior fire attack and focused mainly on disrupting spread of fire to other structures, therefore, turnout gear was not necessarily needed.
2.2.1.Legacy Turnout Gear
Figure 2.1: Typical turnout gear for firefighters around the 1950s, including rubber trench coat and three-quarter length rubber boots [9].
Figure 2.2: An indirect method of attack through a corner of a window while the nozzleman makes sure they are keeping below
However, with the passing of NFPA 1500: Standard on Fire Department Occupational Safety, Health, and Wellness Program, the trench coat and three-quarter boots combination was banned in 1987 [10], [11]. NFPA 1500 states that both the coat and pants must pass NFPA 1971: Standard on Protective Ensembles for Structural Fire Fighting and Proximity Fire Fighting [11]. According to NFPA 1971 section 6.5.1, the “garments and their closure systems, including the coat front and the trouser fly, shall be constructed in a manner that provides continuous moisture and thermal protection” [12]. This requirement does not include the trench coat and boot combination because of the gaps in the bottom of the trench coat up into the legs of the firefighter wearing the uniform as can be noticed in Figure 2.1.
2.2.2.Modern Structural Turnout Gear
Table 2.4: Outlines the turnout gear components and their governing sections in NFPA 1971, descriptions, and popular materials used in each component [12]-[15].
Layer
Governing NFPA 1971
Sections
Purpose Popular Materials
Outer
Shell 3.3, 6.1, 7.1
Protects from direct flame as well as gives abrasion and cut
protection.
polybenzimidazole (PBI), meta-aramid, para-aramid, polybenzoxazole (PBO)
Moisture
Barrier 3.3, 6.1, 7.1
Prevents the transfer of liquids such as water, aqueous film-forming-foams, gasoline, and blood-borne pathogens. Also allows perspiration
to move away from the body.
Substrate:
PBI, meta-aramid, para-aramid, FR rayon
Film:
polytetrafluoroethylene (PTFE), polyurethane (PU)
Thermal
Barrier 3.3, 6.1, 7.1
Provides most of the thermal protection from ambient heat. Consists of facecloth and batting.
polyimide, PBI, FR rayon, meta-aramids, para-aramids
2.3.Protective Hoods
protective hood, since the earflaps are relatively loose fitting on the wearer, it is possible for extreme heat and flames to come up into the sides and back of the neck and face as shown in Figure 2.4. However, since the protective hood is an interface item, it is not subject to some of the rigorous testing that the rest of the turnout gear is required to go through.
2.3.1.NFPA 1971-18 Hood Requirements
To be eligible for on-market use, any and all structural firefighter gear must pass all of the design and performance requirements mandated by the newest version of NFPA 1971, including protective hoods. NFPA 1971-2018 defines a Structural Fire Fighting Protective Hood as “the interface element of the protective ensemble that provides limited protection to the coat/helmet/SCBA facepiece interface area” [12]. NFPA 1971-18 also goes on to specify design requirements for protective hoods in section 6.13 Protective Hood Interface Component Design Requirements for Both Ensembles. Design requirements such as the types of threads to be used,
Figure 2.3: Shows the turnout ensemble from the chest up to the head with a protective hood being utilized, concealing
any skin from environmental exposure.
Figure 2.4: Shows turnout ensemble from the chest up to head without a protective hood being utilized, exposing skin around
what parts the hood is supposed to protect with measurements, and size of the face opening. In the 2018 edition of NFPA 1971, an optional protective barrier hood was introduced, and its design requirements are outlined in 6.14 Optional Protective Barrier Hood Interface Component Design Requirements. These requirements include all of those specified in section 6.13 as well as how much of the hood must contain particulate blocking material [12].
Table 2.5: Mandatory protective hood performance requirements described in NFPA 1971-18 [12].
Property Test Method/
Measurement
NFPA 1971 Protective Hood Requirement
Shape Retention Hood Opening Size
Retention Test Shall not exceed 110% of original size Thermal Insulation
Thermal Protective Performance (TPP) Test – ISO 17492
TPP rating of no less than 20.0
Resistance to Flame Flame Resistance Test One – ASTM D6413
Shall not have a char length of more than 100 mm (4 in) average, after flame of more than 2.0 seconds, no
melt or drip Resistance to Heat
Heat and Thermal Shrinkage Resistance
Test – ISO 17493
Shall not shrink more than 110%
Resistance to Shrinkage
Cleaning Shrinkage Resistance Test –
AATCC 135
Shall not shrink more than 5%
Thread Melt Resistance Thread Melting Test Shall not melt below 260°C (500°F) Knit Hood Material
Strength
Burst Strength Test – ASTM D6797
Burst strength not less than 225 N (51 lbf)
Knit Hood Seam Strength
Seam Breaking Strength Test – ASTM
D3940
Burst strength not less than 181 N (41 lbf)
Table 2.6: Protective hood requirements for the optional protective barrier hoods described in NFPA 1971-18 [12].
Property Test Method/
Measurement
NFPA 1971 Protective Hood Requirement
Particulate Blocking Efficiency
Particulate Blocking Test – ASTM F2299M
Particulate Blocking Efficiency of no less than 90% of particle sizes between
0.1 and 1.0 µm Evaporative Heat
Transfer
Total Heat Loss Test – ASTM F1868
2.3.2.Response to Hoods
No matter how much added performance or value a product can give, there will typically be pushback by users, especially by those who have been doing things one particular way for so long. In this case, protective hoods are that product that had a great deal of additional value, but still received pushback. There is a consistent consensus between firefighters, especially experienced ones, that feel as though the protective hood impedes their instincts and how they perceive a situation. For example, before the addition of the hoods, firefighters used to use their ears as indictors as to when the environment was getting too dangerous, as told by a firefighter in the doctoral dissertation by Ward:
The turnout gear has improved our protection, but it also gives you a false sense of
security because you don’t feel what you used to. And the thing that I’ve done and
take a beating over is I won’t wear my hood the whole way. I’ll keep an ear open.
And the reason being is because I don’t feel the heat in my gear…I know it’s an old
indicator; it’s probably not the best thing [18].
Back when I first came in you always left your ears exposed so when you crawled
down the hall, you know, depending on how hot it was, your ears were always
telling you… If the place wasn’t being ventilated properly, you knew it because; of
course you get close to the ground where it was a little cooler and as soon as you
pick your head up, you could tell how hot it was. And when your ears start tingling
you know that the truck company is not ventilating the place, so back up a little bit.
Right now you’re so well protected that you feel nothing. We’ve had people, their
helmets, they just absolutely melt. And they can stay there because they’re so well
protected – which is bad… You know [Laughs], it’s good that you’re protected that
well, but it’s bad because now you’re in an environment where if something
happens to your mask, you’re dead [16].
In general, firefighters seemed to prefer the minor to moderate burns on their neck and ears and be able to sense life-threatening situations well before they arise as opposed to mitigating these burns but potentially venturing too far into the fire.
However, even with all the pushback given by firefighters regarding the protective hoods, there is a minority positive view that is shared between some of those in the fire service. According to the firefighters, the protective hoods impede their ability to prevent themselves getting into a life-threatening situation but have stated that the hoods have helped them survive flashovers and other life-threatening situations. Here is one of those firefighters’ takes with this minority view:
But, you know, the older school mentality was you know, if you got in there and the
you wear that hood. It’s almost like you don’t feel it until it’s really biting you and
then it’s almost like, “Uh oh.” You know, you got to get out. But on the other hand,
if it did flashover you’d have a better chance of survival if you had it on compared
if you didn’t have it on [16].
2.3.3.Cancer Problem
Firefighters are a people of habit and tradition, and some of those traditions die hard. The incorporation of protective hoods is a prime example of the pushback firefighters give when they are asked to change their ways. As stated in the previous section, before the late 1990s, firefighters would use the exposed parts of their person to feel the environment and assess if they were going into an area too dangerous for them to be in. Most of the firefighters were trained this way and have even trained those that may have started after protective hoods were incorporated to feel the environment with their ears. Consequently, this has resulted in firefighters wearing their gear incorrectly and exposing parts of their body that should not be exposed, especially in areas around the head and neck. Little did these firefighters know that purposefully exposing themselves to the burning environment could arguably be more detrimental to their health than they might realize.
Table 2.7: Likelihood of Cancer Risk and Summary Risk Estimate for different types of cancers [19].
Cancer Site Summary Risk Estimate (95% CI)
Likelihood of Cancer Risk by Criteria
Multiple myeloma 1.53 (1.21 – 1.94) Probable
Non-Hodgkin lymphoma 1.51 (1.31 – 1.73) Probable
Prostate 1.28 (1.15 – 1.43) Probable
Testis 2.02 (1.30 – 3.13) Possible
Skin 1.39 (1.10 – 1.73) Possible
Malignant melanoma 1.32 (1.10 – 1.57) Possible
Brain 1.32 (1.12 – 1.54) Possible
Rectum 1.29 (1.10 – 1.51) Possible
Buccal cavity and
pharynx 1.23 (0.96 – 1.55) Possible
Stomach 1.22 (1.04 – 1.44) Possible
Colon 1.21 (1.03 – 1.41) Possible
Leukemia 1.14 (0.98 – 1.31) Possible
Larynx 1.22 (0.87 – 1.70) Unlikely
Bladder 1.20 (0.97 – 1.48) Unlikely
Esophagus 1.16 (0.86 – 1.57) Unlikely
Pancreas 1.10 (0.91 – 1.34) Unlikely
Kidney 1.07 (0.78 – 1.46) Unlikely
Hodgkin’s disease 1.07 (0.59 – 1.92) Unlikely
Liver 1.04 (0.72 – 1.49) Unlikely
Lung 1.03 (0.97 – 1.08) Unlikely
In a 2015 study conducted by the International Association of Fire Fighters (IAFF) and International Personnel Protection, Inc. at RTI International (Research Triangle Park, NC), revealed that particles from soot and smoke in structure fires could penetrate the turnout gear and could potentially be the cause of spikes in cancer rates [20]. The images shown in Figure 2.5 from the Fluorescent Aerosol Screening Test (FAST) of firefighter turnout gear were some of the first qualitative pieces of data that both researchers and the fire service had that exhibited how soot and smoke had the potential to penetrate through the turnout gear and enter the bodies of the men and women in the fire service. Seeing that a great deal of particulate penetration was entering around the head and neck areas, the fire service as a whole started to embrace the protective hoods and research and development on how to mitigate these harmful chemicals from entering the turnout gear and reaching the body started and quickly became the new topic of discussion for researchers and those in the fire service alike.
Figure 2.5: Before and After photos of the head and neck areas showing particle penetration produced from the Fluorescent Aerosol Screening Test performed by RTI International in
2.4.Protective Hood Materials
2.4.1.Aramids
Some of the first synthetic polymers developed were aliphatic polyamides, or nylons, and were developed by a DuPont researcher named Wallace Carothers. However, DuPont first introduced aramids to market in 1961 with the release of their Nomex® meta-aramid fiber [21]. Aramids are in the same family as polyamides as their chemical structures are extremely similar. The only difference in these two structures is that the methylene groups in typical polyamides like nylon 6 and nylon 66, are replaced with an aromatic ring as shown in Figure 2.6, hence, the name to ‘aromatic polyamide’ or ‘aramid’ for short [22]. There are two main types of aramids, meta-aramids and para-meta-aramids and in general, meta-aramids are very strong and have a remarkably high resistance to heat, chemicals, and abrasion, which will be explained in the following sections.
Figure 2.6: Comparison of normal polyamides versus aromatic polyamides [62].
Aromatic Polyamide
2.4.1.1.Para-aramids
2.4.1.1.1.Structure
Para-aramids, or poly(p-phenyleneterephthalamide), are a type of aramid with para linkages connecting the carbonyl and amine groups to the phenylene rings of the polymer. A para linkage is a linkage of a six-membered ring in the 1,4 positions as shown in Figure 2.7. Having linkages that are opposite of each other allows the polymer to be rod-like and have an affinity for tight packing and as a result, has a high degree of crystallinity and symmetry [23].
2.4.1.1.2.Properties
Since para-aramids have such a linear structure and high degree of crystallinity, they have extremely high tensile strength and modulus. Their performance-to-weight ratio indicates that para-aramids perform better than fiber-glass and steel [21]. As an added result of its highly regular structure and crystallinity, para-aramids have great thermostability and negligible shrinkage at high temperatures. Para-aramids’ high performance capabilities are also contributed to bonding characteristics such as aromatic and amide groups, and intermolecular hydrogen bonding between polymer chains [24]. Table 2.8 lists some of the important properties of aramids and para-aramid fibers.
Table 2.8: Properties of para-aramid fibers [24]-[27].
Property Value Units
Glass Transition Temperature
(Tg) 322 °C
Degradation Temperature (Td) 500 °C
Limiting Oxygen Index (LOI) 29 %
Density 1.45 g/cm3
Tenacity 190-240 cN/tex
Elongation at Break 1-4 %
Thermal Conductivity 0.04 W/m-K
Specific Heat 1,400 J/kg-K
2.4.1.2.Meta-aramids
2.4.1.2.1.Structure
2.4.1.2.2.Properties
With meta-aramids being flexible, chain-folding, semi-crystalline polymers, they typically show signs of lower performance than their para-linked counterparts. However, because of the phenylene-amide and carbon-nitrogen bonds and overall strength of the backbone, meta-aramids still show mechanical properties that rival many high-performance polymers and fibers and are shown in Table 2.9. Meta-aramids also do not melt but degrade once at a high enough temperature. Unlike para-aramids, once exposed to an open flame or heat source, meta-aramids will shrink [24]. This shrinking is the result of meta-aramids being semi-crystalline and less regular than para-aramids but are drawn out to be oriented and somewhat aligned during fiber spinning. Since meta-aramids have amorphous regions and are considered chain-folding polymers, the subsequent heating of the polymer causes energy to enter the amorphous regions, causing an entropic reaction. This entropy change makes the bonds in the amorphous regions to rotate and become disordered, subsequently shortening the distance between crystalline regions, forcing the polymer to contract [28].
Table 2.9: Properties of meta-aramid fibers [24], [26], [27].
Property Value Units
Glass Transition Temperature
(Tg) 280 °C
Degradation Temperature (Td) 415 °C
Limiting Oxygen Index (LOI) 28-30 %
Density 1.35 g/cm3
Tenacity 40-50 cN/tex
Elongation at Break 20 %
Thermal Conductivity 0.13 W/m-K
Specific Heat 1,200 J/kg-K
2.4.2.Fire-Resistant Viscose Rayon
2.4.2.1.Structure
2.4.2.2.Properties
As with any solid material, when impurities are added, typically the physical properties of the material are reduced, and adding FR particles to a viscose dope is no different. However, since FR viscose is used in protective equipment, higher quality materials are used more often. Typical viscose is not used in the making of FR viscose, but instead a different process is used that yields a better manmade cellulosic fiber, modal. Once the FR particles are added, the modal is weaker than what it would be in its pure form, but the FR treated modal is superior in performance compared to normal viscose. Properties of FR viscose rayon are outlined in Table 2.10 [29].
Table 2.10: Properties of Fire-Resistant Viscose Rayon [30], [31].
Property Value Units
Degradation Temperature (Td) 150-200 °C
Limiting Oxygen Index (LOI) 28 %
Density 1.52 g/cm3
Tenacity 15-24 cN/tex
Elongation at Break 15-20 %
Thermal Conductivity 0.23 W/m-K
Specific Heat 1,400 J/kg-K
2.4.3.Oxidized Polyacrylonitrile (OPAN)
2.4.3.1.Structure
Oxidized polyacrylonitrile (OPAN) is carbon fiber that has been derived from polyacrylonitrile (PAN) fibers. To become a carbon fiber, PAN must go through cyclization, oxidation, and stabilization phases to effectively reorganize the backbone structure to mimic true carbon fiber as much as possible without going through the complete carbonization process which takes a lot of time, energy, and money. To become oxidized, PAN fiber goes through an oxidation oven which heats the PAN in air at 300°C so that the structure can become cyclic, as shown in Figure 2.10 [32] .
2.4.3.2.Properties
Since OPAN has not completely gone through the complete carbonization process to become pure graphitic crystals and still has elements such as oxygen and nitrogen in the structure, it typically has lower physical properties than its pure counterpart. Even with inferior physical properties than pure carbon fiber, OPAN, will not melt, burn, nor shrink when exposed to heat and direct flame [30]. The fewer processes allow OPAN to be much cheaper for applications that need high performance for wearables, but not exceptional performance like what would be needed in aircrafts and pressure tanks. Table 2.11 highlights some of OPAN’s physical properties.
Table 2.11: Properties of oxidized polyacrylonitrile (OPAN) [30].
Property Value Units
Degradation Temperature (Td) >450 °C
Limiting Oxygen Index (LOI) 45-55 %
Density 1.37-1.40 g/cm3
Tenacity 18.5-23 cN/tex
Elongation at Break 22-28 %
Thermal Conductivity 0.033 W/m-K
Specific Heat 740 J/kg-K
2.4.4.Polybenzimidazole (PBI)
The first time that anyone patented polybenzimidazole (PBI) technology was in 1959 by the researchers, Keith Clark Brinker and Ivan Maxwell Robinson, whom were working at DuPont at the time. After extensive research was conducted on linear condensation polymers like polyamides for example, there were still some downfalls regarding their stiffness and toughness, softening points, and resistance to water, as well as other properties. Clark and Maxwell wanted to solve these issues so continued to do research and the polymer PBI was the result of their hard work and research [33]. PBI is a unique polymer with a variety of possible variations of end group structures and synthesis techniques to create different derivatives of one of the most stable extreme environment amorphous polymers on market.
2.4.4.1.Structure
stated that their preferred method at the time of invention contains four to eight methylene groups in the monomer, as shown in Figure 2.11 [35].
However, after sixty plus years of knowledge and technology later, other structures have been experimented with and are preferred. PBI Performance Products, Inc. is the only distributer of PBI fiber in the world, therefore, the focus of this review will be on the variation that PBI Performance Products, Inc. produces, which is poly-2,2’-(m-phenylene-5,5’-bibenzimadozle as illustrated in Figure 2.12 [36].
2.4.4.2.Properties
What makes PBI extremely unique is the fact the it is an amorphous polymer yet still when it has a high molar mass, it has the highest thermal stability of those in the advanced engineering thermoplastics family. However, even though it is amorphous and considered a thermoplastic, because of its high thermal stability, PBI is not melt processable at temperatures and pressures that are easily achieved [37]. Some of the more important properties of PBI and PBI fibers are listed in Table 2.12. All previous material properties mentioned are outlined in Table 2.13.
Figure 2.11: Original preferred polybenzimidazole as discussed by Clark and Maxwell [35].
Table 2.12: Properties of Polybenzimidazole Fiber [26], [33], [37]-[39].
Property Value Units
Glass Transition Temperature
(Tg) 427 °C
Degradation Temperature (Td) 760 °C
Limiting Oxygen Index (LOI) 58 %
Density 1.3 g/cm3
Tenacity 240-270 cN/tex
Elongation at Break 3 %
Thermal Conductivity 0.41 W/m-K
Table 2.13: Physical property comparison of high performance fibers used in firefighter protective hoods. Fiber
Glass Transition Temperature
(Tg) [°C]
Degradation Temperature
(Td) [°C]
Limiting Oxygen
Index (LOI) [%]
Density [g/cm3]
Tenacity [cN/tex] Elongation at Break [%] Thermal Conductivity [W/m-K] Specific Heat [J/kg-K]
Para-aramid 322 500 29 1.45 190-240 1-4 0.04 1,400
Meta-aramid >230 415 28-30 1.35 40-50 20 0.13 1,200
FR Viscose
Rayon - 150-200 28 1.52 15-24 15-20 0.23 1,400
OPAN - >450 45-55 1.37-1.40 18.5-23 22-28 0.033 740
CHAPTER 3:Skin and Thermal Protection 3.1.Skin Burns
Protective clothing is used so that humans are able to perform tasks with materials and in environments that are inherently too dangerous for the body to naturally handle. From uses in cooking to firefighting, protection from fire and extremely heated surfaces and environments are of the highest demand. Without protection from fire and heat energy, the skin is open to take the brunt force of the energy transfer and can result in different levels of burn injury depending on the level of exposure and the duration of exposure.
There are three main layers that makeup the anatomy of skin: epidermis, dermis, and hypodermis (or subcutaneous tissue) [40]. The epidermis is the topmost layer of the skin that consists of dead cells that shed and are replaced frequently. The second layer, dermis, produces melanin that gives skin its pigmentation and protects the lower layers and cells from ultraviolet rays. The dermis is where most of the functions of the skin take place. Blood vessels, nerves, sweat glands, hair follicles, as well as the elastic structures that enable the skin to be flexible and pliable are all contained in the dermis. The final layer, the hypodermis, is where most of the fat is stored in the skin which acts as both insulation as well as cushioning from impacts [40] .
3.2.Skin Burn Models
Modeling must be used to predict whether a human will sustain a burn when wearing a specific garment. Other than the fact that this type of testing for every material and garment would take too much time and money, advancements in ethics of the treatment of human subjects has prevented further burn injury testing on live subjects. Before ethical treatment was widely considered, the research and burn modeling of two researchers, Henriques and Stoll, have been the basis of burn injury prediction in most standard thermal protection test methods.
3.2.1.Studies of Thermal Injury – Henriques
In response to the high rates of injury and death caused by heat energy and fires in World War II, Henriques and Moritz were inspired to study the effects of thermal conduction on skin. Henriques and Moritz released multiple articles all under the title “Studies of Thermal Injuries” [42]-[44]. Most of these studies showed the relationships between time and temperature for causing skin burns. However, the fifth paper used the data gathered in the four previous studies to derive a model for predicting when and how serious a skin burn could be expected. The Predicted Skin Burn Injury equation (Equation 3.1) is the resulting mathematical model that Henriques and Moritz came up with [44]. A second or third-degree burn can be predicted when the equation is integrated and the arbitrary value of Ω ≥ 1 for a specified temperature or depth of skin. A second-degree burn is predicted when Ω ≥ 1 for depths of ≥75e-6 m and <1200e-6 m, which corresponds to around the depth of the epidermal/dermal intersection. A third-degree burn is predicted when Ω ≥ 1 at a depth >1200e-6 m, which corresponds with the depth of the main portion of the dermal layer of the skin [45]. This particular predictive burn model lays the ground work for many human skin burn models, including those used in predicting burn in the ASTM F1930 Standard Test Method for Evaluation of Flame-Resistant Clothing for Protection Against Fire Simulations Using an Instrumented Manikin [45].
Ω = 𝑃 ∫ 𝑒−∆𝐸/𝑅𝑇𝑑𝑡
𝑡
0
(3.1)
Where,
Ω = burn injury parameter; value, ≥1 indicates predicted burn injury, unitless t = time of exposure and data collection period, s
R = universal gas constant, 8314.5 J/mol·K T = temperature at specified depth, K
3.2.2.Stoll Curve
Basing their study on the work done by Henriques and Moritz, Stoll and Greene continued the work of finding the relationship between skin injury due to thermal energy transfer but instead of using porcine skin, they tested using humans. In their initial study, they used three different subjects and applied thermal radiant exposures to their forearms [46]. They used the model created by Henriques, Equation 3.1, however found that the issue was that the damage during the cooling process was much more important for high intensity, short-term exposures than originally believed [47]. Therefore, a different model was developed, called the “Stoll Curve” (shown in Figure 3.2) which is a burn/no burn criterion where if the heat exposure exceeded the threshold line, a second-degree burn was predicted. The Stoll Curve is widely used in test methods today and is employed in the Thermal Protective Performance (ISO 17492, ASTM F2700, ASTM F2703) tests as well as others. However, these test methods utilize a modified version of the Stoll Curve that has the axes of Temperature vs. Time, rather than the original Heat Exposure vs. Time. This modified version is modeled by Equation 3.2 and demonstrated by Figure 3.3.
𝑐𝑎𝑙/𝑐𝑚𝑠 = 1.1991 ∗ 𝑡𝑖0.2901 (3.2)
Where,
Figure 3.2: Stoll curve that models second-degree burns at varying levels of exposure at different durations [49].
Figure 3.3: Visualization of Equation 3.2 and where the burn/no burn criterion lies on the resultant raw data graph.
0 5 10 15 20 25
0 2 4 6 8 10 12 14 16 18
T
o
tal
Flu
x
(
ca
l/cm
2
sec
)
Time (sec)
Stoll Curve
SAFE
3.3.Bench-Level Test Methods
3.3.1.ISO 17492
After testing, a TPP Rating is reported, which is the target exposure heat flux (2.0 cal/cm2 -s) multiplied by the time to predicted second-degree burn, in seconds. Some sources have led firefighters to believe that a TPP Rating is indicative of how long a wearer has in a flashover environment before a second-degree burn is suffered. One of these is in a widely used Firefighter’s Handbook where it states: the current TPP for a structural coat is 35, that is, the wearer has 35 seconds of protection before a second degree burn is likely to be sustained” [8]. However, the
Figure 3.4: TPP testing device in use.
Figure 3.5: Chart showing that the intersection of the Stoll curve and temperature data results in a predicted second degree burn for an ISO 17492 test.
0 5 10 15 20 25 30 35
0 2 4 6 8 10 12 14 16 18 20
T o tal Flu x ( ca l/cm 2 sec ) Time (sec)
ISO 17492 Testing on Hood Material
Raw Flux Stoll Burn Data
resulting TPP Rating has units of cal/cm2, indicating that a TPP Rating is how much heat energy
per unit area a sample can withstand before a predicted second-degree burn, not the amount of time a wearer has in a flashover environment. Therefore, a TPP Rating of 35 would correspond to about 17.5 seconds of protection before a predicted second-degree burn.
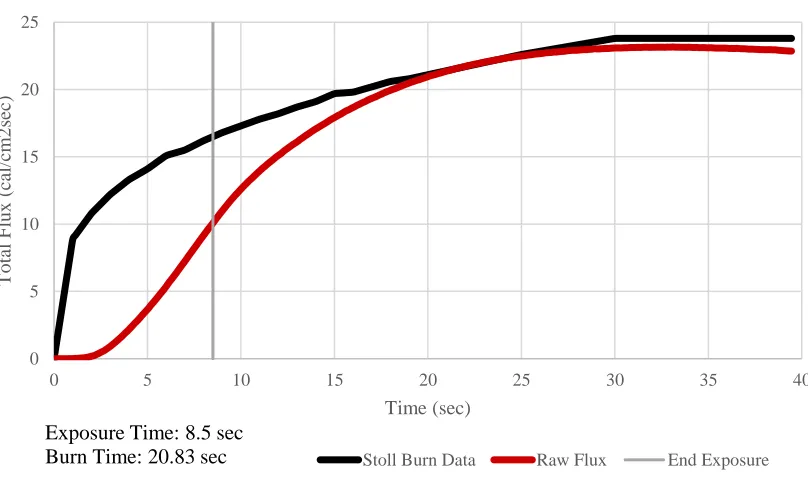
3.3.2.ASTM F2703
3.4.Manikin Test Methods
3.4.1.PyroMan™ Fire Test System
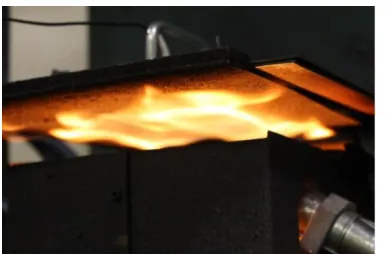
The previously mentioned bench-level methods only test thermal protection when the material or composite is flat. Garments are not worn as flat pieces of fabric and these methods do not account for the airgaps and drape that is associated with actual thermal protective garments. Therefore, NC State’s Textile Protection and Comfort Center (TPACC) developed the PyroMan™ Fire Test System pictured in Figure 3.7. PyroMan™ is used by many research, certification, and manufacturing institutions to evaluate the thermal protective performance afforded by thermal and fire-resistant clothing. PyroMan™ is in a chamber surrounded by eight propane burners, and when ignited, like the TPP test methods, exposes the garment and manikin to 2.0 cal/cm2-s (84 kW/m2). To simulate skin response and predict burn, PyroMan™ is covered with 122 heat flux sensors to measure the amount of heat flux that may penetrate through the garment. After the test, data
Figure 3.6: Chart showing that the intersection of the Stoll curve and temperature data results in a predicted second degree burn for an ASTM F2703 test.
0 5 10 15 20 25
0 5 10 15 20 25 30 35 40
T o tal Flu x ( ca l/cm 2 sec ) Time (sec)
ASTM F2703 Testing on Hood Material
Stoll Burn Data Raw Flux End Exposure
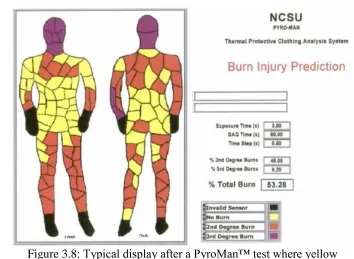
collected from each sensor goes through an algorithm and predicted burn injuries are calculated using the damage integral model (Equation 3.1) [45]. For each sensor, one of three displays will be shown for that sensor area: no burn, second-degree burn, or third-degree burn. On the example graphical display that is provided after a PyroMan™ test shown in Figure 3.8, yellow represents no burn, red represents second-degree burn, and purple represents third-degree burn. A total body burn is then calculated by taking the total number of sensors that received a burn and dividing it by the total number of sensors (122) and multiplying by 100% to get a final total body burn percentage. However, PyroMan™ has limitations as there are no sensors in the hands nor feet, therefore those regions are excluded. The head is also rarely dressed because of the cord escape/support out of the side of its neck. Hence, the development of PyroHands™ and PyroHead™ were necessary.
3.4.2.PyroHands™ Fire Test System
To combat the issue that PyroMan™ did not have sensors in its hands, NC State TPACC developed the PyroHands™ Fire Test System. Shown in Figure 3.9, PyroHands™ are two standalone hand forms that are used to test thermal protective gloves under flashover conditions. The hand forms are surrounded by four propane burners that expose them to 2.0 cal/cm2-s (84 kW/m2). The hands have 20 sensors total along the palm and back of the hand as well as the wrist,
while also having an extra sensor in the middle finger of the right hand. Henriques’ burn model (Equation 3.1) is used for the calculation of burn prediction after the exposure in nearly the same way it is used in PyroMan™ and ASTM F1930. However, the only difference is that some of the model’s constants have been modified to account for the skin thickness difference between the skin in the torso versus the skin in the hands, fingers, and wrists. Total hand burn percentage is calculated the same in PyroHands™ as it is in PyroMan™, number of sensors detecting a burn
Figure 3.8: Typical display after a PyroMan™ test where yellow indicates No Burn, red indicates Second-Degree Burn and purple
divided by total number of sensors (20), then multiplied by 100%. These results are then displayed in a similar graphic to PyroMan™, as shown in Figure 3.10.
Figure 3.9: The mounted PyroHands™ Fire Test System [49].
Figure 3.10: Typical display after a PyroHands™ test where yellow indicates No Burn, red indicates Second-Degree Burn and purple
3.5.PyroHead™ Fire Test System
3.5.1.Overview
The PyroHead™ Fire Test System in TPACC at NC State is a modified version of the instrumented flame test manikins described and outlined in ASTM F1930-18 [45]. As shown in Figure 3.11, it is placed in a chamber with propane burners that expose the head form and the garment to an average of 2.0 cal/cm2-s (84 kW/m2) of heat flux. PyroHead™ has 22 heat flux sensors located at different parts of the manikin head to predict levels of burn injury to areas of the head and neck that are calculated after the burn exposure. On the display that is provided after a PyroHead™ test shown in Figure 3.12, yellow represents no burn, red represents second-degree burn, and purple represents third-degree burn. A total body burn is then calculated by taking the total number of sensors that received a burn, dividing it by the total number of sensors (22) and multiplying by 100% to get a final total body burn percentage.
3.5.2.Burn Model Parameters – Head Skin Thicknesses
The PyroHead™ predicted burn calculation is the same as outlined for ASTM F1930 and employs Henriques predictive burn model (Equation 3.1). The PyroHead™ mathematical model uses some of the skin properties such as thermal conductivity, heat capacity and density, however, because of differences in skin thicknesses of the head as compared to the torso and forearms, some of the parameters of the model should be changed, like how they were changed in PyroHands™ development. The default skin thicknesses used in ASTM F1930 gathered from the forearm and torso are 75, 1125, and 3885 µm, respectively. Whereas there are vast differences depending on the part of the head, as outlined in Table 3.1, gathered from the final report of the development of PyroHead™ [51].
Table 3.1: Estimated values of the depth of the different layers of skin at different areas around the head, face and neck compared to the estimated values used in ASTM F1930.
Body Location Epidermis (µm) Dermis (µm) Subcutaneous (µm)
Eyelid1 50 550 600
Temple1 50 1,800 3,400
Chin1 85 1,865 1,300
Forehead1 75 1,675 3,400
Cranium1 70 1,430 3,400
Ears1 50 750 600
Cheek1 85 1,665 4,000
Neck1 85 1,765 9,900
Forearm/Torso2 75 1,125 3,885
3.5.3.Military Flash Hood Testing
PyroHead™ was originally made and developed for military head gear. The anti-flash hoods used for the military are typically single-layer hoods with just the eyes exposed. As explained in the PyroHead™ development report, to demonstrate and determine how well the PyroHead™ system could differentiate between exposures and material thicknesses, a standard hood was chosen that was tested ten times at three different exposure times, resulting in 30 total tests. The chosen exposure times were 3.5, 4.0, and 4.5 seconds to show that the test was able to show differences between diverse levels of intensity and those results are shown in Figure 3.13.
There were third-degree burns on all of the testing results because the two sensors that represent the eyes were not covered and took the brunt of the heat energy for the entire duration of the exposure. Otherwise, the study stated that the test was able to differentiate between exposure levels as evident by the increase in total predicted burn with the increase in exposure time [51].
To determine the proper number of replicates for a PyroHead™ test and provide a statistical basis, TPACC ran the standard hood 20 times at both 4 and 4.5 seconds to be able to estimate and then predict a standard error with a 95% confidence interval (Equation 3.3). The idea was to make sure that the number if replicates on PyroHead™ produced a similar Standard Error to that of PyroMan™. After the 20 replicates, the standard deviations for the 4 and 4.5 second exposure times were 4.89 and 4.77, respectively. The assumption was made that all further tests with all possible materials and any number of replicates will have the same standard deviations at the respective exposure times. Standard error was then calculated using each standard deviation and substituting a new sample size (n) for each data point. These data points were then graphed (Figure
Figure 3.13: Graph showing that the results of the effect of exposure time on the PyroHead™ test during its development [51].
0 9.09 22.5 9.09 9.09 9.09 0 5 10 15 20 25 30 35
3.5 Seconds 4.0 Seconds 4.5 Seconds
B u rn P er ce n tag e Exposure Time
Average Total Predicted Burn
3.14) and the sample size with the most comparable standard error to that of PyroMan™ was chosen as the ideal number of replicates to use in a study that utilizes the PyroHead™ Fire Test System. According to these parameters, it was chosen that five replicates would be the set number.
𝑆𝐸 = 𝑡𝛼/2
𝑠
√𝑛 (3.3)
Where,
SE = standard error
tα/2 = t-distribution, α = 0.05
s = standard deviation n = sample size
Figure 3.14: Graph showing that the results of the predicted standard error for multiple burns on the PyroHead™ fire Test System [51].
0 2 4 6 8 10 12 14
3 4 5 6 7 8 9 10 11 12
Stan
d
ar
d
E
rr
o
r
Number of Burn Repititions
![Figure 2.1: Typical turnout gear for firefighters around the 1950s, including rubber trench coat and three-quarter length rubber boots [9]](https://thumb-us.123doks.com/thumbv2/123dok_us/1385051.1171199/26.612.177.433.374.658/figure-typical-turnout-firefighters-including-rubber-trench-quarter.webp)

![Table 2.8: Properties of para-aramid fibers [24]-[27].](https://thumb-us.123doks.com/thumbv2/123dok_us/1385051.1171199/40.612.138.465.69.320/table-properties-of-para-aramid-fibers.webp)
![Table 2.9: Properties of meta-aramid fibers [24], [26], [27].](https://thumb-us.123doks.com/thumbv2/123dok_us/1385051.1171199/42.612.146.467.74.315/table-properties-of-meta-aramid-fibers.webp)
![Table 2.11: Properties of oxidized polyacrylonitrile (OPAN) [30].](https://thumb-us.123doks.com/thumbv2/123dok_us/1385051.1171199/45.612.145.466.73.289/table-properties-oxidized-polyacrylonitrile-opan.webp)
![Figure 3.7: The mounted PyroMan™ Fire Test System in use [49].](https://thumb-us.123doks.com/thumbv2/123dok_us/1385051.1171199/58.612.197.425.375.657/figure-mounted-pyroman-test-use.webp)
![Figure 3.9: The mounted PyroHands™ Fire Test System [49].](https://thumb-us.123doks.com/thumbv2/123dok_us/1385051.1171199/60.612.125.483.424.662/figure-mounted-pyrohands-test.webp)