ABSTRACT
Ou, Erkang. Effect of Silica Support on Electrostatics at Membrane-Water Interface and Lipid-Protein Interface by EPR-Active Molecular pH Probes. (Under the direction of Prof. Tatyana I. Smirnova).
Polarity, electrostatic potentials, and hydration are the major physico-chemical characteristics of lipid membranes that govern membrane-protein and protein-protein interactions as well as transport of small molecules through cellular membranes. At the membrane-water interface, the surface electrostatic potential of a lipid bilayer plays a fundamental role in such key processes of cellular functioning as endo- and exocytosis,
membrane fusion and cellular division to name a few. At the lipid-protein interface, local dielectric constant of biomembranes determines stability, folding, and aggregation of membrane receptor proteins that are involved in a myriad of cellular functions. Some of the properties of cellular membranes could be mimicked by supported lipid bilayers (SLB) that serve as very useful model membrane platforms with the lipid bilayer providing a biocompatible interface and the solid support allowing for manipulation of lipid bilayer properties in a controllable manner. Such membrane-mimicking systems are considered to be the promising candidates for a number of biomedical and biotechnological applications. At present, little is understood about the influence of nanostructured support and the nanoconfinement on the properties of the membrane at membrane-water interface and protein-lipid interface. This PhD thesis project reports on employing EPR-active pH sensitive probes
to assess the surface electrostatics and to profile a heterogeneous dielectric environment along
a transmembrane peptide incorporated into both unsupported unilamellar lipid vesicles and the
Effect of Silica Support on Electrostatics at Membrane-Water Interface and Lipid-Protein Interface by EPR-Active Molecular pH Probes
by Erkang Ou
A dissertation submitted to the Graduate Faculty of North Carolina State University
in partial fulfillment of the requirements for the degree of
Doctor of Philosophy
Chemistry
Raleigh, North Carolina 2017
APPROVED BY:
_______________________________ _______________________________ Dr. Tatyana I. Smirnova Dr. Alexander. A. Nevzorov
Committee Chair
DEDICATION
BIOGRAPHY
Erkang Ou was born in April 1988 and grew up in a lovely family, her father is an outstanding executive engineer, and her mother is an excellent analytical chemist, their wit, humor and integrity set a good example for her. During the years playing in her mother’s lab, Erkang found her passion about chemistry, haha, made her father a little down that he had hoped to help her discover the beauty of mechanical engineering.
In September 2007, she was accepted by one of the top universities in China, Sichuan University and majored in Chemistry. In 2009 she was luckily selected to be an exchange student studying chemistry in Pennsylvania for two semesters and made up her mind to pursue a graduate study in the United States.
ACKNOWLEDGMENTS
The following people are acknowledged for their contribution:
Prof. Tatyana I. Smirnova, for being my wise, knowledgeable and supportive advisor;
Prof. Jerry Whitten, Prof. Leslie Sombers, Prof. Alexander. Nevzorov, Prof. Wayne Robarge for being a part of the advisory committee;
Prof. Alex Smirnov for discussions and suggestions;
Prof. Maxim Voinov for so many discussions and greatest help during research;
EVERYONE in the Prof. Smirnov/Smirnova group and Prof. Nevzorov group;
Prof. Nevzorov for probe sonicator and vacuum lyophilizer;
Prof. Jonathan Lindsey group for liquid nitrogen and chemicals;
TABLE OF CONTENTS
LIST OF TABLES ... viii
LIST OF FIGURES ...x
Chapter 1: Introduction ...1
1.1 Membrane Structures and Properties ...1
1.2 Lipid-Nano Hybrids Structure and Application ...7
1.3 Preparation and Characterization of Silica Supported Lipid Bilayer ...9
1.4 Interaction between Silica Beads and Lipid Bilayer ...12
1.5 Site Directed Spin Labeling Electron Paramagnetic Resonance ...16
Chapter 2: Effect of Silica on Surface Electrostatic Potential of Phospholipid Bilayer ..20
2.1 Introduction ...20
2.2 Materials and Methods ...31
2.2.1 Materials ...31
2.2.2 Liposome Preparation ...32
2.2.3 Liposome Characterization ...33
2.2.4 Silica Beads Supported Lipid Bilayer Preparation ...34
2.2.5 Silica Beads Supported Lipid Bilayer Characterization ...35
2.2.6 Liposome pH Titration Experiments ...36
2.2.7 Silica Beads Supported Lipid Bilayer pH Titration Experiments ...36
2.2.8 CW-EPR Measurements ...37
2.2.10 Reduction of Spin Labeled Liposomes and Silica Beads Supported Lipid
Bilayers ...38
2.3 Results and Discussions ...39
2.3.1 Choice of Lipids for Model Bilayers ...39
2.3.2 Liposome Size Distributions and Stability ...41
2.3.3 Control Experiments ...42
2.3.4 Determination of the Electrostatic Shift ΔpKael at the Liposome Surface ...43
2.3.5 Choice of Silica Support ...58
2.3.6 Determination of the Zeta Potential of Bare Silica beads and Silica Supported Bilayer ...59
2.3.7 Effect of Silica Support on Lipid Bilayer Electrostatics Determination of ΔpKasilica ...60
2.3.8 Spin-Labeling of Silica Nanoparticles ...72
2.3.9 Effect of Silica Supported on Dynamics of Phospholipid Bilayer ...74
2.3.10 Effect of Silica Support on Accessibility of Membrane Surface to Water Soluble Reducing Agents ...82
2.4 Conclusion ...84
Chapter 3. Effect of Silica Support on pKa Of Ionizable Sidechain Located at Membrane-Protein Interface of Model Transmembrane Peptide Incorporated into Phospholipid Bilayer ...85
3.1 Introduction ...85
3.2.1 Materials ...95
3.2.2 Peptide Spin Labeling ...96
3.2.3 Characterization of Double Labeled WALP Peptides ...97
3.2.4 Phospholipid Liposome Preparation ...97
3.2.5 Silica Beads Supported Lipid Bilayer Preparation ...97
3.2.6 Sample Characterization with DLS Size Measurement and Zeta Potential Measurement ...97
3.2.7 Liposome pH Titration Experiments ...98
3.2.8 Silica Beads Supported Lipid Bilayer pH Titration Experiment ...98
3.2.9 CW-EPR Measurements ...98
3.3 Results and Discussions ...99
3.3.1 Control Experiments: Effect of pH on Dynamics of WALP Peptide Incorporated in Liposomes or Silica Supported Bilayers ...99
3.3.2 Determination of the Interfacial pKa of Spin Labeled WALP (1Cys) Peptide Incorporated in LUVs ...100
3.3.3 Determination of the interfacial pKa of spin labeled WALP (2Cys) peptide incorporated in LUVs ...106
3.3.4 Effect of silica support on dielectric environment and protonation of pH sensitive labels at protein-membrane interface ...121
3.4 Conclusion ...128
LIST OF TABLES
Table 2.01 Intrinsic pKa0 of PTE-IMTSL and PTE-IKMTSL [94, 99] ...27 Table 2.02 Titration data for spin label adducts in buffer/isopropyl alcohol solutions of various composition [94, 99] ...28 Table 2.03 Interfacial pKai, intrinsic pKa0, polarity induced shifts ΔpKapol, and local dielectric constant ε measured and calculated for Triton X-100 with 1% PTE-IMTSL and PTE-IKMTSL [94, 99] ...30
Table 2.04 Experimental ΔpKael determined from the pH titration and the surface electrostatic potential, Ψ calculated for PTE-IMTSL liposome samples ...49
Table 2.05 Experimental ΔpKael determined from the pH titration and the surface electrostatic potential, Ψ calculated for PTE-IKMTSL liposome samples ...50
Table 2.06 Experimental ΔpKael determined from the pH titration using fit to Eq. 19 (top) and to Eq. 20 (bottom) and the surface electrostatic potential, Ψ calculated for silica bead supported IMTSL-PTE labeled bilayer samples...65
LIST OF FIGURES
Figure 1.01 Schematic structure of a phospholipid and lipid bilayer. C, H, O N, P atoms are colored grey, pale blue, red, blue and yellow, respectively.
https://en.wikipedia.org/wiki/Phospholipid ...2 Figure 1.02 Schematic structure of liposome.
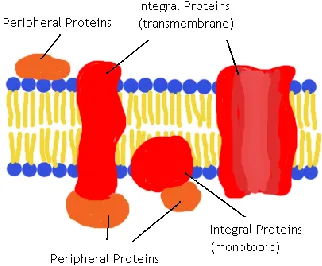
http://www.andros.com.tw/en/technology_en.htm ...2 Figure 1.03 Schematic structure of membrane protein.
https://commons.wikimedia.org/wiki/File:Membrane_protein.png ...2 Figure 1.04 Common head groups found in phospholipids. The depicted ionization state corresponds to physiological pH levels ...3 Figure 1.05 Schematic profile of the electrostatic potential across typical lipid bilayer and its decomposition into three major components adapted from [3] ...4 Figure 1.06 Chemical structure of zwitterionic lipids DMPC (1,2-ditetradecanoyl-sn -glycero-3-phosphocholine)...6 Figure 1.07 Cartoon illustrating supported lipid bilayer (SLB)
Figure 2.05 Chemical structure of Triton X-100 detergent (left), cartoon illustrating spin labeled PTE lipids incorporated in Triton X-100 micelle ...30 Figure 2.06 Cartoon illustrating vesicle formation mechanism, adapted from https://avantilipids.com/tech-support/liposome-preparation/ ...33
Figure 2.07 Chemical structure of 5-doxyl stearic acid ...38
Figure 2.08 Reduction of a nitroxide radical with sodium ascorbate produces an EPR-silent hydroxylamine ...38 Figure 2.09 Chemical Structure of PTE, POPC and POPG lipids ...40
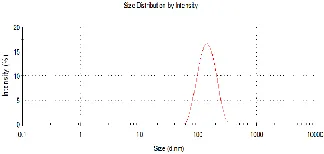
Figure 2.10 Size distribution by intensity of POPC LUVs as measured by DLS ...41 Figure 2.11 Representative intensity normalized CW X-band EPR spectra from pH titration control experiments of POPC 100nm LUVs doped with 1 mol % of non pH-sensitive PTE-MTSL (left), and silica supported lipid bilayer (right) ...42 Figure 2.12 Representative intensity normalized CW X-band EPR spectra from pH titration experiments of 1 mol % pH-sensitive PTE-IMTSL lipid incorporated into 100nm LUVs composed of POPC (left) and POPC 80% : POPG 20% (right) ...44 Figure 2.13 Representative intensity normalized CW X-band EPR spectra from pH titration experiments of 1 mol % pH-sensitive PTE-IKMTSL lipid incorporated into 100nm LUVs composed of POPC (left) and POPC 80% : POPG 20% (right) ...44 Figure 2.14 Decomposition of EPR spectrum from PTE-IKMTSL incorporated into POPC 80 mol %:POPG 20 mol % LUVs. Experimental spectra acquired at intermediate pH (black). Component of the experimental spectra corresponding to the neutral form of IKMTSL (blue). Component of the experimental spectra corresponding to the charged form of IKMTSL (red). The residual of fitting the experimental spectra to the sum of the simulated spectra (green) .46 Figure 2.15 Cartoon illustrating spin labeled PTE lipids incorporated into 100nm LUV ...47
Figure 2.16 pH titration curve of 1 mol % pH-sensitive PTE-IMTSL lipid incorporated into 100nm LUVs composed of POPC (blue) and POPC 80 mol % : POPG 20 mol% (red). Dashed lines are the best fit to single dissociation model Eq.11 ...49
Figure 2.17 pH titration curve of 1 mol % pH-sensitive PTE-IKMTSL lipid incorporated into 100nm LUVs composed of POPC (blue) and POPC 80% : POPG 20% (red). Dashed lines are the best fit to single dissociation model Eq.11 ...50
incorporated into lipid vesicles composed of POPC (left) and POPC 80% : POPG 20% (right) ...61 Figure 2.23 Cartoon illustrating spin labeled PTE lipids incorporated into vesicle that is coated on silica beads ...62 Figure 2.24 Decomposition of EPR spectrum from PTE-IMTSL incorporated into silica supported POPC bilayer. Experimental spectra acquired at intermediate pH (black). Component of the experimental spectra corresponding to the neutral form of IMTSL (blue). Component of the experimental spectra corresponding to the charged form of IMTSL (red). The residual of fitting the experimental spectra to the sum of the simulated spectra (green) .63
Figure 2.25 pH titration curve for 1 mol % pH-sensitive PTE-IMTSL lipid incorporated into silica supported bilayer POPC (blue) and POPC 80% : POPG 20% (red). Dashed lines are the best fit to single dissociation model Eq.11, solid lines are the best fit to double dissociation model Eq.20 ...65
adapted from [65] (right). Solid lines are the best fit to dependent double dissociation model Eq.42 ...115 Figure 3.12 Calculated pKa1 values corresponding to WALP (2cys) dependent double dissociation (filled circle) and calculated pKa values corresponding to WALP (1cys) single dissociation (open circle) as a function of spin label attachment site’s respective alpha carbon distance from the bilayer center. IKMTSL labeled WALPs in DOPG (red) DOPC/DOPG (purple) and DOPC (blue) bilayers (left). IMTSL labeled WALPs in DOPG (red) and DOPC/DOPG (purple) bilayers (right) ...117
Chapter 1 Introduction
1.1 Membrane structures and properties.
Figure 1.01 Schematic structure of a phospholipid and lipid bilayer. C, H, O N, P atoms are colored grey, pale blue, red, blue and yellow, respectively.
https://en.wikipedia.org/wiki/Phospholipid
Figure 1.02 Schematic structure of liposome. http://www.andros.com.tw/en/technology_en.htm
Figure 1.03 Schematic structure of membrane protein.
Major physio-chemical characteristics of membranes include electrostatics, dielectric constant and hydration. Phospholipids hydrophilic head group at the membrane-water interface can possess a variety of polar or charged groups that create electrostatic potentials, while the interior of the bilayer is highly hydrophobic that favors primarily nonpolar and less polar residues of transmembrane proteins embedded in the lipid bilayer, (strongly polar amino acid only account for 8.5% and charged amino acid are only 1.2% of transmembrane sequences [1]), as a result, electrostatic environment within lipid bilayer and at the surface are very different. If we treat polar and charged head group as parallel plate and hydrocarbon interior as insulation system, when external field is applied to this system, charges which are localized at the membrane-water interface will respond by rearranging to partially cancel the applied field. The extent of such response is called dielectric constant.
Figure 1.04 Common head groups found in phospholipids. The depicted ionization state corresponds to physiological pH levels.
phosphate moiety and carries an electric dipole moment of about 10 D [2], and phosphatidylglycerol (PG) is a class of anionic phospholipids that incorporates neutral glycerol and negatively charged phosphate moiety.
Figure 1.05 Schematic profile of the electrostatic potential across typical lipid bilayer and its decomposition into three major components adapted from [3].
transmembrane potential, Ψt results from the net separation of charges between aqueous phase and bilayer interior and ionic concentration gradient across the membrane since the membrane interior is hydrophobic in nature and poorly permeable to ions. This potential is negative and is one order of magnitude smaller than Ψd. (3) The surface potential, Ψs, originates from charged head groups and phosphate moiety, as well as adsorbed ions and the counter ions that reside closely in the vicinity of the head groups on both sides of the membrane. Thus it depends on the amount and type of the charged lipids in the bilayer and the concentration of protons and ions. This potential is negative and usually smaller than Ψd [3]. In this project we are interested in the surface potential Ψs, details will be discussed in chapter 2.
Figure 1.06 Chemical structure of zwitterionic lipid DMPC (1,2-ditetradecanoyl-sn -glycero-3-phosphocholine).
For such a nonhomogeneous system, computation of the position-dependent dielectric constant ε, which is referred to as the dielectric profile, represents a difficult problem. The head group dielectric gradient and its variations (from the ester region, to phosphate to choline serine or glycerol etc.) is very difficult to model. Besides, different lipid bilayers have different ε distributions along the bilayer axis, this is dependent on the nature of head group interactions (between lipids, lipid-solvent, lipid-ions and fluidity of the bilayer). Medium with higher dielectric constant has greater ability to stabilize charges, thus non polar hydrocarbon tails at the interior region with lower dielectric constant are highly impermeable to most ions and polar molecules, and thus the dielectric gradient significantly affects transportation of ions and nutrients across the lipid bilayer. In addition, dielectric gradient is also what drives membrane protein folding and assembly.
membrane fusion [9] and regulate phase transition [10], govern transport of charged or polar molecules and nutrients through membrane during metabolic processes and signaling events [11], and directly involved in Protein-protein association [12] as well as structure and dynamics of DNA [13]. In conclusion, it is imperative to develop and measure lipid bilayer electrostatic potential and dielectric constant at well-defined positions with respect to the membrane-water interface and lipid-protein interface within such a heterogeneous system to further decipher the mechanisms of biological phenomena in cells.
1.2 Lipid-nano hybrids structure and applications.
Liposomes prepared from synthetic lipids allow learning about biological processes taking place in living organisms, thus are commonly used as models of complex cell membranes [14-17]. Despite their extraordinary usefulness, problems with size polydispersity as well as physical and chemical stability of liposomes often arise. Supported lipid bilayer (SLB) formed from liposomes, both on planar and spherical substrates, are better candidates for addressing some of these issues [18].
The robust inorganic core of SSLB enhances membrane stability of the wrapped lipid bilayer. The diameter of SSLB is determined by the diameter of the support. SSLB forms homogeneous membrane structures if the support core is monodispersed, thus solving the polydispersity and physicochemical stability issue. Lipid bilayer provides a biocompatible interface that allows for protein insertion/coupling and drug containment, support material possess optical, electrical, magnetic, and catalytic properties. SSLB preserve the key membrane functions, at the same time offering a wide range of opportunities to 1) systematically modulate pH and temperature, 2) vary the composition of the bilayer, and 3) allow to introduce specific receptors/membrane proteins into the supported membrane [21]. To summarize, SSLB offers opportunities as promising candidates for biomedical and biotechnological applications in materials science, drug delivery, imaging, and biosensor development.
Such a hybrid system combining all of the positive features of liposomes and inorganic material have been successfully formed on silica, polystyrene, and magnetic beads whose sizes range from tens of nanometers to several micrometers [22]. Because of spontaneous fusion of liposomes onto the naturally hydrophilic and biocompatible material, silica is most extensively studied for lipid interaction, and a large body of literature exists on this topic [23, 24]. It is evident that a thin water layer (∼1 nm) separates the lipid bilayer from the silica surface to achieve a mobile bilayer [25, 26]. Thus supported lipid bilayers (SLB) retain many characteristics of natural cell membranes such as lateral fluidity, incorporation of proteins, phase separation, and impermeability to ionic species [27-29]. Although most experiments were performed on planar silica surfaces, silica beads were also studied [17, 30-38]. Lipid-coated silica beads have been used for important delivery systems and analytical assays [18, 39, 40], employed for detection of anti-phospholipid antibodies in human body. Silica supported lipid bilayer have been used to measure the affinity of biologically active substances to biological membranes, and found applications in chromatography for the separation of proteins. In this project we focus on silica beads supported lipid bilayer for our discussion.
1.3 Preparation and characterization of silica supported lipid bilayer.
1. SSLB surface charge. Lipid bilayer affinity to silica beads surface varies in accordance with the sequence: anionic lipids<neutral lipids<cationic lipids [22]. Silica supported lipid bilayer are generally restricted to cationic and neutral lipids and only allow a limited fraction (no more than 20%) of anionic lipids. Additional charge or specific chemical interactions have been harnessed to facilitate SLB formation using a broad range of lipids [42].
2. Particle size and curvature. Simulations of lipid−colloid interactions suggest that the liposome curves away from the small particles and encapsulates the large particles [43]. Another early theoretical work indicates the balance of liposome adhesion energy and the curvature energy is responsible for driving liposome deformation and fusion onto the silica surface [44]. Later, Richter and co-workers reported that liposomes are adsorbed only at highly curved particles, whereas fusion is facilitated at low curvature [45]. There is some evidence that local curvature might mechanically control the spatial organization of membrane composition and properties such as phase transition [46].
3. Bilayer fluidity, temperature, size and concentration are also found to be important for liposome fusion with silica [23, 24].
salt, little/no adsorption or fusion of vesicles onto silica occurs while an increase in the solution ionic strength promote neutral lipid fusion [48]. Full wrapping was found to occur only for intermediate salt concentrations [49] because high salt concentrations (>90 mM NaCl, pH 7.4) can lead to silica precipitation. Divalent metals such as Ca2+ have also been proved to be able to modulate SLB formation.
Liposome formed on planar surfaces is often studied by quartz crystal microbalance with dissipation (QCM-D), atomic force microscopy (AFM), and fluorescence microscopy. These methods probe liposome adsorption, fusion with a surface, lipid organization on a surface, and fluidity [50]. For silica beads solution-phase, available measurements are listed below.
1. The calcein leakage test is a commonly used assay for probing membrane integrity in biochemistry [51].
3. Cryo-TEM is a powerful technique for measuring the morphology of liposomes after adsorption [53]. Samples are prepared by quick freezing in liquid ethane, and both intact liposomes and NP-supported bilayers can be well resolved [17] .
Figure 1.08 Formation of silica beads supported lipid bilayer, by cartoon (left) and by cryo-EM (right) adapted from [17].
4. Cell uptake studies help confirm NP adsorption reaction [54]. Free PC liposomes are not internalized by cells because of their antifouling property, whereas liposome/NP complexes are often taken by cells.
5. Dynamic light scattering (DLS) is used to study the size and zeta potential of liposomes, NPs, and their complexes.
6. Differential scanning calorimetry (DSC) is powerful thermal chemistry methods for probing the lipid phase transition [42].
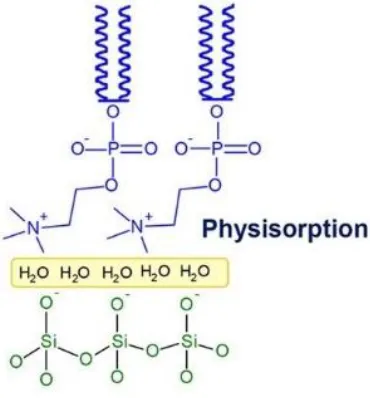
1.4 Interaction between silica beads and lipid bilayer
physisorption (Figure 1.09). We are interested in studying physisoption because it is cost-effective and readily available to most researchers [50].
Figure 1.09 SLB on SiO2 based on the electrostatic and van der Waals force and a thin layer of water separating the two surfaces. Adapted from [50].
Depending on the composition, size, and surface chemistry of both liposomes and silica surfaces, various interaction mechanisms are proposed. The kind and strength of interactions between membrane and solid surface are very important for stabilization of the supported phospholipid layers on the surface, but they are still not well understood.
der Waals force is another main attractive force responsible for liposome adsorption by silica beads [25, 57, 58].
The good stability of silica beads supported lipid bilayer is achieved through balanced interactions between the silica beads surface and the bilayer. A question therefore arises whether and how silica beads surface and these above interactions affect lipid bilayer properties listed below.
1. Transition temperature. This is characteristic of structural properties of lipid bilayers. Silica beads surface might cause perturbations to supported lipid phase transition. 2. Interleaflet distribution. Each leaflet in a SLB is in a different environment: the outer
one is exposed to the bulk solution, while the inner one faces the solid surface. Though it is commonly assumed to be symmetrical, the interleaflet distribution induced membrane asymmetry has also been extensively investigated [59, 60].
3. Mobility. Lipid assemblies as a whole can be laterally mobile and undergo collective shape changes, to what extend they are immobile on silica surface need to be fully studied.
5. Surface defects and its patterns on the SLB is a very important consideration for current and prospective applications. For example, the activity of lipid digesting enzymes was proposed to be triggered by much less than one percent of point-defects in membranes, membranes that contains a few percent of surface defects may be acceptable for protein adsorption studies [63].
6. Ion permeability. Silanol groups (Si-OH) are believed to induce electrostatic interactions with membrane proteins or the quaternary ammonium groups of phosphatidylcholine leading to membrane destabilization and thus changing its permeability [64].
for designing reliable and practical lipid-nanostructured hybrids for materials and biological applications.
1.5 SDSL EPR
Figure 1.10 Electronic spin energy levels in magnetic field.
a
Figure 1.11 Chemical structure of nitroxide IMTSL and its three EPR signal with three absorption peaks. The electron spin density of a nitroxide which primarily located on the nitrogen pz orbital is affected by enviromental and structural changes and determines the magnitude of hyperfine interaction. Adapted from [65].
Figure 1.12 Reversible protonation of nitroxides attached to the side chain of biopolymer.
Another useful information that can be obtained from EPR parameters is the rotational correlation time τc, the time necessary for the spin label to rotate through an angle of a radian. It is a mobility parameter in the time scale of 0.1 to 100 nsec that can be detected by EPR spectroscopy. Generally the slower rotational motion in radical, the broader EPR spectrum.
Chapter 2 Effect of silica on surface electrostatic potential of phospholipid
bilayer.
2.1 Introduction
Surface electrostatic potential has long been recognized to play a fundamental role in key processes of cell functioning. Membrane stability, flexibility and fusion, membrane transport,
protein insertion and folding, energy generation and its utilization, depend strongly on the
surface interactions.
A macroscopic description of the surface electrostatic potential is given by the Gouy-Chapman theory [68], which assumes that the phospholipid membrane is a featureless continuous medium and the lipid bilayer interface is a perfect impenetrable planar surface, and states that
ion double layer is formed at a charged surface. Thus the interfacial potential at the charged surface is attributed to the presence of ions attached to the bilayer surface and to an equal number of ions of opposite charge in solution. Surface electrostatic potential is defined as a difference between the potential at the bilayer surface and the bulk. This theory gives the relationship between Ψs, the electrostatic potential at the surface, the bilayer surface charge
density and the ionic concentration in the aqueous phase. The limitation of the theory is in
A atomic-scale description of the surface electrostatic potential is given by the molecular
dynamics (MD) simulations [69], which assumes each atom is the source of an electrostatic
field and it “feels” the electrostatic field of all other atoms. MD simulations compute the forces
between all atoms in the system and to study their motion at times up to hundreds of
nanoseconds. However, this approach usually gives little insight into the fundamental physical
processes in the membranes, since membrane is an integral assembly that possess integrated
functional properties, thus numerous atomic details mask the general picture.
A middle level description of electrostatic properties is highly needed, but it is not easily
achievable due to technical limitations associated with each method and problems arising in
the comparison of results obtained by different methods. There are only limited analytical
methods for assessing electrostatic properties of the biological interface. NMR [70, 71], electron-electron double resonance [72] atomic force [73, 74], interaction force measurements [75], fluorescent spectroscopy [76-79], , and spin probe [80-84]. All of these methods have some advantages as well as some limitations.
charged bilayer and free in the bulk solution. However the exact location of the measured potential with respect to the bilayer surface is unknown, and lipid composition may affect probe’s Gibbs energy and cause additional errors [4].
The second group of EPR and NMR methods is based on measurements of collision frequency between a freely diffusing charged nitroxide with another nitroxide attached to bilayer interface or a biomolecule such as protein and DNA [72, 88]. In NMR experiment the site-specific proton relaxation enhancement upon collisions of exposed residues with charged paramagnetic relaxers it measured [70, 89] This method gives an accurate estimation of electrostatic potential for small molecules [90], however the exact location is still uncertain for larger membrane system [4], and data sets obtained by NMR method do not yield consistent value [91].
membrane interface. In addition, one of the most common fluorescent probe 4-alkyl-7-hydroxycoumarin was found to be located approximately within the ester group region of the lipid bilayer that the ionizable OH-group of coumarin is unavoidably positioned below the lipid phosphate moiety, such a location is deeper than one would wish to have for studying the bilayer surface potential [95].
Site directed spin-labeling EPR is a good alternative to fluorescence labeling of membrane system. Nitroxide are relatively small molecules and possess lesser dipolar moment than the fluorescent tags, thus introducing a minimal perturbation in the vicinity of the probe [96]. Besides, EPR spin labeling method provides complementary data on local structure and dynamics of biomolecules [97]. Lastly, it can be applied to nontransparent/opaque samples that are difficult to study with optical method.
perturbation to the lipid bilayer. Last but not least, the nitroxide moiety is positioned exactly at the membrane-water interface for surface electrostatic potential measurement.
PTE-IMTSL and PTE-IKMTSL undergo reversible protonation at the tertiary amine during acid-base equilibrium at the membrane–water interface. Protonated and non-protonated forms of the nitroxide moiety, have different magnetic parameters resulting in different EPR spectra. Once positioned at the membrane-water interface, protonated and non-protonated forms of PTE-IMTSL and PTE-IKMTSL show different rotational dynamics that is directly detected by EPR spectra. Electrostatic potential of the membrane affects the concentration of ions in the immediate vicinity to the membrane surface and equilibrium of charged and uncharged species, thus the observed pKa of the probes is ultimately a function of the bilayer electrostatic surface potential.
For liposome/vesicle the observed pKa of the spin probe at membrane-water interface is different from pKa of the probe in aqueous phase, the observed interfacial pKai contains contributions arising from the change in the Gibbs free energy ΔGupon transferring the probe from the bulk water into a media with a different electric permittivity E contributing to ΔGpol, and a different local electric potential Ψ contributing to ΔGel. The observed pKa of the probe is determined by both local electrostatic potential and the effective interfacial dielectric constant. Because pKa = −log10 (Ka), where Ka is the equilibrium constant of protonation of the nitroxide moiety tertiary amino group, the probe interfacial pKai is given by [4, 76, 94, 95, 98, 99].
Where pKa0 is the intrinsic pKa of the spin probe in aqueous phase, ΔpKapol and ΔpKael are the polarity and electrostatic contributions, respectively. The electrostatic shift, ΔpKael, is related to the electrostatic surface potential, Ψ, as
𝛥𝑝𝐾𝑎𝑒𝑙 = −𝑒𝛹
𝑙𝑛(10) 𝑘𝑇 𝐸𝑞. 2
Where e is the elementary charge, k is the Boltzmann’s constant, and T is absolute temperature.
If the lipid bilayer is positioned on silica surface, another additive component is ΔpKasilica from silica surface charge electrostatic contribution. Thus the interfacial pKa of the probe can be calculated as
𝑝𝐾𝑎𝑖 = 𝑝𝐾𝑎0+ Δ𝑝𝐾𝑎𝑝𝑜𝑙+ Δ𝑝𝐾𝑎𝑒𝑙 𝑜𝑟 Δ𝑝𝐾𝑎𝑠𝑖𝑙𝑖𝑐𝑎 𝐸𝑞. 3
Figure 2.02 Schematics of four models to investigate the effect of silica support on interfacial electrostatics of a phospholipid bilayer.
of intrinsic pKa0, interfacial polarity shift ΔpKapol, the shift ΔpKael due to phospholipid membrane surface charge, and silica beads surface charge electrostatic contribution, ΔpKasilica. Since PTE-IMTSL and PTE-IKMTSL are not soluble in water, IMTSL and IKMTSL molecules were first modified with a mercaptoethanol (ME) to create IMTSL – 2-mercaptoethanol adduct and IKMTSL – 2- 2-mercaptoethanol (Figure 2.03) to increase the molecule’s solubility in aqueous medium. Note that the PTE-IMTSL and PTE-IKMTSL has longer hydrophobic tails and ionizable phosphate moiety compared to the IMTSL-ME and IKMTSL-ME adduct. However, it was found that the tertiary amino functionality of spin labels are not affected by other substitutions or other ionizable groups, thus it is expected that the hydroxyethyl moiety of ME is mimicking the inductive effects of the PTE head group attachment rather well and the pKa value of IMTSL-ME and IKMTSL-ME in water provide a close estimate of the intrinsic pKa0 of PTE-IMTSL and PTE-IKMTSL [94]. Experiments were conducted and analyzed by Prof. M. Voinov and Dr. C. Scheid in our group and the results were published in [94, 98, 99].
Figure 2.03 Chemical structure of IMTSL-ME and IKMTSL-ME.
Table 2.01 Intrinsic pKa0 of PTE-IMTSL and PTE-IKMTSL [94, 99].
Spin labeling Temperature °C pKa0
IMTSL 20 3.33 ± 0.03
The IMTSL-ME and IKMTSL-ME adducts were then dissolved into a series of water-isopropyl alcohol solutions with different volume ratio so that the dielectric constants ε of the homogeneous solutions were known, to build a calibration between dielectric constant ε and the interfacial pKai. Experiments carried out and analyzed by Prof. M. Voinov and Dr. C. Scheid to examine dependence of pKai versus bulk ε, and the results were published in [94, 98, 99].
Table 2.02 Titration data for spin label adducts in buffer/isopropyl alcohol solutions of various composition [94, 99].
IMTSL-ME T = 20°C
[i-PrOH], v/v %
0 20 30 40 50 60
Bulk ε 80.37 68.35 61.95 55.26 48.22 40.85
pKai 3.33
± 0.03 2.77 ± 0.03 2.58 ± 0.06 2.27 ± 0.06 2.14 ± 0.08 1.77 ± 0.07 pKai = 0.2461(±0.1104) + 0.0383(±0.0019) x ε R2 = 0.991
IKMTSL-ME T = 17°C
[i-PrOH], v/v %
0 20 30 40 50 60
Bulk ε 81.52 69.31 62.80 55.98 48.84 41.34
pKai 6.16
± 0.03 5.67 ± 0.03 5.21 ± 0.02 4.95 ± 0.02 4.62 ± 0.03 4.28 ± 0.03 pKai = 2.2996(±0.1033) + 0.0475(±0.0017) x ε R2 = 0.995
Figure 2.04 pKa of IMTSL-ME and IKMTSL-ME vs bulk dielectric constant ε of water−i-PrOH mixtures. The corresponding data for IMTSL-ME is shown as filled squares, for IKMTSL-ME is shown as filled triangle. The error bars are comparable with the size of symbols. The corresponding linear regressions are shown as solid lines with parameters given in table 2. Reproduced from [94, 99].
higher effective dielectric constants at the surface of the micelles than PTE-IMTSL, this is because IKMTSL structure is more bulky compared to IMTSL and its linker head protrudes further into the aqueous phase where local dielectric constant ε increases closer to polar bulk water dielectric constant ε [99]. Notably, ε = 60 of Riske et al. [84] is the same as ε ≈ 60 estimated for the interfacial location of the reporter nitroxide of IMTSL-PTE incorporated into
Triton X-100 micelles.
Figure 2.05 Chemical structure of Triton X-100 detergent (left), cartoon illustrating spin labeled PTE lipids incorporated in Triton X-100 micelle.
Table 2.03 Interfacial pKai, intrinsic pKa0, polarity induced shifts ΔpKapol, and local dielectric constant ε measured and calculated for Triton X-100 with 1% PTE-IMTSL and PTE-IKMTSL [94, 99].
Spin labeling pKai pKa0 ΔpKapol ε
IMTSL 2.52 ± 0.01 3.33 ± 0.03 -0.81 ± 0.03 59 ± 4 IKMTSL 5.40 ± 0.03 5.98 ± 0.04 -0.58 ± 0.04 65 ± 3
Finally, POPC or mixture of POPC and POPG liposome with spin labeled PTE were coated onto silica beads, and using the previously determined contributions to observed pKa, ΔpKasilica from Eq.3 was determined.
These titration experiments lead to a wealth of information pertaining to the surface electrostatic properties. In this chapter, we report on: 1) the effect of the linker and the nature of the nitroxide probe (IKMTSL vs IMTSL) on the measurements of the membrane surface potential of large unilamellar vesicles (LUVs), 2) the effect of lipid composition (the fraction of negatively charged lipids) and silica support on the membrane surface potential of LUVs, and 3) effect of silica support on the structure and mobility of silica supported phospholipid bilayer.
2.2 Materials and methods
2.2.1 Materials.
non pH-sensitive analog PTE-MTSL were synthesized from PTE and MTSL and crude product was purified similar to previous published procedure [4, 94, 98, 99]. Non-porous and non-functionalized silica beads (310nm, ∼3.407 x 10¹² beads/ml) were purchased from Bangs Laboratories (Fishers, IN) in 10 wt. % solids in DI water and used as received without further surface cleaning. Silica beads have a size coefficient of variation (CVs) of 10-15%. All other chemicals were purchased from Sigma-Aldrich (St. Louis, MO) unless otherwise indicated. Water used for preparation of the liposome and silica supported lipid bilayer suspensions and buffer solution was from Milli-Q system (resistivity 18.2 MΩcm).
2.2.2 Liposome preparation.
vesicles (MLVs). MLVs were stored at -80°C freezer for later experiments. Unilamellar vesicles (LUVs) were prepared by extruding the MLVs sample using polycarbonate membranes with 100nm pores and mini extruder (Avanti polar lipids, Alabaster, AL) at room temperature. The resulted clear ULVs solutions were transferred to a clean 1.5mL Eppendorf plastic vial and stored at 4°C fridge at neutral pH no more than 3 days to guarantee sample freshness.
Figure 2.06 Cartoon illustrating vesicle formation mechanism, adapted from https://avantilipids.com/tech-support/liposome-preparation/.
2.2.3 Liposome characterization.
(10*10*45 mm) and DLS measurements were performed on a Zeta Sizer Nano ZS (Malvern Instruments Inc., Westborough, MA) instrument. Dynamic light scattering is a non-invasive technique for measuring the size of particles and molecules in suspension. The maximum count rate for the measurement was kept at 500-600 kcps, thus the LUVs and SUVs concentration was controlled at 0.25 w/v %.
2.2.4 Silica beads supported lipid bilayer preparation.
formation of single-supported lipid bilayer wrapping silica beads, further engulfment by another vesicle did not occur [41]. It was found that mixing of approximately equal volumes of the two materials was preferable to the addition of small quantities of one into the other; the latter sometimes resulted in precipitation of the nanoparticles, possibly due to initial inhomogeneity upon mixing [34]. Following reassembly, the mixture was centrifuged for 10min at 1000xg. After discarding the supernatant, the lipid bilayer coated silica beads were re-suspended in 0.5 x PBS buffer (composition is Na2HPO4 5mM, KH2PO4 0.9mM, NaCl 68mM, KCl 1.3mM) at pH=7.4. Centrifugation and re-suspension steps were repeated 6 times to remove all remaining unbound SUVs, resulting in single lipid bilayer covered silica beads. The top supernatant after each wash was tested by CW EPR, showing a nitroxide signal intensity decay to zero after the last wash, indicating that all SUVs were removed from the prep. After each washing, the fraction containing silica beads supported lipid bilayer was tested by CW EPR. The nitroxide signal intensity was determined to be approximately constant after resuspension in a few last steps, confirming stable SLB formation. Samples were then stored at 4 °C at neutral pH for no more than 3 days to guarantee freshness.
2.2.5 Silica beads supported lipid bilayer characterization.
2.2.6 Liposome pH titration experiments.
In all of the experiments, the pH values were measured at room temperature with an Orion microcombination pH electrode 98 series (Thermo Electron Corporation, Beverly, MA) with four points calibrated using standard VWR (VWR International) solutions: at pH=1.68, 4.00, 7.00, 10.00. Approximately 80uL of lipid suspension (5 w/v %) was placed into a 1.5mL Eppendorf tube and pH of the solution was adjusted by titration with aliquots of 0.25M, 0.10M, 0.05M, 0.025M HCl solution or NaOH solution to reach the desired pH. All of the titration experiments pH of lipid samples was proceeded from high-to-low, and samples were measured at increments of about 0.3pH units. Samples were lightly vortexed after addition of the abovementioned titrant and sit at room temperature for approximately 25min to assure complete equilibration of the inner vesicle space and outer water bulk solution.
2.2.7 Silica beads supported lipid bilayer pH titration experiments.
2.2.8 CW-EPR measurements.
Liposome samples or concentrated silica supported lipid bilayer samples were drawn into polytetrafluoroethylene capillary (i.d. = 0.81 mm, o.d. = 1.12 mm, NewAge Industries, Inc., Southampton, PA) subsequent to pH equilibration. The capillaries were then folded and inserted into a 3 × 4 mm clear fused quartz tube open from both ends (VWR International, Radnor, PA). Continuous wave (CV) measurements were conducted on a Bruker (Billerica, MA) ELEXSYS E500 spectrometer at approximately 9.5 GHz (X-band) at room temperature. 2048 point spectra were collected over a 100 G range with center around 3500 G. The modulation amplitude was 1 G and the modulation frequency was 100 kHz. The time constant was set at 20.48 ms with a 30.65 ms conversion time and a 30 s sweep time. The incident microwave power was 2 mW. Normally, about 30-100 scans were averaged for each sample.
2.2.9 CW-EPR characterization of local dynamics of 5-doxyl-SA incorporated into
liposomes and silica beads supported lipid bilayers.
Figure 2.07 Chemical structure of 5-doxyl stearic acid.
2.2.10 Measurements of accessibility to nitroxide probe by monitoring the kinetics of
nitroxide reduction by ascorbic acid or sodium ascorbate.
The freshly prepared samples were placed in a 1.5mL Eppendorf vial and mixed with sodium ascorbate at pH=7.4 or sodium ascorbic acid pH=3.0 solution in an appropriate ratio and immediately transferred to a micro capillary tube and inserted straightly into a 3 × 4 mm clear fused quartz tube open from one ends (VWR International, Radnor, PA). Continuous wave (CV) measurements were conducted on a Bruker (Billerica, MA) ELEXSYS E500 spectrometer at approximately 9.5 GHz (X-band) at room temperature and 2D spectra were collected versus time. Spectrometer settings were same to the EPR titration measurement above.
2.3Results and discussions
2.3.1 Choice of lipids for model bilayers.
Phosphocholine (PC) lipids deposited on silica is the most commonly used system because PC lipids represent a major component of the eukaryotic cell outer membrane [102]. Small unilamellar liposomes prepared from PC lipids readily fuse with silica under physiological conditions [31, 42, 103-106]. The PC head group contains a choline and a phosphate. Choline is a quaternary ammonium cation and is always positively charged. Phosphate has a pKa of less than 2, in the pH range used in most of the experiments, the phosphate is deprotonated and negatively charged. Therefore, the PC head group has a net charge of zero. To investigate effect of lipid composition on electrostatics we also utilized anionic lipid phosphatidylglycerol (PG), the most abundant negatively charged lipid in prolaryotic membranes, to a maximum of 20 mol % content, since exceeding this amount of anionic lipid may perturb SLB stability [17]. It should be noted that the anionic lipid contents of cell plasma membranes often exceed 20%.
(1,2-dipalmitoyl-sn-glycero-3-phosphocholine) and DPPG dipalmitoyl-sn-glycero-3-phospho-(1'-rac-glycerol) (sodium salt)), but Tm of these two lipids are as high as 41°C. DMPC (1,2-dimyristoyl-sn-glycero-3-phosphocholine) and DMPG (1,2-dimyristoyl-sn-glycero-3-phospho-(1'-rac-glycerol) (sodium salt)) with shorter chain length C14 still have Tm = 23°C. Thus we selected POPC ((1-hexadecanoyl-2--(9Z-octadecenoyl)-sn-glycero-3-phosphocholine)) and POPG (1-hexadecanoyl-2-(9Z-octadecenoyl)-sn-glycero-3-phospho-(1'-rac-glycerol) (sodium salt)) as our model lipid bilayer. POPC and POPG mimic mammalian phospholipid composition since it has one saturated chain in the sn-1 position and one unsaturated chain in the sn-2 position, here POPC and POPG bilayers can serve as good model for membranes and silica supported phospholipid membranes.
2.3.2 Size distribution and stability of liposomes.
The Z-Average diameter of liposomes was obtained is an intensity-weighted mean diameter derived from the cumulants analysis. For liposomes prepared by probe sonication and measured shortly after preparation, the size was determined to be about 50nm. For liposomes prepared by extrusion through 100nm membrane and measured shortly after, the homogenous size was consistent and was determined to be around 135nm. 135 nm result is somewhat larger than 100nm membrane pore size, because DLS measures the hydrodynamic diameter which includes the hydration sphere (surrounding water and salt), Thus DLS size, in general, depends on the size of the liposome core, the surface structure, and the type and concentration of ions in the medium. The width of size distribution reported here is the intensity-weighted size distribution. Though some researchers use volume or number size distribution converted from intensity, DLS tends to overestimate the width of the peaks in the distribution and this effect can be further magnified by the transformations to volume and number. Previously, Dr. A. Koolivand and Dr. M. Donohue in our group had demonstrated that no significant changes of vesicle size was observed when the pH of the samples changed from 7.3 to 2.8, and the size of the liposomes remained constant over the time period of 16-18 hours for samples kept at room temperature, thus it can be concluded that the liposome samples are stable under the experimental conditions.
2.3.3 Control experiments.
Before incorporating PTE-IMTSL and PTE-IKMTSL spin labeled lipids into charged lipid vesicles and coating on silica, experiment of PTE-MTSL nonionizable nitroxide labeled lipids were first used as control to check for the following effects: (1) effect of lipid phosphatidyl group protonation below pH = 2.0 on lipid packing and nitroxide tumbling is negligible; (2) the immediate environment (i.e. microviscosity and polarity) of nitroxide tethered to the lipid polar head is not affected by pH, thus the ionizable nitroxide mobility change is only affected by protonation upon pH titration. In addition it can be noticed that spectra of silica supported lipid bilayer is broader than spectra of liposome, details will be discussed later in section 2.3.8.
2.3.4 Determination of the electrostatic shift ΔpKael at the liposome surface.
For both PTE-IMTSL and PTE-IKMTSL, spin labeled lipids were incorporated into (A) zwitterionic lipid POPC and (B) mixed 80 mol % POPC with 20 mol % anionic lipid POPG to investigate effect of lipid surface charge on interfacial electrostatics. Representative spectra (normalized by intensity) for each spin labeled lipid are shown in Figure 2.12 and 2.13.
Figure 2.12 Representative intensity normalized CW X-band EPR spectra from pH titration experiments of 1 mol % pH-sensitive PTE-IMTSL lipid incorporated into 100nm LUVs composed of POPC (left) and POPC 80% : POPG 20% (right).
At the higher pH all nitroxides exist as non-protonated form and at the lower pH all nitroxides exist as protonated form, while at the intermediate pH spectra are a superposition of both forms. The intensities of each form can be obtained by simulating EPR spectra at different pH levels using reference spectra corresponding to protonated and non-protonated forms by EWVoigt program developed by Dr. Smirnov. This simplified slow chemical exchange model assumes a linear superposition of the spectra from the non-protonated and protonated specie, FN (B) and FNH+ (B) respectively.
𝐸 (𝐵) = 𝑎 · 𝐹𝑁 (𝐵) + 𝑏 · 𝐹𝑁𝐻+ (𝐵) 𝐸𝑞. 4
For the decomposition procedure, spectra FN (B) and FNH+ (B) are measured experimentally and then coefficients a and b are derived in a course of least-squares procedure involving continuous adjustment of the spectral positions due to a shift in the resonator frequency. In addition, the phases of FN (B) and FNH+ (B) were allowed to vary to account for some admixture of an out-of-phase dispersion component that could be present in EPR spectra from liquid aqueous samples [123]. Examples of a spectral decomposition is shown in Figure 2. 14. The fit residuals, difference between the experimental and simulated spectra show only negligible deviations, thus demonstrating the validity of this model for liposome samples
The fraction of the non-protonated form of the nitroxide f is then calculated from the double integrals DN and DNH+ of the corresponding FN (B) and FNH+ (B) spectra, and was plotted against pH to yield the titration data points.
𝑓 = 𝐷𝑁
Liposome with diameter larger than 100nm can be treated as planner samples and the curvature effect on lipids packing density can be neglected. Lipid bilayer is highly impermeable to most ions and polar molecules, so gramicidin A (gA) was incorporated into liposomes to assure a complete pH equilibration between bulk and inner aqueous volume of liposomes. gA consists of 15 amino acids and forms β-helix. In lipid bilayers gA form a dimer with another gramicidin molecule to form an ion channel. One half of the dimer situates itself on one side of the membrane bilayer while the other half of the dimer is joined to it while sitting in the other half of the membrane bilayer. A single channel opening event may allow flux of ions approximately 106-7 [107]. Thus we expect evenly distributed spin labeled PTE-IMTSL or PTE-IKMTSL in both inner and outer leaflets to experience the same pH and exactly the same surface electrostatics environment and have equal pKai values.
The titration data were plotted as of fraction of neutral spin labels vs. pH and were fitted to the Henderson-Hasselbach equation (for derivation, see equations 6 through 11) the fitting results are shown in Figures 2.16-2.17.
𝑝𝐻 = 𝑝𝐾𝑎 + 𝑙𝑜𝑔 [𝑁]
[𝑁𝐻+] 𝐸𝑞. 6
[𝑁]
[𝑁𝐻+]= 10𝑝𝐻−𝑝𝐾𝑎 𝐸𝑞. 7
𝑓 = [𝑁]
[𝑁𝐻+] + [𝑁] 𝐸𝑞. 8
[𝑁]
[𝑁𝐻+] =
𝑓
1 − 𝑓 𝐸𝑞. 9
Thus
[𝑁]
[𝑁𝐻+]=
𝑓
1 − 𝑓 = 10
𝑝𝐻−𝑝𝐾𝑎 𝐸𝑞. 10
𝑓 = 10
(𝑝𝐻−𝑝𝐾𝑎)
1 + 10(𝑝𝐻−𝑝𝐾𝑎) 𝐸𝑞. 11
where [N] represents the concentration of non-protonated form of nitroxide, [NH+] represents the concentration of protonated form of nitroxide, and f represents the fraction of the non-protonated form of the nitroxide.
Figure 2.16 pH titration curve of 1 mol % pH-sensitive PTE-IMTSL lipid incorporated into 100nm LUVs composed of POPC (blue) and POPC 80 mol % : POPG 20 mol% (red). Dashed lines are the best fit to single dissociation model Eq.11.
Table 2.04 Experimental ΔpKael determined from the pH titration and the surface electrostatic potential, Ψ calculated for IMTSL-PTE liposome samples.
Lipids
composition mol %
pKai †pKa0 ‡ΔpKapol ΔpKael Ψexp, mV
⁎ΨGC, mV
AL=0.53Å2
⁑ΨGC, mV
AL=0.70Å2
POPC 3.53
± 0.01 3.33 ±0.03 -0.81 ± 0.03 1.01 ± 0.04 -58 ± 2
0 0
POPC80:POPG20 3.82 ± 0.01
1.30 ± 0.04
-75 ± 2
-83 -71
†pKa0 ‡ΔpKapol values are taken from [94, 99]
Figure 2.17 pH titration curve of 1 mol % pH-sensitive PTE-IKMTSL lipid incorporated into 100nm LUVs composed of POPC (blue) and POPC 80% : POPG 20% (red). Dashed lines are the best fit to single dissociation model Eq.11.
Table 2.05 Experimental ΔpKael determined from the pH titration and the surface electrostatic potential, Ψ calculated for IKMTSL-PTE liposome samples.
Liposome
composition mol
pKai †pKa0 ‡ΔpKapol ΔpKael Ψexp mV
⁎ΨGC, mV
AL=53Å2
⁑ΨGC, mV
AL=70Å2
POPC 5.73
± 0.02 5.98 ± 0.04 -0.58 ± 0.04 0.33 ± 0.06 -19 ±.3
0 0
POPC80:POPG20 6.23 ± 0.02
0.83 ± 0.06
-48 ± 3
-79 -66
†pKa0 ‡ΔpKapol values are taken from [94, 99]
The electrostatic terms, ΔpKael of the vesicles doped with either PTE-IMTSL or PTE-IKMTSL and composed of either 100 mol % POPC or POPC 80 mol % : POPG 20 mol % lipids were readily calculated using the values for pKai , pKa0 and ΔpKapol and Eq. 1. The surface electrostatic potentials, Ψexp were calculated using the value for ΔpKael and Eq. 2, and are summarized in Table 2.04 and Table 2.05
With the same nitroxide spin labeled lipids either PTE-IMTSL or PTE-IKMTSL, vesicles with 20% negatively charged POPG mixture show higher interfacial pKaiand more negative surface electrostatic potentials Ψexp. For spin labeled PTE-IMTSL lipids, the calculated surface electrostatic potential for POPC 80 mol % : POPG 20 mol % is Ψexp = -75 ± 2 mV is lower than that calculated for 100 mol % POPC Ψexp = -58 ± 2 mV by the difference of -17m ± 3 V. Similarly, for spin labeled PTE-IKMTSL lipids, the calculated surface electrostatic potential reported for POPC 80 mol % : POPG 20 mol % Ψexp = -48 ± 3 mV is lower than that for 100 mol % POPC Ψexp = -19 ± 3 mV by the difference of -29 ± 4 mV. This is expected as addition of negatively charged lipids increases surface charge density of the vesicles.
spherical fragments and a phosphate-nitrogen distance of 4.5 Å is obtained from the crystal structure of POPC, the dipole is calculated to be canted with an angle of 22 ± 4° with respect to the bilayer surface [108]. Besides, the positively charged trimethylammonium groups attract negatively charged ions and the negatively charged phosphate moiety attract positively charged ions from the bulk buffer solution, thus establishing a diffuse double layer which provides an electrostatic screening for the protonated nitroxide, the measured interfacial pKai is controlled by interplay of charge-dipole interaction and electrostatic screening. For 20% anionic lipids POPG mixture, extra Coulombic potential between protonated nitroxide and negatively charged phosphate moiety of POPG arises, in addition to charge-dipole potential. Thus the negative electric potential of 20 mol % POPG mixture is greater resulting in lower surface potential. Liposome model with different lipids composition are shown in Figure 2.18
Figure 2.18 Cartoon illustrating POPC 100 mol % liposome doped with spin labeled lipid (left) and POPC 80 mol% : POPG 20 mol % POPG liposome doped with spin labeled lipids (right).
lipids incorporated into MLV DMPG previously reported in our group, The magnitudes of the negative surface electrostatic potentials, Ψ, for MLV DMPG doped with PTE-IKMTSL Ψ(17 °C) = −128 ± 3 mV, Ψ(48 °C) = −120 ± 3 mV) were found to be measurably lower than those obtained from the EPR titrations of the PTE-IMTSL Ψ(17 °C) = −183 ± 5 mV, Ψ(48 °C) = −161 ± 3 mV) [99].
Figure 2.19 Compared to IMTSL (left), IKMTSL has longer linker and more “stiff” structure.
For 100 nm POPC LUVs, the pKai values reported by PTE-IMTSL and the magnitude of the calculated corresponding surface electrostatic potentials Ψ were found to be the same within error range compared to POPC MLVs reported previously [98]. The calculated surface electrostatic potential reported for 100 mol % POPC LUVs Ψexp = -58 ± 2 mV, for MLVs POPC Ψexp = -56 ± 3 mV. However, for 100nm POPC 80 mol % : POPG 20 mol % LUVs, the
MLVs is Ψexp = -107 ± 3 mV. This could be related to the difference in electrolyte concentration difference, LUVs samples has electrolyte concentration of 75mM and MLVs has electrolyte concentration of 50mM. Addition of electrolyte (NaCl) to LUVs results in a strong electrostatic screening effect for negatively charged lipid bilayer, this is supported by a set of experiments for DMPG MLVs doped with PTE-IMTSL conducted in our group, it was found that experimentally observed pKai had a gradual decrease and determined Ψexp changes lineally with the salt concentration from 50mM to 150mM [98]. In addition it was found that under same electrolyte concentration, experiments for 100 nm DMPG ULVs, the pKai values reported by IKMTSL-PTE were slightly higher than those for MLVs. The calculated surface electrostatic potential reported for 100 mol % DMPG LUVs Ψexp = -142 ± 3 mV, for MLVs Ψexp = -120 ± 3 mV at 48°C. It was suggested that such result is related to a somewhat higher
average packing density of lipids in the ULVs of ca. 100 nm diameter versus that in MLVs that are composed of many lamellae spanning a rather broad range of local curvature [99].
𝛹𝐺𝐶 =
2𝑘𝑇
𝑒 asinh(
𝜆𝐷𝑒𝜎
2𝜀0𝜀𝑘𝑇
) 𝐸𝑞. 12
where σ is the lipid surface charge density, λD is the Debye screening length, ε0 is the permittivity of vacuum, and ε is the dielectric constant of the medium.
The Debye screening length is given by
𝜆𝐷 = √ 𝜀0𝜀𝑘𝑇
2000𝑒2𝑁
𝐴𝐶𝑒𝑙
𝐸𝑞. 13
where NA is Avogadro’s number and Cel is the bulk molar electrolyte concentration. The surface charge density was estimated as
𝜎 = 𝑒𝛼
𝐴𝐿 𝐸𝑞. 14
where AL is the surface area per ionizable group of a lipid and α is the degree of dissociation of the phosphatidyl group.
PTE-IMTSL, using ε = 59 for interfacial location, the GC theory predicts the surface potential value of ΨGC = -83 mV using minimum AL = 0.53 nm2 and ΨGC = -71 mV using maximum AL = 0.70 nm2. This range -71 mV to -83 mV agrees well with the experimentally observed Ψexp = -75 ± 2 mV. For PTE-IKMTSL, using ε = 65 for interfacial location of the reporter nitroxide the GC theory predicts the surface potential value of ΨGC = -79 mV using minimum AL = 0.53 nm2 and ΨGC = -66 mV using maximum AL = 0.70 nm2. The surface electrostatic potential measured in this work by IKMTSL-PTE (Ψexp = −48 ± 3 mV) deviates by ≈30% from the ΨGC range
calculated -66 mV to -79 mV. Again this is because the nitroxide of IKMTSL-PTE reports on
a local electrostatic potential within a plane that is further away from the bilayer surface and where the electrical charges of lipids bilayer are better screened by counter ions. The GC theory underestimates considerably the bilayer surface potential for purely POPC lipid since it
assumes the POPC surface charge is electrically neutral. Our work reaffirm that POPC bilayer
has a large permanent electric dipole formed by the choline (net charge +e) and phosphate (net
charge –e) groups, and Triton X-100 micelles but not zwitterionic lipids should be employ as
a neutral reference interface in measurement of bilayer surface potentials.
POPC bilayer surface charge density, σ, was estimated from experimental surface potentials
using the GC theory. If we accept a monovalent electrolyte as an approximation of our
experimental conditions, then σ is given by
σ = sinh (𝑒𝛹𝑒𝑥𝑝
For Cel = 0.075 M, ε = 59 for interfacial location of the reporter nitroxide PTE-IMTSL
incorporated into Triton X-100 micelles, and Ψexp= −58 mV for 100 mol % POPC liposome,
the calculated surface charge density is σexp = −0.039 C/m2. Similarly, Ψexp= −75 mV for 80
mol % POPC : 20 mol % POPG liposome, the calculated surface charge density is σexp = −0.058
C/m2, agrees with the range σ = −0.061C/m2 to −0.046C/m2 predicted by the GC theory from different areas per polar head group.
2.3.5 Choice of silica support.
Silica beads supported lipid bilayer can be formed in the range of sizes from ∼50 nm to ∼80 μm. In chapter one we have discussed the effect of support particle size and curvature on formation of supported lipid bilayer and reported that liposome fusion on larger particle occurs much easier. In this project we utilized non-porous silica beads with diameter greater than 100nm because they form stable supported lipid bilayer. In addition, for silica beads with sizes higher that 100nm, the curvature effects on physical properties, especially on surface charge density, are negligible. Although silica beads density (1.96 g/cm3) allows for easy separation of beads from solution by centrifugation, this technique is difficult to use with beads smaller than 300nm in diameter because the speeds required to separate small beads is very high, and the resulting pellet is very dense and hard to re-suspend. Taking in account the above considerations, we selected silica beads with 300 nm diameter for our experiments.
2.3.6 Determination of the zeta potential of bare silica beads and silica supported bilayer The magnitude of the zeta potential gives an indication of the potential stability of the colloidal system. If all the particles in suspension have a large negative or positive zeta potential then they will tend to repel each other, if the particles have low zeta potential values then there is no force to prevent the particles coming together and coagulation.
At pH=7.4, the zeta potential of silica beads suspension was measured to be -23.6mV (a previous study for 50nm silica beads zeta potential = -20mV at pH=7.4 [119]), and zeta potential of silica supported lipid bilayer suspension was measured to be -7.3mM. This indicates that lipid bilayer wrapping around silica beads partially screens the surface charge of the silica. Besides, POPC molecule is a zwitterion, its positive charge belonging to the ammonium group and negative charge belonging to the phosphate group are favorable for electrostatic interaction with negatively charged silica surface and causes decrease in the negative value of the silica particle zeta potential. Silica beads zeta potential titration is shown in Figure 2.20, the isoelectric point pHiso ≈ 3.2 where the net surface charge is zero can be determined from this plot.
2.3.7 Effect of silica support on lipid bilayer electrostatics. Determination of ΔpKasilica.
For both PTE-IMTSL and PTE-IKMTSL, spin labeled lipids were incorporated into (A) zwitterionic lipid POPC and (B) mixed 80 mol % POPC with 20 mol % anionic lipid POPG and then SUVs were coated on non-porous silica beads surface. Representative spectra (normalized by intensity) for each silica supported lipid bilayer samples are shown in Figures 2.21-2.22.
Figure 2.21 Representative intensity normalized CW X-band EPR spectra from pH titration experiments of silica supported samples doped with 1 mol % pH-sensitive PTE-IMTSL lipid incorporated into lipid vesicles composed of POPC (left) and POPC 80% : POPG 20% (right).
![Figure 1.05 Schematic profile of the electrostatic potential across typical lipid bilayer and its decomposition into three major components adapted from [3]](https://thumb-us.123doks.com/thumbv2/123dok_us/1383357.1170999/21.612.106.521.182.429/figure-schematic-profile-electrostatic-potential-typical-decomposition-components.webp)