University of Windsor University of Windsor
Scholarship at UWindsor
Scholarship at UWindsor
Electronic Theses and Dissertations Theses, Dissertations, and Major Papers
2014
Developing molecular tools to assess the biogeochemical/
Developing molecular tools to assess the biogeochemical/
microbial community structure of oil sand processed waste
microbial community structure of oil sand processed waste
material
material
Sabari Prakasan Mullapulli Raveendran University of Windsor
Follow this and additional works at: https://scholar.uwindsor.ca/etd
Part of the Earth Sciences Commons, and the Environmental Sciences Commons
Recommended Citation Recommended Citation
Mullapulli Raveendran, Sabari Prakasan, "Developing molecular tools to assess the biogeochemical/ microbial community structure of oil sand processed waste material" (2014). Electronic Theses and Dissertations. 5060.
https://scholar.uwindsor.ca/etd/5060
This online database contains the full-text of PhD dissertations and Masters’ theses of University of Windsor students from 1954 forward. These documents are made available for personal study and research purposes only, in accordance with the Canadian Copyright Act and the Creative Commons license—CC BY-NC-ND (Attribution, Non-Commercial, No Derivative Works). Under this license, works must always be attributed to the copyright holder (original author), cannot be used for any commercial purposes, and may not be altered. Any other use would require the permission of the copyright holder. Students may inquire about withdrawing their dissertation and/or thesis from this database. For additional inquiries, please contact the repository administrator via email
Developing molecular tools to assess the biogeochemical/microbial
community structure of oil sand processed waste material
By
Sabari Prakasan Mullapulli Raveendran
A Thesis
Submitted to the Faculty of Graduate Studies
through the Department of Earth and Environmental Sciences
in Partial Fulfillment of the Requirements for
the Degree of Master of Science
at the University of Windsor
Windsor, Ontario, Canada
2013
Developing molecular tools to assess the biogeochemical/microbial
community structure of oil sand processed waste material
By
Sabari Prakasan Mullapulli Raveendran
APPROVED BY:
R. Seth
Civil and Environmental Engineering
I. Samson
Earth and Environmental Sciences
C. G. Weisener, Advisor
Earth and Environmental Sciences
iii
DECLARATION OF CO-AUTHORSHIP AND PREVIOUS PUBLICATION
I. Co-authorship Declaration
I hereby declare that this thesis incorporates material that is the result of joint research, as
follows:
This thesis incorporates research undertaken in collaboration with N. Loick under the
supervision of C. Weisener. This collaboration is covered in Chapters 2 and 3 of this thesis. In
all cases, the key ideas, primary contributions, experimental designs, data analysis and
interpretation, were performed by the author, and the contribution of the co-authors was
primarily through the assistance in lab work and comments on the manuscript.
I am aware of the University of Windsor Senate Policy on Authorship and I certify that I
have properly acknowledged the contribution of other researchers to my thesis, and have
obtained written permission from each of the co-author (s) to include the above material(s) in my
thesis.
I certify that, with the above qualification, this thesis, and the research to which it refers,
iv II. Declaration of Previous Publication
This thesis includes 1 original paper that will be submitted for publication in peer reviewed
journals, as follows:
Thesis Chapter Publication title/full citation Publication status*
Chapter 2 Assessment of RNA preservation methods to
study active microbial population in oil sands
tailings ponds
In preparation
I certify that I have obtained a written permission from the copyright owner(s) to include
the above published material(s) in my thesis. I certify that the above material describes the work
completed during my registration as a graduate student at the University of Windsor.
I declare that, to the best of my knowledge, my thesis does not infringe upon anyone’s
copyright nor violate any proprietary rights and that any ideas, techniques, quotations, or any
other material from the work of other people included in my thesis, published or otherwise, are
fully acknowledged in accordance with the standard referencing practices. Furthermore, to the
extent that I have included copyrighted material that surpasses the bounds of fair dealing within
the meaning of the Canada Copyright Act, I certify that I have obtained a written permission
from the copyright owner(s) to include such material(s) in my thesis.
I declare that this is a true copy of my thesis, including any final revisions, as approved
by my thesis committee and the Graduate Studies office, and that this thesis has not been
v
ABSTRACT
Microbial communities can dominate Fluid Fine Tailings (FFT) in the presence of
electron acceptors (e.g. Sulfate). Sulfate reduction can produce hydrogen sulfide, one of several
chemical constituents responsible for sediment oxygen demand (SOD). The preservation of RNA
is a crucial step to study active microbial populations and their activity in FFT and hence
understand the biological factors contributing to SOD. In our study different RNA preservation
methods were tested to preserve microbial RNA in FFT sample. The results confirmed that
LifeGuard™ Soil Preservation Solution (MO BIO Laboratories, Inc, California) is the best
preservative method for RNA preservation. Through T-RFLP analysis of 16s rRNA and 16s
rDNA, SRB’s (Sulfate Reducing Bacteria) are shown to dominate the FFT during initial stages
of incubation but its population decreased significantly over-time. This observation suggests that
sulfate reduction is a self-limiting process and has less impact on the quality of overlying water
vi
ACKNOWLEDGEMENTS
Firstly, I would like to thank my advisors Dr. Chris Weisener for constant support, expert
advice and guidance. I would also like to thank my committee members, Dr. Rajesh Seth and
Dr. Iain Samson, for their encouragement and support. I would also like to specially thank Dr.
Nadine Loick for her advice and support during my Lab work. I also like to thank Dr. Subbarao
Changati for his help during T-RFLP analysis. I would also like to thank Mrs. Sharon Horne for
her advice in completing all the necessary requirements for the master’s program. I also thank
my lab mates Michael Chen, Rachel E. Franzblau, Ryan Boudens, Tom Reid, Danielle
VanMensel, Nick Falk and Zach Diloreto for their assistance and constant reinforcement. Lastly,
I thank my family and friends for always supporting me throughout my life.
I would like to thank the community council members of the End-Pit Lakes Modelling
Task Group (EPLMTG) including Alberta Environment, Cumulative Environmental
Management Association (CEMA) of Wood Buffalo Municipal Region, Fort McKay Industry
Relations Corporation (IRC), Suncor Energy, Inc., Syncrude Canada Ltd. I would also like to
thank Christine Daly (Suncor), Tara Penner (Syncrude), and industry partners and
representatives for their help. This research was funded by grants from CEMA-NSERC
vii
TABLE OF CONTENTS
DECLARATION OF CO-AUTHORSHIP AND PREVIOUS PUBLICATION ... iii
ABSTRACT ... v
ACKNOWLEDGEMENTS ... vi
LIST OF TABLES ... ix
LIST OF FIGURES ... x
LIST OF ABBREVIATIONS ... xi
Chapter 1- Introduction ... 1
1.1 Alberta oil sands ... 1
1.2 Oil sands tailings and reclamation ... 1
1.3 Wetlands ecosystem and sediment oxygen demand ... 2
1.4 Role of microorganisms in wetlands ... 3
1.5 Study of active microbial population ... 3
1.6 Terminal Restriction Fragment Length Polymorphism (T-RFLP) ... 5
1.7 Laboratory microcosm studies ... 5
CHAPTER 2 - Assessment of RNA preservation methods to study active microbial population in oil sands tailings ponds ... 12
2.1 Introduction ... 12
2.2 Materials and Methods ... 13
2.2.1 Sample collection and Preservation ... 13
2.2.2 RNA extraction, DNA digestion and cDNA synthesis ... 14
2.2.3 PMA treatment and DNA extraction ... 14
2.2.4 PCR and TRFLP ... 15
2.2.5 Statistical analysis of TRFLP data ... 16
2.2.6 Species Identification ... 17
2.3 Results and Discussion ... 18
2.3.1 Statistical analysis to determine the best RNA preservative solution ... 18
2.3.2 Comparison of DNA, PMA-DNA and RNA ... 23
2.3.3 Species Identification ... 25
viii
Chapter 3 - Evaluation of Microbial community structure in FFT using T-RFLP ... 30
3.1 Introduction ... 30
3.2 Materials and Methods ... 31
3.2.1 Sample collection ... 31
3.2.2 Experimental Design ... 32
3.2.3 Microcosm sample collection... 32
3.2.4 PMA treatment and DNA extraction ... 32
3.2.5 PCR and TRFLP ... 35
3.2.6 Statistical analysis of TRFLP data ... 35
3.2.7 Species Identification ... 37
3.3Results and discussion ... 37
3.3.1 Statistical analysis to understand the temporal and spatial changes of Bacterial community structure ... 37
3.3.2 Species Identification ... 44
3.4 Conclusions ... 54
CHAPTER 4 - Summary and Future Work ... 55
4.1 Summary ... 55
4.2 Future Work ... 57
REFERENCES ... 60
ix
LIST OF TABLES
Table 2.1: Diversity index of RNA samples ... 23
Table 2.2: Comparison of DNA, PMA-DNA and RNA based on their Total TRF ... 26
Table 2.3: Comparison of untreated DNA and PMA-DNA depicting their unique and shared TRF 26 Table 2.4: Comparison of Control RNA and DNA depicting their unique and shared TRF ... 26
Table 2.5: Comparison of Control RNA and PMA-DNA based on bacterial species ... 27
Table 3.1: Diversity Indexof FFT samples based on relative abundance (peak area) of Bacterial 16s rDNA (PMA-DNA) ... 42
Table 3.2: Comparing bacterial species present in the upper layer of the oxic microcosm ... 46
Table 3.3: Comparing bacterial species on lower layer of the oxic microcosm ... 48
Table 3.4: Comparing bacterial species present in the upper layer of the anoxic microcosm ... 50
x
LIST OF FIGURES
Figure 1.1: Alberta oil sands deposits. Map taken from Alberta energy (www.energy.alberta.ca) .... 7
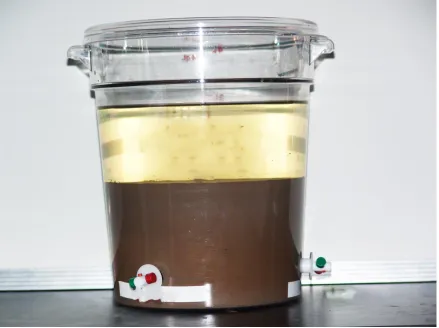
Figure 1.2: Oil Sands Processed Material ... 8
Figure 1.3: Conceptual diagram – oil sands tailings ponds ... 8
Figure 1.4: Conceptual diagram to depict the role of SRB and Methanogens for Chemical Sediment Oxygen Demand (CSOD) in wetlands... 9
Figure 1.5: Flow Chart to compare DNA, PMA-DNA and RNA based on their role in microbial ecology ... 9
Figure 1.6: Laboratory microcosm ... 10
Figure 2.1: Flow chart describing the experimental design to compare DNA and RNA ... 15
Figure 2.2: PCA based on Presence/Absence data of Bacterial 16s rRNA and 16s rDNA ... 21
Figure 2.3: Cluster analysis - Jaccard’s similarity based on Presence/Absence data of Bacterial 16s rRNA and 16s rDNA ... 22
Figure 3.1: Satellite image showing the location of STP and WIP ... 33
Figure 3.2: Conceptual diagram depicting different work involved in characterization of FFT ... 34
Figure 3.3: Experimental Design ... 34
Figure 3.4: PCA of FFT samples based on Presence/Absence data of Bacterial 16s rDNA (PMA-DNA)... 40
Figure 3.5: Cluster analysis of FFT samples - Jaccard’s similarity based on Presence/Absence data of Bacterial 16s rDNA (PMA-DNA) ... 41
xi
LIST OF ABBREVIATIONS
DNA - Deoxyribonucleic acid
RNA - Ribonucleic acid
rRNA - Ribosomal ribonucleic acid
mRNA - Messenger ribonucleic acid
T-RFLP - Terminal Restriction Fragment Length Polymorphism
TRF - Terminal Restriction Fragment
SOD - Sediment oxygen demand
DO – Dissolved Oxygen
FFT – Fluid Fine Tailings
SRB - Sulfate-reducing bacteria
PAT - Phylogenetic Assignment Tool
PCA - Principal Component Analysis
1
Chapter 1- Introduction
1.1 Alberta oil sands
Oil sands deposits have been discovered around the world and include Canada,
Kazakhstan and Russia. Northern Alberta, Canada has the largest deposit of approximately 2.5
trillion barrels of recoverable bitumen held in a mineral matrix of sand, clay and water (Fig 1.1)
(Penner and Foght. 2010). Currently nearly 1.31 million barrels of bitumen are extracted every
day and this is expected to increase to roughly 3 million barrels per day by 2018 (Alberta energy.
2013). Based on the location of oil sands, two different methods are used in bitumen recovery. If
the deposit is shallow the surface mining method is used. In case of deeper deposits, in situ
recovery methods like cyclic steam stimulator and steam assisted gravity drainage are used (Li.
2010). At present, open pit surface mining is the method widely employed for oil sands
extraction. After mining the bitumen is separated out of oil sands by the Clark hot water
extraction process. In this process, crushed oil sands are treated with Caustic hot water (50 –
80ºC) to reduce the viscosity of bitumen and the flotation technique is used to recover bitumen in
the form of bitumen froth (Chalaturnyk et al. 2002). The sands separated during this process are
utilized in the construction of tailings ponds.
1.2 Oil sands tailings and reclamation
The processing of oil sands to produce synthetic crude oil generates a large volume of
tailings (Fig 1.2). The tailings are mainly composed of water, sand, fines (clay <44µm), residual
bitumen (0.5%-5% mass) and naphtha (<0.5%) (Chalaturnyk et al. 2002). In order to produce
one barrel of bitumen about 1 m3 of oil sands and 3 m3 of water are used. This process results in
4 m3 of tailings per barrel of extracted bitumen (Holowenko et al. 2000). On average about
262,000 m3 of tailings are produced per day. The oil sands companies operate under a zero
discharge policy; therefore the tailings are stored on site and are kept in settling basins generally
2
The tailing ponds contain approximately 840 million m3 of fine tailings that cover
roughly 170 km2 of oil sands region (Siddique et al. 2011). As the tailings are allowed to settle in
tailings ponds, the sand particles settle quickly to the bottom to form a base. The remaining
tailings take years to densify forming thick slurry called Fluid Fine Tailings (FFT) (Penner and
Foght. 2010). As a measure to reduce the size of the tailings ponds and to reduce the fresh water
usage, the overlaying water released from the tailings ponds are reused for oil sands processing.
The FFT after 10-15 years of densification will be transferred into the mined-out pits. These
mined-out pits will be capped with a large amount of fresh water to form end-pit lakes (EPL)
(Zubot. 2010). These lakes will be organized in such a way to support all life forms. This process
is called “Wet landscape approach” one of the proposed reclamation methods for oil sands
tailings.
1.3 Wetlands ecosystem and sediment oxygen demand
Wetlands are well known to provide habitat for many plants and animals creating an
important site for cycling of key nutrients like carbon, nitrogen, sulfur and phosphorus (Batzer
and Sharitz. 2006). Dissolved oxygen, being a vital component for many of the organisms, will
decide the functioning of wetlands (Dauer et al. 1992). The biogeochemical processes taking
place at the water-sediment interface leads to the consumption of dissolved oxygen causing
Sediment Oxygen Demand (SOD) (Murphy and Hicks. 1986). SOD is the major contributor to
oxygen depletion in water bodies and it is affected by factors like temperature, chemical
component and dissolved oxygen content. SOD is composed of two major components, the
biological sediment oxygen demand (BOD) and chemical sediment oxygen demand (COD)
(Wang and Paula. 1984). In all wetlands the composition of sediment plays a key role in its
functionality. Therefore the study of sediment is crucial to conserve the wetlands. In case of oil
sands tailings ponds, during reclamation the wetlands will be developed on top of FFT.
Therefore the study on biogeochemical process in FFT is crucial for the success of the wetland
3
1.4 Role of microorganisms in wetlands
Microorganisms are the driving force of biogeochemical processes in wetlands, the study
of microbial communities are essential for the success of a wetland ecosystem. The FFT material
is complex in nature and has the ability to support a wide range of biochemical process which
have a direct impact on the life forms inhabiting the overlying water column. This study will
focus on the biochemical processes in FFT and their role on sediment oxygen demand in the
overlying water column. In the aerobic zone (presence of oxygen) microorganisms dwelling in
the water-sediment interface will consume oxygen by degrading organic compounds leading to
the BOD. The FFT is an organic rich and viscous material; anaerobic reactions will be the most
prevalent processes in FFT. The oxygen diffusion to the FFT is limited because of overlaying
water columns and the existing dissolved oxygen is also quickly utilized by microbes during
hydrocarbon degradation. Iron reduction, sulfate reduction and methanogenesis are some of the
major processes under anaerobic conditions. The anaerobic microorganisms produce reduced
chemical species like hydrogen sulfide and methane (Fig 1.4). Reduced chemical substances in
the sediments reaching the overlying water column will get re-oxidized leading to COD (Gelda
et al. 1995). This study focuses on sulfate reduction, which is one of the major anaerobic
processes as the hydrogen sulfide produced during this process is a potent reducing agent and is
toxic to aquatic organisms (Smith and Oseid. 1971). Hydrogen sulfide has the ability to form
metal sulfides especially iron sulfide (Schoonen, 2004). With iron being an essential nutrient for
microorganisms (Church et al 2000), the iron sulfide formation may affect the growth of other
useful microorganisms. The predominant presence of SRB’s and methanogens in tailings ponds
has been reported in previous studies (Holowenko et al. 2000, Siddique et al. 2006,
Ramos-Padrón E et al., 2011). However, long-term assessment of SRB activity is still lacking and is
crucial for the success of reclamation of tailings ponds.
1.5 Study of active microbial population
Several studies have reported the role of microorganisms in tailings ponds. Most of these
studies were performed using DNA (Chi Fru et al., 2013, Penner and Foght. 2010, Holowenko et
4
macromolecule, is known to persist in soil for a long time. DNA isolated from the soil samples
will be comprised of extracellular DNA and intracellular DNA from live and dead cells. As a
result, DNA analysis may lead to overestimation of microbial populations (Josephson et al. 1993,
Masters et al. 1994). Propidium Monoazide (PMA), a DNA-binding dye has been reported to
solve this problem (Nocker et al., 2006, 2007). PMA has the ability to bind to double-stranded
DNA and block its amplification during PCR amplification by forming a stable covalent
nitrogen-carbon bond. Upon photo activation, the azide group of the dye is converted into a
nitrene radical reacting with any hydrocarbon moiety in the binding site, leading to a permanent
modification of the DNA. The peculiarity of the dye is its ability to penetrate only the cell
membrane of dead cells. Therefore on treating samples with PMA only the DNA from live cells
will get amplified during PCR (Taskin et al. 2011).
Even though PMA treated DNA (PMA-DNA) can provide information about the live
microbial community, it is not able to differentiate between active and dormant microorganisms
(Nocker et al. 2007). Therefore to track the active microbial population RNA can be utilized.
RNA is a highly unstable macromolecule (Deutscher 2006) and is produced mostly while the
cells are active (Fig 1.5). There are two different types of RNA widely used in the field of
microbial ecology, these are rRNA and mRNA. The 16s rRNA is the central component in
protein synthesis, widely used to track the active microbial community structure because of its
unique properties; such as universal distribution, high conservation, considerable variability and
minimal lateral gene transfer. The mRNA is related to gene expression and protein synthesis and
can be used to study microbial activity in order to understand chemical processes like sulfate
reduction (Strattan. 2010; Farrell. 2011). Even though the RNA analysis is an effective method
to study the active microbial population, the unstable nature of RNA leads to significant losses
during sample collection. This is true especially in case of complex environmental samples like
FFT where the presence of humic acid and other components may have an impact on RNA
quality. Therefore, developing a microbial soil RNA preservation method compatible with the
FFT is crucial to understand the microbial structure and activity. In this study, four different
preservation methods were tested using T-RFLP analysis (details of the methods in chapter2) in
order to find the best preservation method for FFT. The compatible RNA preservation method
5
essential to prevent the degradation of RNA during sample shipping. The RNA analysis of
preserved FFT samples can provide uncompromised information about the microbial community
structure and activity in tailings ponds during the time of sample collection. The information on
microbial population is vital for pond management and for the development of reclamation
methods.
1.6 Terminal Restriction Fragment Length Polymorphism (T-RFLP)
T-RFLP is a PCR-based tool widely used to monitor changes in the structure and
composition of microbial communities (Clement et al. 1998, Liu et al. 1997, Dunbar et al. 2000,
Wu et al. 2006, Ramakrishnan et al. 2000). During T-RFLP analysis the target gene will be
amplified by PCR, wherein one or both the primers will be labelled with a fluorescent dye. These
PCR amplicons will be subjected to restriction digestion using one or more restriction enzymes
(Four base pair recognition sites). As different species will have different 16s rRNA gene
sequences, the length of the TRF (Terminal Restriction Fragment) generated after restriction
digestion can be directly related to a particular species. The size and relative abundance of the
TRFs are determined using an automated DNA sequencer (Schütte et al. 2008). The T-RFLP
data can be employed for two purposes, first to determine changes in microbial community
structure through statistical analysis and second to perform species identification through
web-based tools like Phylogenetic Assignment Tool (PAT) (Kent et al., 2003). Even though the
T-RFLP faces the problems associated with any PCR-based method such as formation of
chimerical and heteroduplex molecules (Acinas et al. 2005, Becker et al. 2000), the simplicity of
the method makes it the most preferred method in microbial ecology.
1.7 Laboratory microcosm studies
Laboratory microcosms are widely used to simulate the behavior of natural ecosystems
under controlled conditions (Fig 1.6). The microcosms are easy to handle and the sample
collection from microcosms can be performed at regular intervals making it an ideal choice for
long-term assessments (Jessup et al, 2004). In case of oil sands tailings ponds, the field studies
6
requirements. Therefore the long-term analysis performed using microcosms can be used to
understand microbial community structure of tailings ponds.
A study conducted by Chi Fru et al. 2013 proved that the microbial community structure
stimulated through microcosm/bioreactor studies is similar to field samples. In the study the
T-RFLP analysis of 16s rDNA was performed to study bacterial and archaeal community structure
in FFT and their change over time. Through the analysis it was found that the FFT was initially
dominated by bacterial population and later by archaeal population. This similar pattern was
observed in field studies, where the development of sulfide rich zones at the sediment - water
interface proved the dominance of bacterial population especially SRB. After the decline in SRB
population, the emergences of methanogens were detected through methane bubbling and MPN
7
8 Figure 1.2: Oil Sands Processed Material
Figure 1.3: Conceptual diagram – Oil sands tailings ponds (FFT-Fluid Fine Tailings, OSPW –
9
Figure 1.4: Conceptual diagram to depict the use of SRB and Methanogens for Chemical Sediment Oxygen Demand (CSOD) in wetlands
11
1.8 Hypothesis and objectives:
The LifeGuard™ Soil Preservation Solution (MO BIO Laboratories, Inc, California) has
been specifically designed for RNA preservation in soil samples, but it is unknown whether this
off the counter product can be used to preserve RNA in active oil sands process materials
(OSPM). In this study (Chapter 2) it is hypothesized that LifeGuard™ will preserve the
expressed RNA more efficiently than other methods like RNAlater method, Glycerol method and
flash freezing. The LifeGuard™ soil preservation solution is more efficient because of its
biostatic activity and ability to inactivate RNase in soil. Therefore it is expected to be effective in
both long-term and short-term storage of soil microbial RNA compared to the other methods
which lack one or both properties. If this hypothesis holds true, the bacterial community structure
of both control and LifeGuard treated samples should be similar. They should establish a closer
relationship with each other during the statistical analysis. The RNA extraction in control
samples are performed immediately after sample collection, thus the RNA degradation will be
negligible, therefore the control sample can reflect the actual bacterial community structure of
FFT. To test the suitability and effectiveness of LifeGuard™ Soil Preservation Solution (MO
BIO Laboratories, Inc, California) RNA will be extracted from differently preserved tailings
samples and T-RFLP analysis of 16s rRNA/cDNA will be performed to compare the bacterial
community structure. Once the RNA protocol has been tested and optimized it will be validated
using laboratory microcosm.
In Chapter 3, the statistical analysis of the TRFLP data for bacterial 16s rDNA
(PMA-DNA) will be performed to determine the similarity/difference between the FFT samples
collected at different depth and different atmospheric conditions. It is hypothesized that the
population of sulfate reducing bacteria will dominate and then decrease as the system matures in
part due to the decrease in sulfate concentration and hydrogen sulfide production, which is toxic
to bacteria. If this hypothesis holds true, the statistical analysis of T-RFLP data is expected show
a higher bacterial population and the species identification should show different SRB species
during the initial stages of development. As the system matures, less or no SRB species should
be detected in FFT. To test this hypothesis, species identification will be performed using PAT in
order to get a general idea about the bacterial population present in the FFT and to track the
12
CHAPTER 2 - Assessment of RNA preservation methods to study active microbial
population in oil sands tailings ponds
2.1 Introduction
The aim of the project being the long-term assessment of microbial populations, the
utilization of RNA is crucial to track only the active microbial population and not dead cells.
Even though the RNA has a major role in microbial ecology, unlike DNA, the RNA is highly
unstable which poses a major problem of RNA degradation within a few minutes to hours of cell
death. Therefore developing a preservation method is indispensable for any further RNA analysis
to be meaningful. Flash freezing is the most widely used RNA preservative method. Even though
flash freezing has been successfully applied for soil RNA preservation (Rissanen et al. 2010,
Wallenius et al. 2010) liquid nitrogen is not always accessible, especially in the case of oil sands
tailings a lot of restrictions apply because of on-site health and safety issues. Therefore finding
an alternative method is crucial for soil RNA preservation.
In this study four different preservation methods are investigated.
1. LifeGuard™ Soil Preservation Solution
2. RNAlater® solution
3. Glycerol
4. Liquid Nitrogen
The LifeGuard™ Soil Preservation Solution is supplied by MO BIO Laboratories, Inc, California
and specially formulated for soil samples. The RNAlater® solution is supplied by Life
Technologies Corporation and is formulated for tissue samples but has been widely used in
studies for soil RNA preservation (Foti et al., 2008). The manufacturer gives an indefinite
storage time for RNA in this solution, which is important for long-term projects. Glycerol is
selected in this study because it is a very cost effective and commonly used chemical in the
laboratory and has been proven to be effective in the preservation of microorganisms and soil
samples (Sessitsch et al. 2002) but its impact on complex environmental samples like tailings
13
including mineral soil, compost, sediments. This method can be used along with a control to
validate other methods.
In this study T-RFLP of 16s rRNA/cDNA was used to compare the microbial community
profiles detected with the different preservation methods. Different statistical methods were used
to compare the community profiles with the objective to detect the preservation method with
higher similarity to the control sample. The method with the highest similarity will be declared
the best soil RNA preservation method. The comparison between RNA, DNA and PMA-DNA
were also performed based on T-RFLP data to determine their role in microbial ecology.
2.2 Materials and Methods
2.2.1 Sample collection and Preservation
The samples used in this experiment were oil sands tailings. The samples were collected
from a microcosm (details in chapter 3 methods), which was maintained to perform other
laboratory studies. The microcosm was 20 weeks old during the time of sample collection.
Immediately after sample collection, approximately 3 g of samples was transferred to 50 ml
sterile centrifuge tubes and was treated with different preservative solutions (Fig 2.1). In case of
control sample immediately after sample collection the RNA extraction was performed.
The following preservation method was applied
i. Lifeguard method: In case of Lifeguard preservative method about 9 ml of
LifeGuard™ Soil Preservation Solution (MO BIO Laboratories, Inc, California) was added to 3 g of samples and mixed thoroughly according to manufacturer’s
instruction. The samples were stored in -80°C for a period of 3 & 30 days until the
extraction of RNA.
ii. RNAlater® method: About 15 ml of RNAlater® solution (Life Technologies
Corporation) was added to 3 g of samples and mixed thoroughly according to
manufacturer’s instruction. The samples were stored overnight at 4°C and then stored
14
iii. Glycerol Method: About 9 ml of glycerol (15% glycerol, 0.85% NaCl) was added to 3
g of samples and mixed thoroughly (Sessitsch et al. 2002). The samples were stored
in -80°C for a period of 3 & 30 days until the extraction of RNA.
iv. Liquid Nitrogen: The samples were frozen immediately using liquid nitrogen and
were stored in -80°C for a period of 3 & 30 days until the extraction of RNA.
2.2.2 RNA extraction, DNA digestion and cDNA synthesis
After 3 and 30 days (Short-term and Long-term) of incubation the RNA extraction was
performed using RNA PowerSoil® Total RNA Isolation Kit (MO BIO Laboratories, Inc,
California) following manufacturer’s instructions. The extracted RNA was stored at -80°C. After
RNA extraction, the RNA capture columns were used to co-elute DNA using PowerSoil® DNA
Elution Accessory Kit (MO BIO Laboratories, Inc, California). The extracted EDNA (Eluted
DNA) was stored at -20°C. The extractions were performed in triplicate and were pooled
together before performing further experiments. In case of RNA, in order to perform DNA
digestion 12.5 µl of RNA sample was added with 1 µl of DNase enzyme and 1.5 µl DNase buffer
(Ambion Inc.) and digestion was performed according to manufacturer’s instruction. For the
digested sample about 10 µl of the sample was used for CDNA synthesis. The cDNA synthesis
was performed using High Capacity cDNA Reverse Transcription Kit (Applied Biosystems®)
according to manufacturer’s instruction.
2.2.3 PMA treatment and DNA extraction
PMA™ (Propidium Monoazide) dye, 20 mM in H2O (Biotium, Inc) was used in the
experiment. Immediately after sample collection, 0.25 g of the samples was treated with 100 µM
of PMA and mixed thoroughly. The samples were incubated in the dark for 5 minutes at room
temperature. After incubation the sample tubes were placed on the ice and were exposed to light
for 5 minutes using 600 w halogen light source. Immediately after PMA treatment the DNA
extractions were performed using PowerSoil® DNA Isolation Kit (Mo Bio, Laboratories Inc,
California) following manufacturer’s instructions. In case of PMA untreated sample the samples
15
Isolation Kit (Mo Bio, Laboratories Inc, California) following manufacturer’s instructions. The
extracted DNA was stored at -20°C (Fig 2.1). The extractions were performed in triplicate and
were pooled together before performing further experiments.
Figure 2.1: Flow chart describing the experimental design to compare DNA and RNA
2.2.4 PCR and TRFLP
The PCR of cDNA and DNA samples were performed using bacterial primers. The
microbial 16S rRNA gene primer sets, bacterial forward, 8F: 5′-
AGAGTTTGATCCTGGCTCAG-3′, bacterial reverse, 926r:
5′-CCGTCAATTCCTTTRAGTTT-3′ (Liu et al. 1997) were employed. The forward - primer was
6-5-Carboxyfluorescein 5-FAM labelled and synthesized together with the reverse primers by
Applied Biosystems®. PCR reactions contain 3 µl of cDNA template, 1 µl of each primers and
15 μl of Hot Star Plus master mix solution (Qiagen, Toronto, Canada). PCR conditions were as
16
gel, stained with Gel red and cleaned with the QIAquick PCR purification kit (Qiagen, Canada),
following the manufacturer's instructions.
About 25 µl of the purified PCR product was digested with a fast digest protocol supplied
with the DNA restriction enzymes, Hae III, Hha I and Msp I (Fermentas, Burlington, Canada), in
separate reactions. From these, 2 μl was added to 9 μl of a solution made by adding 890 μl Hidi-formamide (Applied Biosystems, California USA) and 8 μl of Liz500 size standard (Applied
Biosystems, California USA). Size calling was performed on 3310 ABI sequencer (Applied
Biosystems, California USA) and fingerprints assembled on a Peak Scanner™ (Applied
Biosystems, California USA). The peak scanner is free software widely used to view, edit and
analyze the DNA fragment data from ABI sequencer. A cut off point for fragment sizes included
in further analysis was between 50 and 500 bp, which were above the range for primer dimer
formation and in the range of size standard. Terminal restriction fragment length polymorphism
(TRFLP) analysis was done in triplicate for each sample.
2.2.5 Statistical analysis of TRFLP data
The output from the peak scanner was analyzed using T-align software (Smith et al.
2005). The T-align helps in the comparison of TRFLP data in the replicates of the sample and
generates a consensus profile containing TRF only present in both replicates. The generated
profile will be compared with other sample TRFLP consensus profiles to generate a matrix based
on presence/absence of TRF. The output of the T-align can directly be used in the different
statistical software. The presence/absence data was entered into the PAST software (Hammer et
al. 2001) and different statistical analysis like Principal Component Analysis (PCA), Cluster
analysis and Diversity Indices were performed.
The PCA is an ordination statistical tool widely used in TRFLP analysis. This tool has the
ability to analyze large data sets by converting them into a smaller number of uncorrelated
variables called components (Schütte et al. 2008). This property is essential in case of TRFLP
analysis, where the datasets are larger in number. By converting the original data into new
17
The cluster analysis is performed in order to identify the similarity between the samples
using different similarity measures and to form groups between closely related samples. The
Jaccard’s index is the widely used method for presence/absence data. The grouping in the cluster
analysis can be used to substantiate the results obtained through PCA.
The diversity indices like the Shannon index and Simpson index are widely applied in the
field of Ecology but in recent times these indices are also used to analyze TRFLP data. The
Shannon index (Shannon CE and Weaner W 1949) explains the diversity of a sample by
counting the number of species (richness) and their relative abundance. In case of TRFLP, the
number of TRF peaks will represent the richness and the peak area will represent the relative
abundance. The sample with higher number of equally distributed microbial species will have
higher diversity, so both richness and relative abundance have an impact on Shannon index.
Even though the diversity indices are used in T-RFLP to explain the diversity of the samples, the
Shannon index cannot reflect the genuine diversity of the sample (Blackwood CB 2007). In
ecological studies, the diversity index of a geographical region is calculated based on physical
evidence on the richness and abundance of plants/animals. Whereas in case of TRFLP peak area
is used to calculate the abundance of the species but peak area is error prone. The numbers of
PCR cycle, selection of restriction enzymes and capillary electrophoresis all have impact on peak
area. Therefore in case of TRFLP the numbers provided by these indices will not be considered
as actual diversity instead it will be relatively used to compare the samples. If the diversity index
value is high for a sample it will be viewed as a sample with higher microbial diversity.
2.2.6 Species Identification
The species identification was performed using Phylogenetic Assignment Tool (PAT)
(Kent. et al., 2003). In this web based tool the TRFLP data submitted by the user is compared
with the predicted TRF data to identify the species. The software like MiCA (Microbial
Community Analysis) (Shyu et al., 2007) have the ability to generate a TRF database based on
the primer and enzyme information provided by user by in-silico digestion of 16S rRNA
18
to perform species identification. The PAT has the ability to handle TRF data from multiple
enzyme digestion and narrow down the species. In this experiment data from three different
enzyme digestions were used.
2.3 Results and Discussion
The T-RFLP analysis was performed using three different restriction enzymes (Hae lll,
Hha l and Msp l) and digestion with each enzyme performed separately. Despite using three
enzymes in restriction digestion to generate three separate TRFLP profiles for a single sample,
the actual purpose of the three different TRFLP data was to use it in PAT species identification.
The PAT requires TRF information from different enzyme digestion to narrow down the species
names. In the case of statistical analysis, only the TRFLP profile generated from Hae lll enzyme
was used. In case of statistical analysis TRF data from single restriction enzyme can provide
significant information about the change in microbial community structure between the samples.
Even though the TRFLP analysis was performed using replicate samples, the results will lack
error bars/standard deviations. Replicate T-RFLP data were aligned using T-align (details in
section 2.2.5) before being processed by PAST software, thus replicates are expressed as a single
value.
2.3.1 Statistical analysis to determine the best RNA preservative solution
In this study, the PCA (Principal Component Analysis) and cluster analysis were used for
two purposes, first to identify the best soil RNA preservation solution and second to study the
similarity/difference between the RNA and DNA.
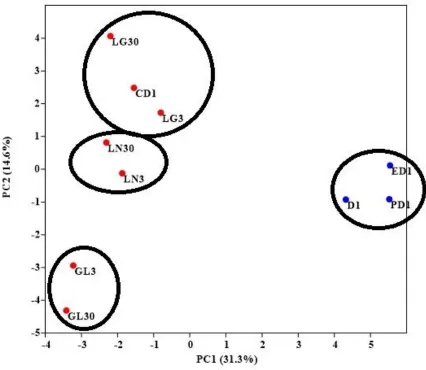
In the case of RNA samples three groups were observed. In the first group the control
sample (CD1) and LifeGuard™ treated samples (LG3 and LG30) were found. The flash frozen
samples (LN3 and LN30) and glycerol treated samples (GL3 and GL30) form the second and
third group respectively (Fig 2.2). Even though the T-RFLP analysis was performed on
RNAlater® treated samples (RL3 and RL30) these samples were not included in the statistical
19
al. 2010 had proved the inefficiency of RNAlater® to preserve RNA in soil. The RNAlater®
having a high concentration of ammonium sulfate may cause precipitation and fixation of
proteins and other organic compounds such as humic acids on nucleic acids (Rissanen et al.
2010). This directly affects the quantity and quality of RNA during extraction.
The control RNA being extracted immediately after sample collection will tend to have
little to no RNA degradation. Therefore the control RNA will represent the actual microbial
population found in the FFT sample. The similarities between treated/preserved RNA’s and
control RNA will be used as a proxy to determine the best preservation method. The
LifeGuard™ treated samples seem to have higher similarity with control samples(Fig 2.2); this
shows its efficiency in preserving RNA in complex environmental samples like oil sands tailings.
Here the cluster analysis of Jaccard’s similarity index is used to confirm the results of
PCA. The cluster analysis (Fig 2.3) was performed using presence/absence data. In the case of
RNA two groups of clusters were formed. In this statistical analysis, even though a similarity
was observed between liquid nitrogen treated samples and LifeGuard™ treated samples the
major difference between the two methods are the inactivation of RNase. The LifeGuard™
solution has the ability to keep the RNase completely inactive during storage and
homogenization of the samples. However, in the case of flash freezing, the reactivation of RNase
is possible during homogenization and this may lead to degradation of RNA. Furthermore, the
accessibility of liquid nitrogen in a field setting is also a significant challenge.
The Shannon index is the commonly used diversity index to explain the species richness
and relative abundance of a sample, utilizing the peak area data of the TRF. The diversity index
was used to compare different RNA samples. All of the samples appear to have high diversity,
but with the aim being to simply compare the samples, the sample with the highest value will be
considered the best preserved sample. From the comparison (Table 2.1) the 30 day lifeguard
treated sample seemed to have the highest (value) diversity followed by control and 3 day flash
frozen sample. The lowest diversity was observed in samples treated with glycerol. A study
conducted by Sessitsch et al. 2002 proved the efficiency of glycerol in soil RNA preservation,
20
compatible RNA preservative solution should be the first step in the study of active microbial
population. Even though the 3 day flash frozen sample showed a higher diversity a sharp decline
in the diversity was observed after 30 days. On the other hand, the LifeGuard™ preservation saw
a significant increase in diversity over the long-term storage period. This increase in total TRF
after treating with lifeguard was also documented in our previous work (unpublished) but since
the lifeguard solution is a patented solution the exact mechanism for this increase cannot be
identified. This clearly proves the efficiency of the LifeGuard™ solution in preserving soil RNA
21
Figure 2.2: PCA based on Presence/Absence data of Bacterial 16s rRNA and 16s rDNA;
Samples in Red and Blue represents RNA and DNA samples respectively. CD1 = RNA control,
LG3 = LifeGuard™ treated after 3 d (RNA), LG30 = LifeGuard™ treated after 30 d (RNA),
GL3 = Glycerol treated after 3 d (RNA), GL30 = Glycerol treated after 30 d (RNA), LN3 =
Liquid nitrogen treated after 3 d (RNA), LN30 = Liquid nitrogen treated after 30 d (RNA). ED1
22
Figure 2.3: Cluster analysis - Jaccard’s similarity based on Presence/Absence data of Bacterial
16s rRNA and 16s rDNA. CD1 = RNA control, LG3 = LifeGuard™ treated after 3 d (RNA),
LG30 = LifeGuard™ treated after 30 d (RNA), GL3 = Glycerol treated after 3 d (RNA), GL30 =
Glycerol treated after 30 d (RNA), LN3 = Liquid nitrogen treated after 3 d (RNA), LN30 =
Liquid nitrogen treated after 30 d (RNA). ED1 = Eluted DNA control, PD1 = PMA-DNA, D1 =
23
Table 2.1: Diversity index of RNA samples (CD1 = RNA control, LG3 = LifeGuard™ treated
after 3 d (RNA), LG30 = LifeGuard™ treated after 30 d (RNA), GL3 = Glycerol treated after 3 d
(RNA), GL30 = Glycerol treated after 30 d (RNA), LN3 = Liquid nitrogen treated after 3 d
(RNA), LN30 = Liquid nitrogen treated after 30 d (RNA).
Samples TRF Shannon Index
CD1 123 4.316
LG3 111 4.228
LG30 135 4.483
GL3 89 4.139
GL30 85 4.130
LN3 116 4.304
LN30 99 4.212
2.3.2 Comparison of DNA, PMA-DNA and RNA
From the PCA (Fig 2.2) and cluster analysis (Fig 2.3) it is clear that the RNA
characterization is quite distinct from that of DNA. Even though both RNA and DNA were
isolated from same sample they tend to show a different microbial community structure which
separates them in the PCA-plot and cluster analysis. A deeper understanding of this difference
between DNA and RNA may help prove the importance of these nucleic acids in microbial
ecology.
In this analysis three different types of DNA control were used, first the Eluted DNA
control, then PMA untreated and PMA treated DNA. The second and third DNA control was
isolated using Power soil DNA isolation kit (MO BIO Laboratories, Inc, California). Even
though the Eluted DNA (EDNA) gave sufficient TRF for statistical analysis, the EDNA cannot
be used for species identification. The EDNA was included in the experiment just to study the
impact of the extraction method and sample quantity on DNA quality. Through statistical
analysis it is clear that regardless of sample quantity and isolation method the EDNA,
24
being isolated by the kit specifically designed for the DNA extraction it can be used for species
identification and comparison with RNA.
The DNA is the most stable macromolecule and can persist in soil for a longer duration
even after the death of the microorganism. By extracting DNA from soil samples extracellular
DNA, DNA from both dead and live cells will be gained. Analyzing this DNA sample may lead
to an overestimation of the microbial population. This issue might be solved by using Propidium
Monoazide (PMA). Theoretically the analysis of PMA treated samples will give information
only about the live cells. But its role in complex environmental samples is yet to be tested. Even
though the PMA-DNA can give information about live cells, all live cells need not be active at
all times. Thus the active microbial community of a sample can be studied using RNA. The
comparison of DNA, PMA-DNA and RNA can give complete information about the microbial
community structure of any sample.
From table 2.2, it is clear that the control RNA sample has higher amount of TRF
followed by PMA-DNA and untreated DNA sample. But based on the previous description the
untreated DNA sample should have a higher amount of TRF because it represents extracellular
DNA, dead cells and live cells. The TRF of PMA-DNA should be a subset of untreated DNA
because it represents only the live cells. The TRF of control RNA sample should be a subset of
DNA because it represents only the active cells. Our hypothesis about the DNA,
PMA-DNA and RNA was disproved, so further analysis was performed to find the factors responsible
for these changes.
The table 2.3 compares the untreated DNA to PMA-DNA based on their unique TRF
and shared TRF. From this data it is clear that the TRF of untreated DNA is principally a subset
of PMA-DNA because most of the TRF of untreated DNA is shared with PMA-DNA, while only
the PMA-DNA has unique TRF. This loss of TRF in the untreated DNA sample may be due to
storage, extraction, PCR and T-RFLP analysis. In the experiment the only difference between the
untreated DNA and PMADNA was their storage. The untreated DNA samples were stored at
-20°C for a period of one week and extraction was performed, whereas in case of PMA-DNA
25
immediately. This difference in storage between the DNA sample and the PMA - DNA sample
was not deliberate but an unexpected one. The PMA-DNA extraction was performed
immediately because the purpose of PMA was to study live cells and therefore extraction without
storage is crucial. Some previous studies (Lauber et al. 2010, Larson et al. 2009) reported that the
different storage methods have no effect on DNA quality and quantity, but this is not true for all
types of samples (Lee et al. 2007). From the experiment, it is clear that the samples like oil sands
tailings with high concentration of clay and other organic compounds may have an impact on the
concentration of DNA during extraction (Ogram et al. 1988, Cai et al., 2005). The storage of
complex environmental samples provides an increased opportunity for clay like particles to bind
to DNA and inhibit its extraction. The untreated DNA lost some TRF and did not reflect the
actual sample diversity compared to PMA-DNA, therefore for the purpose of comparison with
control RNA, the data of PMA-DNA was used.
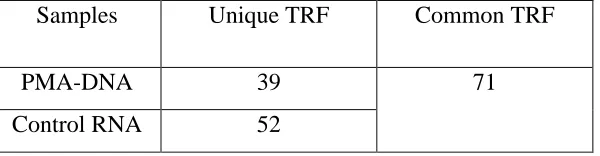
The Table 2.4 compares PMA-DNA and RNA based on their unique TRF and shared
TRF. From the data it is clear that both DNA and RNA have higher numbers of both unique and
shared TRF. The hypothesis states that the TRF of RNA is merely a subset of PMA-DNA, but
through the analysis it was proved wrong. The presence of unique TRF in RNA was also been
documented in some previous work (Mengoni et al. 2005, Nogales et al. 2001). Unique TRF in
DNA may be found because of the presence of inactive live cells in the sample. The actual
reason for the difference between RNA and DNA are not well documented. Further analysis has
to be performed to understand this difference between the two macromolecules. This clearly
proves that in the case of complex environmental samples like oil sands tailings both DNA and
RNA should be studied to understand the actual microbial community structure.
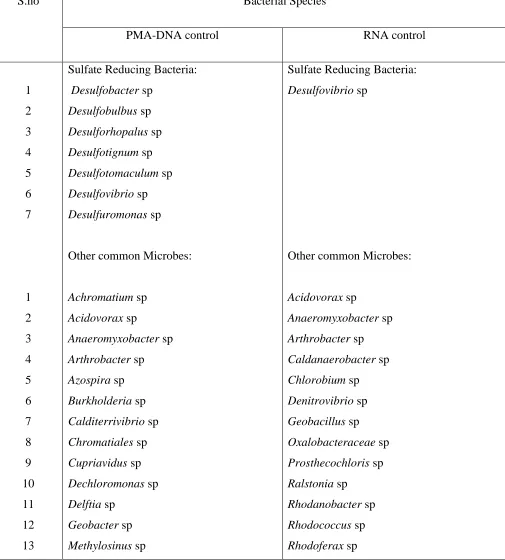
2.3.3 Species Identification
In order to compare PMA-DNA and RNA based on microbial population the species
identification was performed using a phylogenetic assignment tool (PAT). In PAT the T-RFLP
data from three different restriction enzymes is used for species identification. In the table 2.5 the
number of species included will be less compared to the total number of TRF, because of the
26
microbial species were observed using both DNA and RNA, whereas some were only detected
using one of the two nucleic acids. This study focused on SRB communities as they are
considered the leading contributor in the sulfur cycle. On comparing PMA-DNA and extracted
RNA, a greater diversity of SRB was detected in PMA-DNA compared to RNA signatures
(Table 2.5). The sample used for my analysis was collected from a 20 week old microcosm and
as per another experiment, during this time the sulfate reduction rate was declining in this
sample. This shows that the SRB were alive at the time of sample collection but not
metabolically active to be identified by RNA. This demonstrates the importance of RNA in
microbial ecology both in terms of identifying only metabolically active species and giving
information about species which are not identified by DNA.
Table 2.2: Comparison of DNA, PMA-DNA and RNA based on their Total TRF
Table 2.3: Comparison of untreated DNA and PMA-DNA depicting their unique and shared TRF
Table 2.4: Comparison of Control RNA and DNA depicting their unique and shared TRF
Samples Number of TRF
Untreated DNA 85
PMA DNA 110
Control RNA 123
Samples Unique TRF Common TRF
Untreated DNA 2
83
PMA-DNA 27
Samples Unique TRF Common TRF
PMA-DNA 39 71
27
Table 2.5: Comparison of Control RNA and PMA-DNA based on bacterial species identified
using Phylogenetic Assignment Tool (PAT)
S.no Bacterial Species
PMA-DNA control RNA control
1 2 3 4 5 6 7 1 2 3 4 5 6 7 8 9 10 11 12 13
Sulfate Reducing Bacteria:
Desulfobacter sp
Desulfobulbus sp
Desulforhopalus sp
Desulfotignum sp
Desulfotomaculum sp
Desulfovibrio sp
Desulfuromonas sp
Other common Microbes:
Achromatium sp
Acidovorax sp
Anaeromyxobacter sp
Arthrobacter sp
Azospira sp
Burkholderia sp
Calditerrivibrio sp
Chromatiales sp
Cupriavidus sp
Dechloromonas sp
Delftia sp
Geobacter sp
Methylosinus sp
Sulfate Reducing Bacteria:
Desulfovibrio sp
Other common Microbes:
Acidovorax sp
Anaeromyxobacter sp
Arthrobacter sp
Caldanaerobacter sp
Chlorobium sp
Denitrovibrio sp
Geobacillus sp
Oxalobacteraceae sp
Prosthecochloris sp
Ralstonia sp
Rhodanobacter sp
Rhodococcus sp
28 14 15 16 17 18 19 20 21
Polaromonas sp
Ralstonia sp
Rhodococcus sp
Rhodoferax sp
Rhodopseudomonas sp
Sideroxydans sp
Thiothrix sp
Verrucomicrobiales sp
Rhodopseudomonas sp
Sphingomonas sp
Holophaga sp
Nitrospirae sp
Sulfurihydrogenibium sp
2.4 Conclusions
In this study T-RFLP of 16s rRNA/cDNA was successfully used to identify the best
preservation method for microbial RNA in the oil sands tailings sample. The statistical analysis
of T-RFLP data have shown a higher similarity between lifeguards treated samples and control
sample. Thus we conclude that the LifeGuard™ Soil Preservation Solution (MO BIO
Laboratories, Inc, California) can be used for short-term and long-term preservation of soil
microbial RNA. This finding is crucial as the LifeGuard™ Soil Preservation Solution (MO BIO
Laboratories, Inc, California) can be successfully employed for field sample collection and
preservation of oil sands tailings. The RNAlater® solution specifically designed for tissue
samples seems to be incompatible with the tailings sample. The glycerol preservation method on
comparison with lifeguard method seems to be less efficient in preserving soil RNA both short
and long-term. Even though the flash freezing was effective for short-term storage, the RNA
quality was compromised after long-term storage.
Even though the goal in comparing untreated DNA sample and PMA treated DNA
samples was to find the effectiveness of PMA in identifying live microbial population in FFT,
the difference in storage of the samples revealed a different but significant result. The
PMA-DNA extracted immediately after sample collection had a higher number of TRF compared to
untreated DNA, which was stored at -20°C for a week before extraction. Therefore in order to
reflect the actual microbial community structure of complex environmental samples the DNA
29
The PMA-DNA and RNA were compared based on total number of TRF and through
species identification to detect their significance in microbial ecology. Even though theoretically,
the TRF from RNA is merely a subset of PMA-DNA, through the analysis it was determined that
both PMA-DNA and RNA have shared and unique TRF. Therefore in any sample, in order to get
a clear understanding of the live microbial community structure, both PMA-DNA and RNA has
30
Chapter 3 - Evaluation of Microbial community structure in FFT using T-RFLP
3.1 Introduction
Biogeochemical processes are driven by microorganisms in all types of environments. As
stated in General Introduction (Chapter 1), successful conversion of oil sands tailings ponds to
wetlands requires an understanding of the biogeochemical processes taking place within the
tailings. To reclaim oil sands tailings ponds as wetlands, the FFT material, which forms the basic
substrate of these wetlands, has to be harmless to the aquatic organisms. To determine the
potential effects these tailings may have on aquatic organisms, long-term assessment of the
biogeochemical processes occurring in the FFT has to be considered. These assessments have to
be performed in different tailings ponds operated by different industries to understand the
similarity and difference between the ponds, which is crucial for pond management. In this study
the samples were collected from STP (South Tailings Pond) operated by Suncor Energy Inc. The
results obtained from STP were compared with our previous study (Chi Fru et al. 2013 and Chen
et.al 2013) performed on WIP (West in Pit) operated by Syncrude Canada Ltd to establish the
relationship between the ponds (Fig 3.1).
Being an essential nutrient for most of the aquatic organisms dissolved oxygen is
responsible for the successful development of wetland ecosystems. Therefore the study on
sediment oxygen demand is of primary importance. A study conducted by Gelda et al 1995 has
shown the role of methane, ammonia and sulfides for sediment oxygen demand in Lake system,
with sulfides being the largest contributor to SOD. Though some environments will have less
impact from sulfides, oil sands tailings material has a significant sulfate reducing bacterial
community, therefore playing a significant role on SOD (Ramos-Padrón et al. 2011, Holowenko
et al. 2000). Study by Chen et.al 2013 has proved the higher activity of sulfate reducing bacteria
and in turn production of higher amount of sulfides. Even though the sulfate reducing bacteria
was successfully used in hydrocarbon degradation and inhibition of methanogenesis (Holowenko
et al. 2000, Fedorak et al. 2002), the hydrogen sulfide produced during these processes are toxic
(Smith and Oseid 1971) and highly reductive in nature. It is these properties of hydrogen sulfide
31
the study on sulfate reduction and other associated chemical processes are crucial in order to
develop a reclamation procedure.
In this study laboratory microcosm experiments are used to understand the chemical and
biological processes taking place in fluid fine tailings. The study by Chi Fru et al. 2013 showed
that the microbial community structure in laboratory microcosms represent the community
structure in the actual tailings ponds. In the study, the chemical analysis was performed by Reid
et al (unpublished) using sensitive micro sensors and pore water extraction techniques to
understand the chemical cycles taking place in FFT. This thesis will concentrate on biological
analysis, the T-RFLP method was used to understand the microbial community structure of FFT
(Fig 3.2). The T-RFLP method being a PCR based method is widely used to demonstrate a shift
in microbial community structure and species identification (Schütte et al. 2008, Kent et al.
2003). The 16s rDNA (16s rRNA gene) of both Bacteria and Archaea were analyzed by T-RFLP
throughout the study period (20 weeks) to understand the change in the community structure
over time. Different statistical methods were used to analyze the T-RFLP data, to establish the
similarities/differences between the samples collected from microcosms at different time
intervals, atmospheric conditions and depths. Species identification was performed to track the
SRB population in the FFT samples. The information obtained through statistical analysis and
species identification will be used in the future to validate the chemical data.
3.2 Materials and Methods
3.2.1 Sample collection
The fluid fine tailings (FFT) and oil sands processed water (OSPW) were obtained from
South Tailings Ponds (STP) operated by Suncor Energy Inc, located in the Athabasca region,
Alberta. The FFT and OSPW were shipped to our laboratory in 20 liter buckets and these
samples upon arrival were separated into two batches. One batch was stored at 4°C. The other
batch sent to McMaster Nuclear Reactor (MNR), Hamilton for gamma irradiation treatment. The
FFT and OSPW were gamma irradiated at 28KGY over 24 hour’s leading to complete
32
3.2.2 Experimental Design
The evolution of the biogeochemical processes within the FFT was studied for a period of
20 weeks through laboratory microcosm experiments. The experiments were performed under
both oxic and anoxic conditions (Fig 3.3). The abiotic (gamma irradiated) sample was also
included in the experiment as a control. The sample collections from the microcosms were
performed after 4, 8 and 20 weeks. For each sampling period two biotic and abiotic microcosms
(replicates) were maintained under each atmospheric condition. The microcosms used in this
study were clear plastic tubes with a flat base and an independent PVC cap, designed by the
University of Windsor technical support center. The microcosms were sterilized using 95%
ethanol before introducing the FFT. To all the microcosms, approximately 800 g of FFT and 400
g of OSPW was added. The FFT and OSPW were thoroughly mixed using a power portable drill
with a sterilized Teflon-coated stirring paddle. Anaerobic microcosms were given an airtight
PVC lid using closed-cell weatherstripping. The headspaces were flushed with ultra-pure
nitrogen and placed in the anaerobic chamber to maintain anaerobic conditions. All the
microcosms were maintained under dark environment at room temperature.
3.2.3 Microcosm sample collection
The FFT samples were semi-solid in nature and were collected through the disposable
sterilized micropipette tip using 5 ml micropipette. The sample collection was performed at
water-sediment interface and at the bottom of the microcosm. Immediately after sample
collection, the samples were treated with PMA and DNA extractions were performed.
3.2.4 PMA treatment and DNA extraction
PMA™ (Propidium Monoazide) dye, 20 mM in H2O (Biotium, Inc) was used in the
experiment (Nocker et al. 2006). 100 µM of PMA was added to 0.25g sample and mixed
thoroughly. The samples were incubated in the dark for 5 minutes at room temperature. After
incubation the sample tubes were placed on the ice and were exposed to light for 5 minutes using
33
performed using PowerSoil® DNA Isolation Kit (Mo Bio, Laboratories Inc, California)
following manufacturer’s instruction, with the extracted DNA being stored at -20°C. The
extractions were performed in triplicate and were pooled together before performing further
experiments.
34
Figure 3.2: Conceptual diagram depicting different work involved in characterization of FFT