ESTIMATING PRODUCTIVITY EMISSION RATES AND COST
EMISSION RATES OF DIESEL CONSTRUCTION EQUIPMENT
William Rasdorf, Ph.D., P.E. rasdorf@ncsu.edu
Department of Civil, Construction, and Environmental Engineering North Carolina State University
Raleigh, NC 27695-7908
Phil Lewis, Ph.D., P.E. mplewis@ncsu.edu
Department of Civil, Construction, and Environmental Engineering North Carolina State University
Raleigh, NC 27695-7908
H. Christopher Frey, Ph.D. frey@ncsu.edu
Department of Civil, Construction, and Environmental Engineering North Carolina State University
Raleigh, NC 27695-7908
ABSTRACT
Diesel construction equipment is used extensively in building the nation’s infrastructure. This equipment emits high levels of pollutants, including nitrogen oxides, hydrocarbons, carbon monoxide, carbon dioxide, and particulate matter. Currently, there is not an effective method to determine emissions estimates of building projects prior to beginning construction. As a first step to obtaining such a method, this paper presents an innovative approach that may be used to estimate the emissions footprint of a construction activity based on equipment emission rates, equipment production rates, and activity unit costs by using two emissions factors: productivity emission rate and cost emission rate.
Productivity emission rates are emission factors based on units of production, such as grams of pollutant emitted per cubic yard of excavation (g/cy). Cost emission rates are emission factors based on the cost of the construction activity, such as grams of pollutant emitted per dollar of construction cost (g/$). This methodology is demonstrated by a simple case study of a bulldozer performing a topsoil stripping activity. Individual results are compared for two bulldozers with engine sizes of 200 and 300 horsepower while working under both ideal and adverse site conditions. The average productivity emission rates range from 0.22 g/cy for hydrocarbons to 447 g/cy for carbon dioxide. The average cost emission rates range from 0.20 g/$ for hydrocarbons to 397 g/$ for carbon dioxide. Recommendations for the use of this methodology in determining and improving construction air pollution emissions estimates are also provided.
Keywords
2
INTRODUCTION
According to the Environmental Protection Agency (EPA, 2005), there are over two million items of construction and mining equipment in the United States. In 2009, it is estimated that this equipment will consume over six billion gallons of diesel fuel and produce approximately 643,000 tons of nitrogen oxides (NOx), 63,000 tons of
hydrocarbons (HC), 339,000 tons of carbon monoxide (CO), 71,000,000 tons of carbon dioxide (CO2), and 60,000 tons of particulate matter (PM). Construction and mining
equipment account for nearly one-half (45 – 48%) of the overall totals of each pollutant that will be emitted in 2009 by the nonroad diesel equipment emissions sector, including other categories such as agricultural, industrial, and commercial equipment.
Construction and mining equipment is used extensively in building the nation’s infrastructure; thus, construction projects have a major impact on the environment, particularly with regard to air quality. A method is needed to estimate the emissions footprint of construction projects in order to assess their overall environmental impact. Reliable emission factors based on commonly accepted construction estimating techniques are required for the methodology to be useful.
The objective of this paper is to present an innovative methodology for estimating the emissions footprint of construction activities based on productivity emission rates and cost emission rates. Productivity emission rates are emission rates based on units of production, such as grams of pollutant emitted per cubic yard of excavation (g/cy). Cost emission rates are emission rates based on the cost of construction, such as grams of pollutant emitted per dollar of construction cost (g/$). Productivity emission rates and cost emission rates may be used to estimate the total mass of pollutants emitted for a construction activity (and ultimately the entire project) based on a quantity takeoff and cost estimate of construction plans and specifications. This methodology is demonstrated by computing the productivity emission rates and cost emission rates for a topsoil stripping activity. This is a typical activity for nearly all projects that require grading and earthmoving work in the architectural-engineering-construction (AEC) industry.
RELATED WORK
3
These projects have served as a foundation for a series of publications related to the emissions of construction equipment. Abolhassani et al. (2007) evaluated the emissions of excavators in the field. Frey et al. (1) (2008) performed a comparison of petroleum diesel versus B20 biodiesel emissions from backhoes, motor graders, and wheel loaders performing field activities. Also, Frey et al. (2) (2008) characterized the field activity and emissions of selected motor graders fueled with petroleum diesel and B20 biodiesel.
The results of these projects have also been used to assess emissions regulations, compare data sources, evaluate fleet management decisions, and develop techniques for fuel use and emissions field data collection. Lewis et al. (1) (2009) examined requirements and incentives for reducing emissions from construction equipment and also advocated the use of field emissions data versus emissions data obtained from engine dynamometer tests. Lewis et al. (2) (2009) discussed the development and use of an emissions inventory for a fleet of backhoes, front-end loaders, and motor graders to make fleet management decisions related to replacing older equipment with newer equipment. Rasdorf et al. (2009) proposed a field methodology for collecting fuel-use and emissions data from nonroad equipment as it performs construction activities.
Frey et al. (3) (2008) assessed emission factors of NOx and PM for heavy-duty diesel
trucks based on field data. Although these are highway vehicles, heavy-duty diesel trucks are extensively involved in construction activities. Thus, this information can be used to evaluate total construction project emissions. Frey and Bammi (2003) evaluated probabilistic nonroad mobile source emission factors of NOx and HC for construction,
agricultural, and industrial engines, including both gasoline and diesel engines. This work used quantitative methods to characterize variability and uncertainty for these emission rates and can serve as a case study for other emission rate analyses.
METHODOLOGY
There are five items of information needed to calculate productivity emission rates and cost emission rates. These include the construction activity, the type of equipment needed to complete the activity, the production rate of the equipment, the unit cost of the activity, and the air pollutant emission rates of the equipment. Information regarding the activity, equipment type, production rates, and unit costs can be found in RS Means Heavy Construction Cost Data 2009 (RS Means, 2009); the equipment emission rates can be obtained from the EPA NONROAD model (EPA, 2005). The methodology for calculating the productivity emission rates and cost emission rates of HC, NOx, CO,
PM10, and CO2 is demonstrated in this paper for a topsoil stripping activity (RS Means
4
Figure 1. Calculating Productivity Emission Rates and Cost Emission Rates
Determine Productivity Emission Rate and Cost Emission Rate
Identify Construction Activity
(Topsoil Stripping and Stockpiling) (cy)
RS Means Heavy Construction Cost
Data 2009
EPA NONROAD2005
Model
Divide Equipment Emissions Rate by Equipment Production Rate
(Equation 1)
Cost Emission Rate
(Table 4) (g/$)
Productivity Emissions Rate
(Table 3)
(g/hr)
Identify Construction Equipment
(200 hp Bulldozer; 300 hp Bulldozer)
Divide Productivity Emissions Rate by Activity Unit Cost
(Equation 2)
Identify Equipment Emissions Rates
(Table 1) (g/hr)
Identify Equipment Production Rate
(Table 2) (cy/hr)
Identify Activity Unit Cost
5
In order to determine the productivity emission rates for an activity (g/cy), the mass per time emission rate of the equipment is divided by its time-based production rate (Equation 1 in Figure 1). The methodology presented here utilizes grams per hour (g/hr) emission rates obtained from the EPA NONROAD2005 model and hourly production rates (cy/hr) for a topsoil stripping activity obtained from RS Means. Table 1 summarizes the respective emission rates of HC, NOx, CO, PM10, and CO2 for each
bulldozer and Table 2 summarizes the hourly production rates and unit cost data.
Table 1. Hourly Emission Rates for 200 hp and 300 hp Bulldozers (Based on EPA NONROAD2005 Model)
Bulldozer (hp)
HC (g/hr)
NOx
(g/hr)
CO (g/hr)
PM10
(g/hr)
CO2
(g/hr)
200 41 578 178 43 74,460 300 62 1,188 493 76 134,509
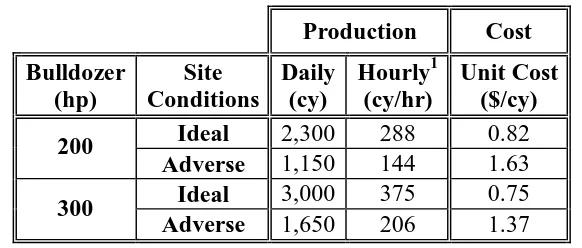
Emissions intensity is an emission factor used by EPA (EPA, 2009) that is based on the emissions produced per dollar of gross domestic product; it is a means for comparing emissions while taking into account economic output. Similarly, the cost emission rate is defined as the mass of pollutant emitted per dollar of construction cost (g/$). In order to determine the cost emission rates for an activity, the productivity emission rate is divided by the unit cost of the activity (Equation 2). This case study uses the RS Means unit cost data including overhead and profit as a basis for calculating the cost emission rates for the topsoil stripping activity. The unit cost data for the topsoil stripping activity are presented in Table 2.
Table 2. Production and Cost Data for a Topsoil Stripping Activity (Based on RS Means Construction Cost Data 2009)
Production Cost
Bulldozer (hp)
Site Conditions
Daily (cy)
Hourly1 (cy/hr)
Unit Cost ($/cy) Ideal 2,300 288 0.82 200
Adverse 1,150 144 1.63 Ideal 3,000 375 0.75 300
Adverse 1,650 206 1.37
1
Based on an eight hour workday
The following sample calculations represent how the NOx productivity emission rate
(PENOx) and cost emission rates (CENOx) are determined for the topsoil stripping activity
using a 200 hp bulldozer under ideal conditions:
PENOx = Hourly Emissions (g/hr) ÷ Hourly Production (cy/hr) (Equation 1)
6
CENOx = Productivity Emission Rate (g/cy) ÷ Unit Cost ($/cy) (Equation 2)
= 2.0 (g/cy) ÷ 0.82 ($/cy) = 2.5 (g/$)
RESULTS
This section presents the productivity emission rates and cost emission rates for the topsoil stripping activity described in the methodology section. A brief discussion is also provided on estimating total emissions of a topsoil stripping and stockpiling activity using productivity emission rates and cost emission rates.
Productivity Emission Rates and Cost Emission Rates
Table 3 summarizes the productivity emission rates for each pollutant based on the topsoil stripping activity conditions presented in RS Means. Based on site conditions, the productivity emission rates for each pollutant for a 200 hp bulldozer operating under adverse conditions is twice as high as those under ideal conditions. This is because the production rate of the 200 hp bulldozer under adverse conditions is one-half the production rate under ideal conditions; thus, the productivity emission rates are inversely proportional to the production rate. This is true for the 300 hp bulldozer; the productivity emission rates for each pollutant is approximately 45% lower for ideal conditions compared to adverse conditions because the production rate for the 300 hp bulldozer is approximately 45% lower for adverse conditions compared to ideal conditions.
Based on the engine size of the bulldozers, the productivity emission rates under ideal conditions are lower for the 200 hp bulldozer compared to the 300 hp bulldozer by approximately 18 – 54% for each pollutant. Under adverse conditions, the productivity emission rates for the 200 hp bulldozer compared to the 300 hp bulldozer is lower by approximately 7 – 50% for each pollutant. These results are due to the fact that the emission rates of the 300 hp bulldozer compared to the 200 hp bulldozer increases by approximately 51 – 177% for each pollutant and the production rate for a 300 hp bulldozer compared to a 200 hp bulldozer is approximately 30% higher under ideal conditions and approximately 43% higher under adverse conditions. Thus, the productivity emission rates vary according to the emission rate of each pollutant and the production rate based on site condition, but the variation is not proportional.
Table 3. Productivity Emission Rates for a Topsoil Stripping Activity
Bulldozer (hp)
Site Conditions
HC (g/cy)
NOx
(g/cy)
CO (g/cy)
PM10
(g/cy) CO2
(g/cy)
Ideal 0.14 2.0 0.6 0.15 259 200
Adverse 0.28 4.0 1.2 0.30 518 Ideal 0.17 3.2 1.3 0.20 359 300
7
Table 4 summarizes the cost emission rates for each pollutant based on the topsoil stripping activity conditions presented in RS Means. Based on site conditions, the cost emission rates for each pollutant is essentially the same for both ideal and adverse conditions; this is true for both the 200 hp and the 300 hp bulldozer. The reason for this is because the hourly production rate and the unit cost are inversely proportional to each other. For example, the hourly production rate for the 200 hp bulldozer decreases by 50% for adverse versus ideal conditions but the unit cost increases by 100% for adverse versus ideal conditions. For the 300 hp bulldozer, the hourly production rate decreases by 45% for adverse versus ideal conditions but the unit cost increases by 83% for adverse versus ideal conditions. The hourly production and unit cost are both needed for estimating the cost emission rates. Thus, the cost emission rates will be approximately equal for each site condition.
Table 4. Cost Emission Rates for a Topsoil Stripping Activity
Bulldozer (hp)
Site Conditions
HC (g/$)
NOx
(g/$) CO (g/$)
PM10
(g/$) CO2
(g/$)
Ideal 0.17 2.5 0.8 0.18 316 200
Adverse 0.17 2.5 0.8 0.18 318 Ideal 0.22 4.2 1.8 0.27 478 300
Adverse 0.22 4.2 1.7 0.27 476 Average 0.20 3.3 1.3 0.23 397
Based on engine size, the cost emission rate of each pollutant increases by approximately 29 – 125% for the 200 hp versus the 300 hp bulldozer. Here again, the site conditions have no impact on the cost emission rates. Since the hourly production rate and the unit cost are inversely proportional, the increase in the cost emission rates for the 200 hp versus the 300 hp bulldozer is primarily due to the higher emission rates for the 200 hp versus the 300 hp bulldozer.
Total Emissions
There are two primary ways to estimate the total emissions of each pollutant for the topsoil stripping activity based on the data in Tables 3 and 4. The first way is to use the productivity emission rates and cost emission rates for each pollutant found on each row of the tables based on the respective bulldozer engine size and site condition. This way is most effective when the bulldozer engine size and the site conditions are known. The second way is to use the average productivity emission rates and cost emission rates provided for the topsoil stripping activity. This way is particularly effective at providing a rough order of magnitude estimate of emissions when specific equipment and site condition information is not known.
8
Based on the averages in Table 3, the estimator can produce a rough order of magnitude estimate for the total mass of each pollutant that will be emitted for this activity. In this example, approximately 180 g of HC (0.22 g/cy x 800 cy), 3000 g of NOx, 1100 g of CO,
250 g of PM10, and 358,000 g of CO2 will be emitted while stripping and stockpiling
topsoil at this site.
Likewise, if a project stakeholder is given a cost breakdown of construction activities for a project and sees that the cost for stripping and stockpiling topsoil for a one acre site is $1100 (based on $1.37 per cy), then the estimator can use the average cost emission rates in Table 4 to estimate the total mass of pollutants emitted for this activity. In this case, approximately 220 g of HC (0.2 g/$ x $1100), 3600 g of NOx, 1400 g of CO, 210 g of
PM10, and 437,000 g of CO2 will be emitted at this site for this activity.
CONCLUSIONS AND RECOMMENDATIONS
Productivity emission rates and cost emission rates are useful for quantifying total emissions of air pollutants for construction activities. These two emissions factors are based on emission rates, production data, and cost data. These data are readily available from reliable sources such as the EPA NONROAD2005 model (emission rates) and RS Means Heavy Construction Cost Data (production and cost data). Thus, the methodology presented here could be expanded to include all emissions-producing activities found in RS Means Heavy Construction Cost Data (or other estimating guides).
In addition to quantifying the total emissions of construction activities, productivity emission rates and cost emission rates can be used to quantify the total emissions for each cost division of the project cost estimate, such as the CSI MasterFormat divisions (CSI, 2004). By doing so, it is possible to determine where emissions intensive activities occur, such as Concrete (Division 3), Earthwork (Division 31), or Utilities (Division 33). By identifying problematic divisions with regards to emissions, it is possible to develop mitigation strategies, such as alternative equipment selection or revised activity sequencing.
9
Not only are productivity emission rates and cost emission rates useful for estimating total project emissions, they can also be used to estimate emissions for various construction industry sectors. For example, the methodology presented here can be used to estimate the total emissions for many projects and then group the results by construction sector, such as commercial, residential, industrial, or heavy highway. By doing so, it is possible to develop new emissions inventories for the construction industry and also refine the data in existing inventories.
Emissions inventories are necessary to perform a thorough analysis of the environmental impacts of construction projects. Currently, there is a lack of substantial data related to construction projects to develop these emission inventories. Productivity emission rates and cost emission rates can help fill this need. These two emissions factors form the basis of a simple yet accurate methodology that can be used to develop meaningful emissions inventories for the construction industry. This methodology can be used by design and construction professionals, project owners and developers, environmental engineers, and policy and regulatory strategists to address the environmental concerns associated with construction.
REFERENCES
Abolhasani, S., C. Frey, K. Kim, S. Pang, W. Rasdorf, and P. Lewis, (2008). Real-World In-Use Activity, Fuel Use, and Emissions for Nonroad Construction Vehicles: A Case Study for Excavators, Journal of the Air & Waste Management Association, Vol. 58, No. 8.
CSI (2004). MasterFormat 2004 Edition: Numbers & Titles, The Construction Specifications Institute, Alexandria, VA.
EPA (2005). User’s Guide for the Final NONROAD2005 Model. EPA-420-R-05-013, U.S. Environmental Protection Agency, Office of Transportation and Air Quality, Ann Arbor, MI.
EPA (2009). Potential for Reducing Greenhouse Gas Emissions in the Construction Sector, Report for EPA’s Sector Strategies Program, Washington, DC.
Frey, C. and S. Bammi (2003). Probabilistic Nonroad Mobile Source Emission Factors, Journal of Environmental Engineering, Vol. 129, No. 2, pp. 162-168.
10
Frey, C. (1), W. Rasdorf, K. Kim, S. Pang, and P. Lewis (2008). Comparison of Real World Emissions of Backhoes, Front-End Loaders, and Motor Graders for B20 Biodiesel vs. Petroleum Diesel and for Selected Engine Tiers, Transportation Research Record, No. 2058, pp. 33-42.
Frey, C. (2), K. Kim, W. Rasdorf, S. Pang, and P. Lewis (2008). Characterization of Real-World Activity, Fuel Use, and Emissions of Selected Motor Graders Fueled with Petroleum Diesel and B20 Biodiesel, Journal of the Air & Waste Management Association, Vol. 58, No. 10.
Frey, C. (3), N. Rouphail, and H. Zhai (2008). Link-Based Emission Factors for Heavy-Duty Diesel Trucks Based on Real-World Data, Transportation Research Record, No. 2058, pp. 23 – 32.
Lewis, P. (1), W. Rasdorf, C. Frey, K. Kim, and S. Pang (2009). Requirements and Incentives for Reducing Construction Vehicle Emissions and Comparison of Nonroad Diesel Engine Emissions Data Sources, Journal of Construction Engineering and Management, Volume 135, No. 5, Pages 341-351.
Lewis, P. (2), C. Frey, and W. Rasdorf (2009). Development and Use of Emissions Inventories for Construction Vehicles, Transportation Research Record, Journal of the Transportation Research Board, In Press.
Rasdorf, W., Frey, H. C., Lewis, P., Kim, K., Pang, S-H., and Abolhassani, S., (2009). "Field Procedures for Real-World Measurements of Emissions from Diesel Construction Vehicles," Journal of Infrastructure Systems, American Society of Civil Engineers, In Press.