Efficient Analytical Architecture in Real-time
Big Data for Remotely Sensing Application
Using Hadoop Framework
S.J.Ohmpriya, Dr,Arokyraju, K.Ravikumar
P.G Student, Dept. of CSE, Rrase College of Engineering, Chennai, India1
Principal, Rrase College of Engineering, Chennai, India2
HOD, Dept. of CSE, Rrase College of Engineering, Chennai, India3
ABSTRACT: Big Data is the new experience curve in the new economy driven by data with high volume, velocity and
variety. The real-time remote sensing Big Data seems at first, and extracting the useful information in an effective manner leads a system toward a massive computational challenges, such as to analyze, aggregate, and store, where data are remotely gathered. Keeping in view the over mentioned factors; there is a need for designing a system architecture that welcomes both real-time, as well as offline data processing. Therefore, in this paper, we discuss real-time Big Data analytical architecture for remote sensing satellite application. In Architecture contains three main units, such as 1) remote sensing Big Data acquisition unit (RSDU); 2) data processing unit (DPU); 3) data analysis decision unit (DADU). Firstly, RSDU gathers data from the satellite and transmit this data to the Base Station, where initial processing takes place. Later DPU plays an essential role in architecture for efficient processing of real-time Big Data by providing filtration, load balancing, and parallel processing. Then DADU is responsible for compilation, storage of the results, and generation of decision based on the results received from DPU. The architecture has the capability of dividing, load balancing, and parallel processing of only useful data. Thus, it results in efficiently analyzing real-time remote sensing Big Data using earth observatory system. Finally, a detailed analysis of remotely sensed earth observatory Big Data for land and sea area are provided using Hadoop.
KEYWORDS: Big Data, Filtration, Load Balancing, Hadoop
I. INTRODUCTION
BIG data analysis can discover trends of various social aspects and preferences of individual everyday behaviors. This provides a new opportunity to explore fundamental questions about the complex world. For example, to build an efficient investment strategy, they analyzed the massive behavioral data sets related to finance and yielded a profit of even 326 percent higher than that of a random investment strategy. Choi and Varian presented estimate sketches to forecast economic indicators, such as social unemployment, automobile sale, and even destinations for personal travelling. Currently, it is important to provide efficient methods and tools for big data analysis.
II. RELATED WORK
Ahmed and Karypis 2012, Rezwan Ahmed, George Karypis, Algorithms for mining the evolution of conserved relational states in dynamic networks, Knowledge and Information Systems, December 2012 .They proposed the Dynamic networks that has been recognizedas a powerful abstraction to model and represent the temporalchanges and dynamic aspects of the data underlying manycomplex systems. Significant insights regarding the stable relationalpatterns among the entities can be gained by analyzingtemporal evolution of the complex entity relations. These can helpidentify the transitions from one conserved state to the next andmay provide evidence to the existence of external factors thatare responsible for changing the stable relational patterns inthese networks. But the Microarray gene-expression data and protein interaction data have their specific limitations, and as such, may not provide a measurement of all functional activities in a cell.
Alam et al. 2012, Md. HijbulAlam, JongWoo Ha, SangKeun Lee, Novel approaches to crawling important pages early, Knowledge and Information Systems, December 2012. They dictated that Web crawlers are essential to many Web applications, such as Web search engines, Web archives, and Web directories, which maintain Web pages in their local repositories. We studied that one of the most challenging issues for web search engines is finding high quality web pages or pages with high popularity for users and the problem of crawl scheduling that biases crawl ordering toward important pages.
A. Data Acquisition
Data collection is the process of gathering and measuring information on variables of interest, in an established systematic fashion that enables one to answer stated research question hypotheses, and evaluate outcomes. The data set contains information about users that are searching for the data and also marsh information. The page view static file contains data such as log of actions generated that were sent via up to filter the tosses request from an internal host. The filter is generating information like project name, page size of the request, and title of the page requested.
B. Preprocessing
Data preprocessing describes any type of processing performed on raw data to prepare it for another processing procedure. Commonly used as a preliminary data mining practice, data preprocessing transforms the data into a format that will be more easily and effectively processed for the purpose of the user. There are a number of different tools and methods used for preprocessing, including:sampling, which selects a representative subset from a large population of datatransformation, which manipulates raw data to produce a single inputde-noising, which removes noise from data normalization, which organizes data for more efficient access andfeatureextraction, which pulls out specified data that is significant in some particular context.
C. Balanced Partitioning
A partitioning Framework for FARQ in which partitioning is help for balancing data chunks into respective partitions. These partitions hold data for increasing processing speed. According to large data record field partitioning algorithm is separating and analyzing that particular record. Also, it is assigned a record from large data tables to small data tables.The sampling of data is necessary for the analysis on the big data as the data is present in huge amount.Partitioning is the unit of big data utilizes load balancing and local aggregate queries.
D. Fast Result on Aggregate Query
E. Performance Evaluation
After the project implementation of algorithms for processing of aggregate queries and applying an algorithm on them.The project has named node i.e. master node and data nodes (slave nodes).In this project first of all the partition of the data set is carried out which is uncontrolled as the Hadoop system does not control data. So by use of the balanced partition algorithm, data is controlled and chunks are created in the first stage of output. Then for mapping the data and utilizing the time histogram is generated. This is the second output of the project, which gives a benefit while matching contain with the user query .
III. RESULTS AND ANALYSIS
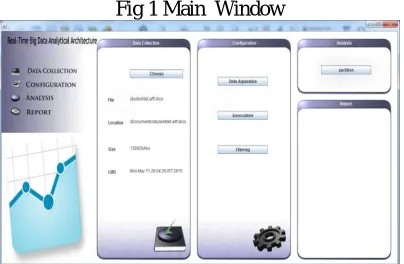
A detailed analysis of remotely sensed earth observatory Big Data for land and sea area are provided using Hadoop. Figure 1 shows the home page .
Fig 1 Main Window
A new data mining method that analyzes the time-persistent relations or states between the entities of the dynamic networks and captures all maximal non-redundant evolution paths of the stable relational states. Experimental results based on multiple datasets from real world applications show that the method is efficient and scalable.
Fig 2: Data Acquisition
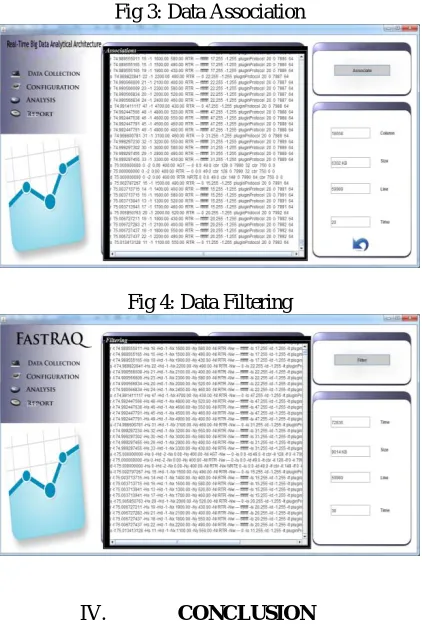
Fig 3: Data Association
Fig 4: Data Filtering
IV. CONCLUSION
V. FUTURE ENHANCEMENT
There are also some interesting directions for ourfuture work. First, FastRAQ can solve the 1:n format range-aggregatequeries problem, i.e., there is one aggregation columnand n index columns in a record. We plan to investigatehow our solution can be extended to the case of m:n formatproblem, i.e., there are m aggregation columns and n indexcolumns in a same record. Second, FastRAQ is now runningin homogeneous environments. We will further explore howFastRAQ can be applied in heterogeneous context or even asa tool to boost the performance of data analysis in DBaas.
REFERENCES
[1] P. Mika and G. Tummarello, “Web semantics in the clouds,” IEEEIntell. Syst., vol. 23, no. 5, pp. 82–87, Sep./Oct. 2008.
[2] T. Preis, H. S. Moat, and E. H. Stanley, “Quantifying tradingbehavior in financial markets using Google trends,” Sci. Rep.,vol. 3, p. 1684, 2013. [3] H. Choi and H. Varian, “Predicting the present with Googletrends,” Econ.Rec., vol. 88, no. s1, pp. 2–9, 2012.
[4] C.-T. Ho, R. Agrawal, N. Megiddo, and R. Srikant,, “Rangequeries in OLAP data cubes,” ACM SIGMOD Rec., vol. 26, no. 2,pp. 73–88, 1997. [5] G. Mishne, J. Dalton, Z. Li, A. Sharma, and J. Lin, “Fast data in theera of big data: Twitter’s real-time related query suggestionarchitecture,” in Proc. ACM SIGMOD Int. Conf. Manage. Data,2013, pp. 1147–1158.