Abstract
BREWER, ROGER ALAN. Electrical Energy Storage to Meet Evolving Aircraft Needs. (Under the direction of Dr.Subhashish Bhattacharya).
The value of “ultracapacitors” (also referred to as “supercapacitors” or “electric double layer
capacitors” in some literature but hereafter largely referred to as ultracapacitors) as an augmentation
device when placed in parallel with “electrochemical” energy storage (i.e. batteries) is presented in
this paper as well as a peak power assist case where ultracapacitor technology is paralleled with a
primary power supply. Since ultracapacitors possess unique attributes due to their higher energy
storage density (or Joules/WattHrs per mass) compared to conventional capacitors while maintaining
the peak power providing capability (to some degree) typical of conventional capacitors they may
provide a near term solution in applications demanding longer battery operating life and power
system robustness. Such demands may be more pronounced by the onset of evolving peak power
loads and “cold-crank” Auxiliary Power Unit (APU) electric-starting in demanding cold temperature
environments.
The potential benefits of an ultracapacitor in parallel with a battery will be illustrated through a very
simple lab demonstration as well as a more complex system consisting of a large motor “outrush”
load (cold-cranking condition) through the use of a computer simulation tool (Simulink). Similarly, a
peak power case will be evaluated through a simple lab demonstration and computer modelling (LT
Spice IV). All simulations and testing are intended to illustrate basic transient performance behavior
as improved energy storage technology might be applied to a power system (versus steady-state or
frequency response performance). In addition to the ultracapacitor discussions and demonstration,
other forms of advanced energy storage will be reviewed for their potential near or long term
application in meeting the evolving needs of aircraft. All results and discussions have been presented
in a general nature and not intended to be targeted at any specific aircraft configuration. A section
will also briefly discuss and explore literature relevant to more detailed aspects of modeling
ultracapacitor devices.
Based on the outcome of the case studies a recommended and high level technology roadmap will be
created for next generation ultracapacitor technology concepts that may contribute to further meeting
the needs studied. The final summary section will include a list of captured items that would be
prudent as follow-on activity and discuss parallels that are relevant beyond aircraft power systems to
the DC Micro-grid. The final summary section will also reemphasize the differences learned in the two
case studies and how these differences drive differing aspects of ultracapacitor technology
©
Copyright 2014 by Roger Alan BrewerElectrical Energy Storage to Meet Evolving Aircraft Needs
by
Roger Alan Brewer
A thesis submitted to the Graduate Faculty of North Carolina State University
in partial fulfillment of the requirements for the Degree of
Master of Science
Electrical Engineering
Raleigh, North Carolina
2014
APPROVED BY:
____________________ ______________________
Dr. Aranya Chakrabortty Dr. Mesut Bran
_______________________ Dr. Subhashish Bhattacharya
Biography
Roger Alan Brewer’s life started in the state of Illinois in August 1965, the son of a carpenter.
Wonderfully blessed with a loving family, he loved learning and exploring outside and being with
family as a child and throughout the early years of his life up through high school. Baseball and
baseball card collecting were among his favorite hobbies although he quickly realized the unique
value and opportunities a great education could offer. As he continued to mature, he had always
admired and respected one of the dear, close friends of his family Dr. Wayne Lichtenberger. Dr.
Lichtenberger had graduated from the University of Illinois with his Undergraduate degree, Master’s
degree and his PhD in Electrical Engineering many years prior to Roger’s childhood. Dr.
Lichtenberger held a tremendous amount of respect within the Electrical Engineering community,
both at Illinois and also at the University of California-Berkeley and the University of Hawaii where he
subsequently held teaching and research positions after leaving Illinois.
As Roger graduated high school, his earlier childhood dream of becoming a professional baseball
player continued to give way to what was becoming what he considered a more realistic but yet highly
noble and honorable vision of becoming an Electrical Engineer. Finally, after four years of study at
the University of Illinois preceded by two years of prerequisite courses at a local Junior College, he
completed his Bachelor of Science Degree in Electrical Engineering in 1989.
Now eager to begin his professional career in the engineering world and earn a much needed steady
salary, Roger entered the workforce. Months of being a working, Electrical Engineer quickly became
years and were accompanied by the joys of marriage, raising children and a career filled with mostly
ups but some downs. Roger realized it was time to return to his passion of academics convinced of
its unparalleled value. After many encounters in the working world there was no doubt in his mind
those with more education were, at least in many cases, more satisfied with fulfilling and challenging
work.
Upon being accepted at North Carolina State University, Roger embarked on a new journey. This
journey would prove to be a challenging one as he struggled to balance work, family and school.
However, with the tremendous support of family and many prayers he is reaching the end of his
graduate school journey but with the striking realization he would not trade the journey struggle of
Acknowledgements
Some of the research in this paper was made possible by funding under the F-35 JSRI EAU
Inter-Work Transfer Agreement (IWTA) #14467 with the lab demonstration (for Battery Cold-Start assist
evaluations) made possible under C-5 Systems Improvements Project Id 414-D1-540 funds.
I would like to thank the Evans Capacitor (Mr. Dave Evans), JSR Micro (Mr. Jeff Myron) and Qynergy
(Dr. Viswanath Krishnamoorthy) companies and Mr. David Findley (Lockheed Martin Aeronautical
Systems) for approval in sharing their technology summaries and key technical inputs. I would also
like to thank Mr. Art Schuetze and Mr. Lee Jenderko, my colleagues at Lockheed Martin Aeronautical
Systems-Fort Worth Texas, for key contributions and input in the ultracapacitor peak load testing and
their many other technical contributions over these past years. I have learned immensely from both
of these colleagues during my career at Lockheed Martin. I would also like to extend thanks to my
Senior Manager at Lockheed Martin, Hal Morrison, for his review of my initial data for public release
suitability as well as, again, Mr. Schuetze and Curt Chankaya (again with Lockheed Martin). I thank
the Lockheed Martin Aeronautical Systems-Marietta Georgia Flight Line Electronics Lab, specifically
Roger Somerville, for the exceptional and timely support of the lithium-ion ultracapacitor testing (with
the Nickel Cadmium cell) under demanding other time constraints at the time of test.
I extend my special gratitude to Dr. Subhashish Bhattacharya at North Carolina State University for
overseeing my work, for without his oversight and assistance none of this would have been possible.
I extend my thanks to both Dr. Mesut Baran and Dr. Aranya Chakrabortty, also both at North Carolina
State University, for agreeing to co-chair my Thesis and their flexibility in attending my final oral
defense.
Last, but certainly not least, I would like to thank my beautiful wife Stenelle Brewer and my daughter
Sarah Brewer for their unwavering support throughout my entire graduate program and for helping
me to overcome my own personal challenges during a period of transition in all of our lives. I also
thank both of my dogs, Kiwii and Crème Brule, for their excitement and enthusiasm on all those jogs
where I needed to air out my mind from a long afternoon of studying. I love you all! I thank God for
Table of Contents
List of Tables ... v
List of Figures ... vi
List of Symbols ... vii
List of Symbols (Cont.) ... viii
Chapter 1: General System Considerations and Discussion ... 1
1.1 Other Advanced System Considerations ... 2
Chapter 2: Capacitor Technology ... 4
2.1 Modelling UltraCapacitor Devices Literature Survey ... 7
2.2 Technology Comparisons ... 8
2.2.1 Electric Double Layer (Ultracapacitors) ... 11
2.2.2 Hybrid “asymmetric” Ultracapacitors ... 12
2.2.3 Lithium ion Ultracapacitors ... 14
2.2.4 Hybrid Tantalum capacitors ... 15
Chapter 3: Application Studies ... 16
3.1 Application #1 - Simulation of Ultracapacitor in Parallel with Battery ... 16
3.1.1 Overview... 16
3.1.2 Simulation Results ... 20
3.1.3 Simulation Conclusion ... 23
3.1.4 Lab Demonstration ... 24
3.1.5 Technology Roadmap for Ultracapacitor as Electric-Start Assist Device ... 26
3.2 Application Study #2 – Peak Load Assist with Capacitance ... 26
3.2.1 Overview... 26
3.2.2 Simulation ... 27
3.2.3 Simulation Conclusion ... 29
3.2.4 Lab Testing ... 30
3.2.5 Technology Roadmap for Peak Load Assist - Ultracap as a Baseline ... 32
Chapter 4: Summary ... 33
4.1 Follow-On Activity ... 35
References ... 37
References (Cont.) ... 38
Appendix ... 39
List of Tables
Table 2-1: Capacitor Technology Comparison ... 11
Table 3-1: Boost Capacitance characteristics for Simulation ... 19
Table 3-2: Battery Assist Simulation Results ... 20
Table 3-3: System Voltage Comparisons for Battery Start Assist ... 23
Table 3-3 (Cont.): System Voltage Comparisons for Battery Start Assist ... 24
Table 3-4: Ultracapacitor Technology Resistance Comparisons... 33
List of Figures
Figure 1-1: Energy Storage Throughout the Applications……….……….1
Figure 1-1 (Cont.): Energy Storage Throughout the Applications ... 2
Figure 1-2: Aircraft APU Electric-Start Characteristic ... 2
Figure 1-3: Weapon Rapid Turn-on Profile ... 3
Figure 1-4: Hybrid Vehicle Parallels ... 3
Figure 2-1: Parallel Plate Capacitor ... 6
Figure 2-2: Electric Double Layer Capacitor Structure ... 6
Figure 2-3: Energy and Power Relationships ... 7
Figure 2-4: Electrical Circuit Models of Ultracapacitors ... 8
Figure 2-5: Energy Storage Ragone Plot ... 9
Figure 2-6: Energy Storage Ragone Plot (expanded) ... 10
Figure 2-7: Electric Double Layer Anatomy ... 12
Figure 2-8: QynCap Anatomy ... 13
Figure 2-9: Hybrid Cell Characteristics ... 13
Figure 2-10: QynCap Cell Structure and Prototype ... 14
Figure 2-11: Lithium Ion Capacitor Characteristics ... 14
Figure 2-12: Hybrid Tantalum Cell ... 15
Figure 2-13: Hybrid Tantalum Package ... 16
Figure 3-1: Ultracapacitor in parallel with Battery Simulation Circuit……….…….………...17
Figure 3-2: Simulation Results (Battery Voltage) ... 21
Figure 3-3: Simulation Results (Battery Peak Current) ... 22
Figure 3-4: Lithium Ion Supercapacitor Test Cell ... 25
Figure 3-5: Battery voltage “sag” tests (Before and after LIC in parallel) ... 26
Figure 3-6: Peak Load Buffering LT Spice IV Simulation Circuit ... 27
Figure 3-7: LT Spice IV Simulation Results - 30 µF Low Boost Capacitance with Constant Power
Load ... 28
Figure 3-8: LT Spice IV Simulation Results – 2.9F Boost Capacitance with Constant Power Load .. 29
Figure 3-9: Step Load Initial Test Layout Concept ... 30
Figure 3-10: Step Load Testing with 40-amp load ... 31
Figure 3-11: Step Load Testing with 200-amp load ... 32
Figure A-1: Generator Stability Study Model ... 41
List of Symbols
awg Gage
AWG Gage
A ≡Area
AHr Amp Hours
AC Alternating Current
APU Auxiliary Power Unit
BoostCap Boost Capacitance
C degrees Celsius
C ≡Capacitance
d ≡distance between capacitor plates
DC Direct Current
DOD Depth of Discharge
ε
≡permittivityemf electromotive force
esl equivalent series inductance
esr equivalent series resistance
E ≡Electric Field strength
EDLC Electric Double Layer Capacitor
EESU Electrical-Energy-Storage-Unit
fGMC femto Giant Magneto Capacitance
F Farad, Farads
F degrees Fahrenheit
H Hydrogen
Hz Hertz
I ≡Current
JSRI Joint Strategic Research Initiative
k kilo
kg kilograms
kW kilo Watts
LIC Lithium Ion Supercapacitor
Li Ion Lithium Ion
m milli
List of Symbols (Cont.)
Ni Nickel
O Oxygen
P ≡Power
PCB Printed Circuit Board
PHC preceramic polymer poly (hydridocarbyne)
PWB Printed Wiring Board
sec seconds
secs seconds
SOC State of Charge
Ta Tantalum
U ≡Stored Energy
V Volts
VAC Volts Alternating Current
VDC Volts Direct Current
W Watts
Whr Watt Hours
Whrs Watt Hours
High energy Battery as a stand-alone
starting supply
Battery in parallel with a Capacitor for improved low temp. performance
Battery Starter Charger/ Controller Battery Starter Charger/ Controller .. Start Bus Start Bus Electrochemical Storage
Chapter 1: General System Considerations and Discussion
In applications where large transient electrical loading demands are placed on electrochemical
batteries traditionally used in military vehicles such as modern aircraft, ground vehicles and other
platforms, batteries experience a high degree of induced stress. Specifically, the stress a battery
might experience is pronounced under conditions where vehicles may be operating under extreme
temperature conditions, such as providing “cold-cranking” power to a starter motor at the onset of
startup. Since electrochemical batteries store and deliver power involving chemical reactions (versus
“electrostatically” as in the case of capacitors) a tremendous amount of internal heating with electrode
material expansion and contraction results throughout a complete charge/discharge cycle (Reference
1).
As the chemically based constraints are coupled with the higher resistance associated with the liquid
based battery electrolytes (with resistance inversely proportional to temperature), a high induced
stress mechanism is established. Experience in the
field has indeed shown that battery maintenance
intervals (and potential battery replacement) on
the order of 120 day cycles are possible for
military aircraft and perhaps even shorter for high
end use commercial airliners. In cases where
a minimum voltage must be maintained to a
starter motor, a battery system may also need to
be oversized (more cells in series) to meet
voltage capability requirements and/or oversized
to handle the peak power required. Batteries alone
may not be optimum to meet these requirements with some
varieties more inefficient in terms of peak power delivery.
Figure 1-1 to the right and below illustrates concepts involving various
forms of energy storage utilization in system design. The decaying
exponential characteristics of a typical aircraft Auxiliary Power Unit
(APU) Starter Motor is also provided in figure 1-2 below although not specific to any configuration. Figure 1-1: Energy Storage
Am
p
s
Time (seconds)
… 3 of these attempts allowed in a 5 minute period
Conceptual Supercapacitor Bank as a stand-alone Flight computer supply
28VDC Essential Avionics Bus Primary
Supply
..
Flight Computer
Cell Balancing and isolation to bus
control
Electric Double
Layer Storage
Figure 1-1 (Cont.): Energy Storage Throughout the Applications
Figure 1-2: Aircraft APU Electric-Start Characteristic
1.1 Other Advanced System Considerations
In addition to the potential system applications involving electric-start assist, other advanced
applications for future aircraft may include needs for a tremendous amount of peak power to support
rapid turn-on loads where typical generator (or possibly even more likely the driving turbine) response
Other applications may involve the ability to “sink” large amounts of “back-emf” (or regenerative
energy, i.e. “regen”) and potentially use the regen as a recharge source to optimize overall vehicle
efficiency. A comparison to such issues being explored and matured in the hybrid vehicle industry is
provided in Figure 1-4.
Figure 1-3: Weapon Rapid Turn-on Profile
Figure 1-4: Hybrid Vehicle Parallels
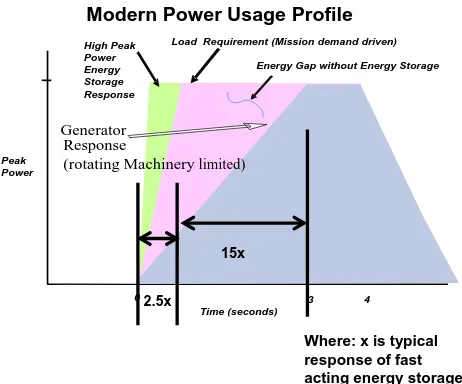
Modern Power Usage Profile
Generator Response Generator
Peak
0 3 4
Load Requirement (Mission demand driven)
Peak Power
Energy Gap without Energy Storage High Peak Power Energy Storage Response Time (seconds) Response
(rotating Machinery limited)
2.5x
15x
Where: x is typical response of fast acting energy storage
●More Electric Vehicle challenges are not unlike those of the Hybrid Vehicle industry
– High levels of regenerative energy during vehicle braking parallels flight control motor braking although …
Energy levels differ – Recaptured energy allows Hybrid
Vehicle to propel without Internal Combustion Engine
– Hybrid and More Electric Aircraft architectures are driving specific energy and power density improvements of energy storage components
AC
During braking “regen” fed back to Battery Controller creates Alternating
field from Battery DC to turn Motor (PWM, etc)
Lithium Ion or Nickel Metal Hydride Battery technology Gen Battery .. . Flight Controls Charger/Controller Regen
Peak Power supply
In summary, many of the key aspects that are researched in any energy storage technology for
evolving or existing applications can be summarized as follows:
• High energy density (kJoules per pound and per in3)
• High peak power density (kWatts per pound and per in3) or even more appropriately low
equivalent series resistance with a target of: high vcell rating/esr ratio
• Safety (no hazardous material “outgassing” on overcharge)
• Charge/discharge efficiency (minimal loss between charge/discharge as waste heat)
• Regenerative energy absorption (ability to absorb regen without degradation, outgassing,
etc.)
• Packaging robustness (does the packaging approach optimize peak power performance,
minimize voids and maintain thermal integrity)
• Aircraft environment (survive thermal, vibration, humidity)
• Technology maturity (can the technology be readily fielded if required or are there significant
technology hurdles)
• Total Cost ($/kWhr and $/kW)
• Could the technology be a “game changer?
Chapter 2: Capacitor Technology
With an overview of the system needs for energy storage established it is appropriate to review the
foundational equations governing energy storage and explore how this is applied to the approaches
being undertaken by the various developers in the field.
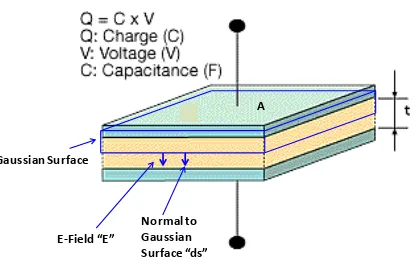
The equation governing the amount of stored energy that can be achieved in any capacitor
technology (or “electrostatic” device) is as follows (with U=stored energy, V=Capacitor Breakdown
Voltage and C=Capacitance):
(2.1) U=1/2* C*V2
Where:
(2.2) C=
ε
*A/dWith: A=Area of the capacitor plates
ε
= relative permittivity of the dielectricε
r x permittivity of free spaceε
0(ε0=8.85418782x10 -12
Farads/meter) and where ε0 is also defined as ε0=1/µ0c 2
(c=speed of
light in a classical vacuum and µ0 is defined as the magnetic constant or 4π x10 -7
)
In Equation (2.1) above, the expression for stored energy has been derived from the work performed
to establish the Electric Field “E” across the parallel plate structure shown in figure 2-1. Work,
defined as the total to assemble stored charges, can be written in the integral form for distributed
charges as follows:
Using relations: ρv = .D and E= - .D it can be shown that:
(2.4)
In arriving at Equation (2.4) above from Equation (2.3), Maxwell’s equation in point form has been
applied or: (2.5) ρ = .D = Q=
ε
*E*A (where the divergence theorem has been applied to theelectric flux density D) along with the substitution: (2.6) V= - ∫ E-dl = -Ed (from the definition of electric potential across distance “d” derived from Coulomb’s Law with the potential difference defined as the
amount of work to move a unit charge from A-B or VA-B = WA-B/Q). Finally, total Stored Energy
becomes:
U=1/2 ∫
ε
*E*A*(-Ed)=1/2*ε
E2Ad from substituting (2.5) and (2.6) above, integration across the platedistance d and pulling out the constant terms
ε,
E and A.In Equation (2.2) above, the expression for basic capacitance C=Q/V is combined from Gauss’s Law
to arrive at:
(2.7) Q=
ε
*E*A with the Electric Field defined as normal to the Gaussian surface of a parallelplate with ds (differential surface area element) also normal to the same surface (dot
product or cosine of angle between the two =1). Field fringing has been neglected in
deriving this equation
(See Reference 8 for above equation and discussion) ρvVdv
U=1/2
∫
(2.3)At the atomic level, this structure is equivalent to the parallel plate capacitor
Figure 2-1 below defines the Gaussian surface (in blue) across a conventional parallel plate structure
used to derive Equation (2.7) and the Electric Field “E” to establish Equation (2.6) above.
Figure 2-1: Parallel Plate Capacitor
From Equations (2.1) and (2.2) it can be seen that to maximize the amount of stored energy (also
proportional to capacitance) “A” must increase while “d” must decrease. This is the essential element
of ultracapacitor design where an extremely small separation distance “d” (at the atomic level) is
achieved with highly porous carbon electrodes to achieve high “A” as compared to traditional
capacitors.
Figure 2-2 below provides a typical cross-sectional view of an ultracapacitor (taken from Reference 5)
where the basic electric double layer structure separating the positive and negative charges in
principle corresponds to the parallel plate structure shown in figure 2-1 above.
Figure 2-2: Electric Double Layer Capacitor Structure
A
Gaussian Surface
E-Field “E” Normal to Gaussian Surface “ds”
Other capacitor innovations involve increasing V to impact a higher stored energy “U” although, as
will be shown in the “Technology Comparison” Section below, with less success.
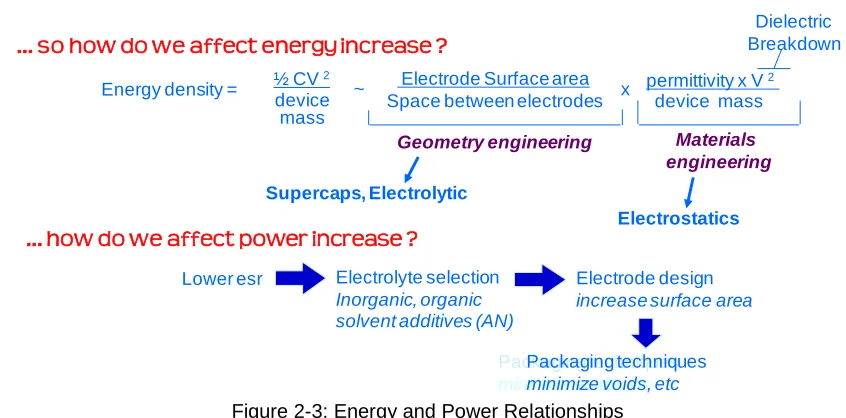
A summary of the discussion above with relevant relationships is provided in Figure2-3 below.
Figure 2-3: Energy and Power Relationships
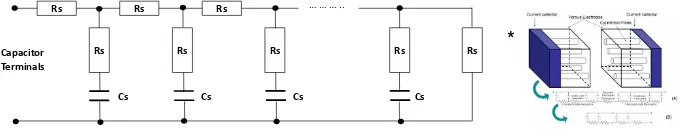
2.1 Modelling UltraCapacitor Devices Literature Survey
Various literature exists discussing detailed and equivalent circuit models of ultracapacitor
technology. One such paper (Reference 11) highlights the nonlinear effects (in relation to operating
voltage) and RC time constant nature of ultracapacitors for a truly representative circuit model. More
specifically, ultracapacitors have been described most completely as an RC ladder network (or
transmission line model) in various literature including References 12 and 13. This affect has been
discussed as related to the highly porous structure of the electrodes and heavily influenced by the
charge transport process and groupings represented by an equivalent pore electrolyte resistance and
interfacial double layer capacitance. Figure 2-4 illustrates the RC transmission line model given in
the literature.
½ CV 2 Electrode Surface area
Space between electrodes
… so how do we affect energy increase ?
permittivity x V 2
Geometry engineering Materials engineering
Supercaps, Electrolytic
Electrostatics
Dielectric Breakdown
… how do we affect power increase ?
Lower esr Electrolyte selection
Inorganic, organic solvent additives (AN)
Electrode design
increase surface area
Packaging techniques
minimize voids, etc
device
mass device mass
x ~
Energy density =
Packaging techniques
Figure 2-4: Electrical Circuit Models of Ultracapacitors
Further work in the area of modeling more detailed voltage dependent non-linear effects of
ultracapacitors in the application studies has been highlighted in the Follow-On Activity (Chapter 4.1)
although modeling the BoostCap as a basic RC ladder network component was successful and
compared very closely to the results demonstrated in Application #1 (Chapter 3.1) where the
BoostCap was represented as a basic series/capacitor element in Simulink.
2.2 Technology Comparisons
While no one technology may simultaneously meet many of the desired characteristics for a given
application, certain technologies when reviewed on a case by case basis might be considered more
optimum than others.
When selecting a technology, as has been pointed out in energy storage conferences and related
electrochemical capacitor papers (References 3 and 6), energy and peak power density terms should
be considered highly dependent on rate of charge/discharge and temperature. Therefore, in referring
to these “density” terms and the general values published from vendors, attention is required.
Technologies driven by achieving higher “V” (as mentioned in the previous section) do tend to
achieve much higher power density since instantaneous power is dominated by P=I*V (current *
voltage). As was also shown in the presentation by Dr. John Miller (Reference 6) and others,
measuring and ascertaining peak power density for any technology is highly dependent on the
particular method used (i.e. “matched load” response) with energy density also influenced by other
factors including temperature and discharge rate.
Given the above considerations, the “Ragone” chart in figure 2-5 below provides side by side
published specific power and energy densities for various technologies. Where peak power and high
voltage is required, ceramic capacitors, film capacitors, hybrid tantalums and other material
Rs Rs Rs
Rs Rs Rs Rs Rs
Cs Cs Cs Cs
… … … ..
Capacitor Terminals
*Porous electrode and RC ladder network model from Reference 13
development technologies seeking improved breakdown voltage (as given in Equation (2.4)) may be
optimal. Conversely, a higher level of energy storage for lower voltage applications may be optimally
derived from electric double layer capacitors (or supercapacitors). Finally, higher energy can be
obtained from battery (electrochemical) storage although, as shown in the expanded view in figure
2-6
,
some battery technologies appear to be successfully expanding peak power capability. Not included in the figures are impacts associated with cell monitoring electronics and conditioning and isa low to moderate impact for primarily lithium-ion and nickel-cadmium batteries. Fuel Cells (if they
are indeed considered a form of “energy storage”), which rely on a continuous fuel supply (an
oxidant), can achieve very high levels of energy density.
Far less mature technology development is seeking orders of magnitude increases in both peak
power and energy such as Magnetic Capacitors and Metal-Air Batteries as shown in figure 2-5.
Figure 2-5: Energy Storage Ragone Plot Theoretical Specific Energy
(Whr/kg) S p eci fi c P o w er (kW /kg )
200 400 600 800 1000 1200 1400 1600 1800 2000 3000
2000 100 200 300 400 500 Electrolytic Capacitor Anti-ferroelectric Ceramic Capacitor 2200 Magnetic Capacitor (fGMC = 10^16)
Magnetic Capacitor (fGMC = 10^8)
Lithium Air Battery
Fuel Cell EESU
(includes DC-DC Conversion)
Li Ion Capacitor ELDC Supercap
Li Ion Battery Hybrid Tantalum Capacitor Zinc Air Battery Near term technologies
Li Ion Battery nanowire
Next slide
Other ?? Far Term
Technology
Technology Challenges to reach Theoretical limits
TRL Level
Magnetic Capacitor 1.High, repeatable fGMC yield
2. Nano-scale manufacturing process 3
Lithium Air Battery 1. Electrode stability, protective membrane and cathode materials
2. Multiple charge/discharge capability 3
Zinc Air Battery ?? 3
EESU 1. High v oltage integration and packaging 4
Anti-ferroelectric
Figure 2-6: Energy Storage Ragone Plot (expanded)
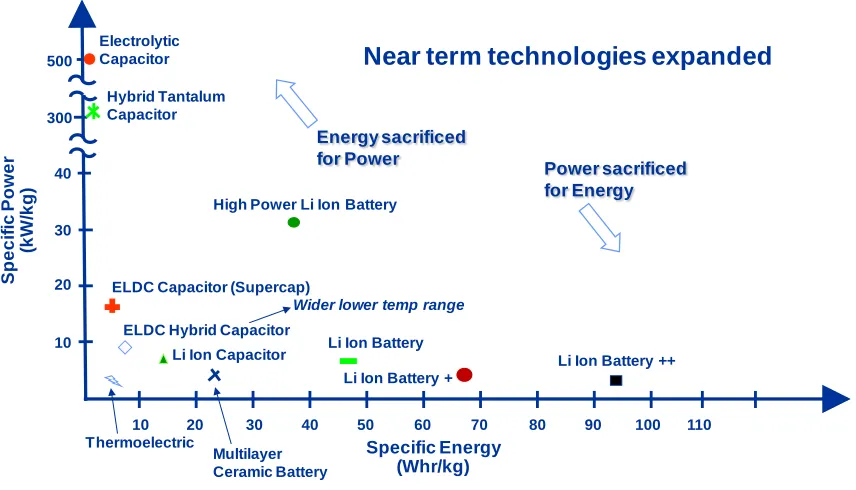
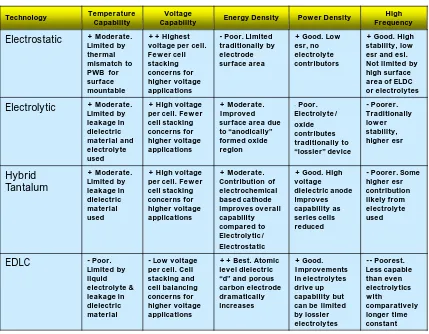
Table 2-1 below provides another comparative breakdown among capacitor technologies and
includes frequency and temperature capability as an additional attribute for comparison. In general,
due to the larger time constant associated with “shuttling” charges across the porous structure of
ultracapacitors, their time constant and thus associated frequency response is poorer. Also, most
capacitors take temperature capability hits due to either their: a) associated grown oxide material (in
the case of electrolytic and hybrid tantalums), b) thermal fatigue characteristics (in the case of a
ceramic capacitor surface board mounted design) or c) liquid based electrolyte (in the case of the
ultracapacitor technology). In general, it can also be stated any capacitor utilizing a grown oxide as
its dielectric medium is limited in temperature capability due to oxide leakage at elevated
temperature. Many of these comparisons came with input from capacitor developers (reference
Acknowledgements section). Specific Energy (Whr/kg) S p eci fi c P o w er (kW /kg ) 50 100 300
Li Ion Capacitor ELDC Capacitor (Supercap)
Li Ion Battery 40
30
20
10
Li Ion Battery + High Power Li Ion Battery
Near term technologies expanded
10 20 30 40 60 70 80 90 110
Li Ion Battery ++ 500
Electrolytic Capacitor
Hybrid Tantalum Capacitor
ELDC Hybrid Capacitor
Table 2-1: Capacitor Technology Comparison
An overview (although not exhaustive) of some specific later generation capacitor technologies is now
provided.
2.2.1 Electric Double Layer (Ultracapacitors)
Electric Double Layer ultracapacitors make use of two layers of separated charge at the atomic level
(by a distance “d”) to accomplish a high capacitance according to the equation that relates charge
storage capability inversely to the distance “d” between two parallel plates. Additionally,
ultracapacitors utilize two “symmetric” porous electrodes to increase the effective surface area
between the separated charge plates further increasing available energy storage capability
(according to the direct relationship between surface area and charge storage capability).
A liquid electrolyte, or mobilizing medium for ions, is contained within the capacitor structure and is
Technology Temperature Capability CapabilityVoltage Energy Density Power Density FrequencyHigh
Electrostatic + Moderate. Limited by thermal mismatch to PWB for surface mountable
++ Highest voltage per cell. Fewer cell stacking concerns for higher voltage applications
- Poor. Limited traditionally by electrode surface area
+ Good. Low esr, no electrolyte contributors
+ Good. High stability, low esr and esl. Not limited by high surface area of ELDC or electrolytes
Electrolytic + Moderate. Limited by leakage in dielectric material and electrolyte used
+ High voltage per cell. Fewer cell stacking concerns for higher voltage applications + Moderate. Improved surface area due to “anodically” formed oxide region -Poor. Electrolyte/ oxide contributes traditionally to “lossier” device - Poorer. Traditionally lower stability, higher esr Hybrid Tantalum + Moderate. Limited by leakage in dielectric material used
+ High voltage per cell. Fewer cell stacking concerns for higher voltage applications + Moderate. Contribution of electrochemical based cathode improves overall capability compared to Electrolytic/ Electrostatic
+ Good. High voltage dielectric anode improves capability as series cells reduced
- Poorer. Some higher esr contribution likely from electrolyte used
EDLC - Poor.
Limited by liquid electrolyte & leakage in dielectric material
- Low voltage per cell. Cell stacking and cell balancing concerns for higher voltage applications
typically either organic or aqueous. Organic electrolytes typically allow for higher breakdown
capability (voltage per cell 2.3V-2.8V) at the sacrifice of: a) safety (lower flash point temperature), b)
low temperature capability and c) higher resistance. Aqueous electrolytes sacrifice the higher
breakdown capability (voltage per cell ~ 1.23V) but with improved safety, low temperature
performance and reduced resistance.
An inherent disadvantage associated with most traditional ultracapacitors is their low voltage
capability per cell. This is a result of the small atomic scale separation distance “d” described above.
Specifically, the benefits of grown dielectrics associated with traditional electrolytic capacitors
(providing increased voltage capability per cell) or high dielectric ceramics is not achieved with
ultracapacitor technology. Other advantages distinct to traditional capacitors are maintained with
ultracapacitor technology, such as fast recharge/discharge rate, high efficiency (little lost energy
throughout the charge/discharge cycle), high power density (kW/kg) and improved low/high
temperature performance capability as compared to some battery technologies. Power densities on
the order of 18kW/kg and energy densities on the order of 5Wh/kg or more are predicted for the
symmetric technologies among the various developers. Figure 2-7 below provides a top level
illustration of the Electric Double Layer concept and anatomy (taken from Reference 13).
Figure 2-7: Electric Double Layer Anatomy
2.2.2 Hybrid “asymmetric” Ultracapacitors
The principle behind hybrid, or “asymmetric” ultracapacitors, includes the integration of a more
traditional ultracapacitor (electric double layer type) electrode with a “battery-like” electrode structured
associated with symmetrical ultracapacitors while improving energy (Whrs) providing benefits into a
single device.
One such concept, the QynCap cell of Qynergy as shown in figure 2-8 below, makes use of a NiOH2
(higher energy providing cathode) based battery electrode and a traditional Double Layer activated
Carbon Capacitor (higher peak power providing anode) electrode. Power densities on the order of
1-10kW/kg and energy densities on the order of 5 – 10 Wh/kg are predicted for the QynCap cell. An
aqueous electrolyte is used to improve low temperature performance.
Figure 2-8: QynCap Anatomy
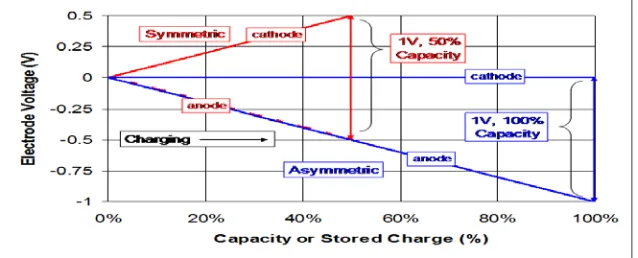
An additional illustration providing insight into the energy extraction benefits of the QynCap cell is
provided in figure 2-9 below. As can be seen, since the battery electrode (electrochemical based
cathode) voltage changes very little in comparison to the capacitor electrode (anode) voltage during
discharge, a higher overall charge can be extracted since voltage differential change (or “U” in
Equation (2.1)) is larger.
Positive End
Outer Cylinder Individual Button Cells (Stacked)
Negative End
Figure 2-10 below provides a cutaway illustration view of a typical QynCap cell as well as a prototype
QynCap cell.
Figure 2-10: QynCap Cell Structure and Prototype
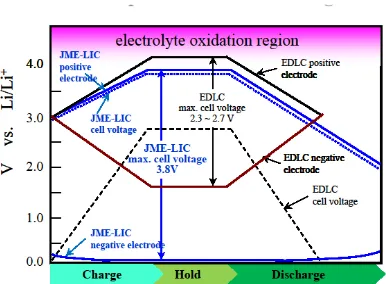
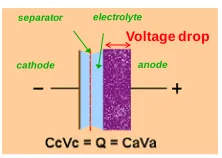
2.2.3 Lithium ion Ultracapacitors
The Lithium Ion Capacitor (LIC) can be considered another form of an “asymmetric” ultracapacitor.
Lithium is used as a dopant on one of the electrodes (anode) with the cathode electrode similar in
nature to a typical symmetric ultracapacitor consisting of activated carbon. The doping on the
structure’s anode electrode has the effect of lowering its potential (in relation to the cathode) resulting
in an overall higher voltage per cell device (see figure 2-11 below) resulting in higher “U” (see
Equation (2.1)).
separator electrolyte
anode cathode
Voltage drop
–
The combined affect is a device with improved energy density, self-discharge and voltage per cell
capability over conventional “symmetric” ultracapacitors while also improving (or at least competitive
with) the power density (kW/kg) offered from batteries. Other benefits of conventional capacitor
technology might conceivably be retained with the lithium ion capacitor including robust
charge/discharge C-rates and high temperature operation capability.
The typical energy density of LIC cells are currently 12Whr/kg with a cell voltage of 3.8V nominal.
Dramatic reduction (70%) of DC-IR in the Gen 2 cells have improved efficiency at high currents and
cold temperature performance. Gen3 cells will have much improved energy density.
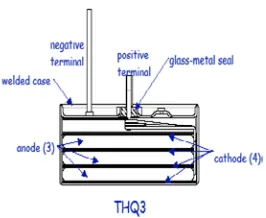
2.2.4 Hybrid Tantalum capacitors
The hybrid tantalum capacitor approach, developed by Evans Capacitor, makes use of an
electrochemical type electrode for the cathode and a tantalum anode formed dielectric (Ta2O5) for
enhanced voltage withstanding capability.
With the hybrid tantalum technology (as shown in figure 2-12 below) a large portion of the
voltage potential across the capacitor structure is dropped across the more robust anode formed
dielectric with enhanced stored charge capability provided at the “electrochemical like” cathode
surface. Charge balance is maintained across the entire structure.
Figure 2-12: Hybrid Tantalum Cell
Another aspect of the Evans tantalum hybrid device is related to the packaging approach. A thin, flat
package tends to minimize electrical resistance while maximizing heat dissipation (and surface area)
thereby increasing the device’s peak power capability. The hybrid capacitor package is shown in
Figure 2-13: Hybrid Tantalum Package
As with the other forms of hybrid capacitors, the technology seeks to combine both higher voltage per
cell and power capability with some degree of higher energy storage capability. While the projected
energy targets of this technology (< 5 Whr/kg) do not rival that of ultracapacitors, there are strong
indications its specific energy surpasses that of conventional electrolytic or ceramic capacitors with
similar frequency response and may be useful in certain pulse power applications.
Chapter 3: Application Studies
3.1 Application #1 - Simulation of Ultracapacitor in Parallel with Battery
3.1.1 Overview
Simulink (Sim Power Systems toolset) was used as the demonstration tool to explore the potential
benefits of varying capacitance values (hereafter referred to as “BoostCap”) in parallel with a battery
Continuous pow ergui v + -Va
T imer 4
T imer 3 T imer 2
T imer 1
Series RLC Load2
Scope 3 Scope 2 Scope 1 Rline3 30mohms Rline2 60mohms Rline1 30mohms R5 R4 R3 R2 R1 g 1 2 Ideal Switch3 g 1 2 Ideal Switch2 g 1 2 Ideal Switch1 g 1 2 Ideal Switch i + -Id2 i + -Id1 i + -Id Ef=500 V Demux TL m A+ F+ A- F-dc DC_Motor Load 1 100 hp; 500V; 16.2 A; 1750rpm
DC Current Source BoostCap + _ m Battery <Voltage (V)> <Voltage (V)> <Voltage (V)> Armature Voltage <SOC (%)>
Battery Current
Parallel Boost Cap Current
Dummy Source Current
Motor Speed Motor Torque
Switch for
connecting
motor load
Switch for
connecting
BoostCap
Switch for
connecting
BoostCap
test current –not
connected in final sim
Battery supply
BoostCap supply
Built in tools available with the standard Sim Power Systems package were utilized in developing the
model, such as a Nickel Metal Hydride Battery and built in capacitor components. Resistances were
included in series with each of the primary components, specifically a resistance was included in
series with the BoostCap to model the capacitor’s packaging and internal resistance with variations
noted through the simulation.
A 220V nominal battery voltage was assumed to start a 100horsepower DC Motor as well as a
resistance in series with the Battery to simulate packaging resistance (approximated as 100 mohms).
In modeling the BoostCap, a 3,000 F single cell ultracapacitor was initially assumed (typical of a
product available from Maxwell). Since a nominal 220V was to be obtained to match the battery and
ultracapacitor cells are typically on the order of 2.3~2.8 V/cell nominal, approximately 92 cells in
series were needed (92 cells x 2.4V/cell derated=~221V). This cuts down the total BoostCap “Ceq” in
turn that should be modeled according to the equation:
(3.1) 1/Ceq=1/C1+1/C2+ … {BoostCap equivalent Capacitance}
The total Ceq was found to be ~33F. With the equivalent series resistance (esr) given for a typical
3,000 F cell of 0.29 mohms (Reference 2), the total esr would be (including a 1.3 packaging factor)
34.68mohms (or 0.29 mohms*92*1.3). This is the value of esr included with the BoostCap for the
simulation. For other values of capacitance a total of 92 cells in series was again used to reach the
nominal system voltage with the corresponding combined esr adjusted and Ceq again calculated as
above. The corresponding values of capacitance (in F) used from the Maxwell data were
subsequently as follows (with Ceq recomputed):
2000, 1500, 1200, 650, 350
For the remaining values of capacitance (Ceq = 0.111F and 0.005F) a Vishay Aluminum Electrolytic
25V 101/102 PHR-ST 1F and 0.047F cells were used with an esr of 5 mohms and 12 mohms for
comparison (Reference 4). In this case, the total esr was calculated as 58.5 mohms and 140.4
mohms respectively (9 cells*5 mohm*1.3 and 9 cells*12 mohm*1.3) for a nominal initial capacitor
voltage of 225V.
A second data series (series #2) was then simulated assuming a 20% reduction in esr per cell could
improvement is seen (3-10V battery voltage sag improvement in the range of 3.8-30F BoostCap
added).
A final data series (series #3) was simulated assuming cold temperature (i.e. less than 0 degrees
Celsius) operation. In performing this simulation, a 2x nominal room temperature internal resistance
was assumed for the Nickel Metal Hydride Battery (0.6 ohms or 2x0.3 ohms) and a 1.3x nominal
room temperature internal resistance was assumed for the BoostCap.
Table 3-1 below provides a complete summary of the equivalent series resistance (Req) calculated
for each of the Ceq cases evaluated above during the simulation. The corresponding individual cell
resistances are included (Rcell) and, finally, the associated values for the 20% esr reduction and cold
temperature series #2 and #3 are included.
Table 3-1: Boost Capacitance characteristics for Simulation
Series #1 Series #2 Series #3
Nominal
Temperature 20% Rcell reduction
< 0 deg. C Temperature
Ccell
(F) Ceq (F)
Weight (lbs.) Rcell (mohms) Req (mohms) (4) Rcell (mohms) 0.8x nominal Req (mohms) (4) Rcell (mohms) 1.3x nominal Req (mohms) (4)
3000 32.6 103 0.29 34.68 0.232 27.75 0.38 45.1
2000 21.7 73 0.35 41.86 0.28 33.49 0.45 54.4
1500 16.3 57 0.47 56.2 0.37 44.97 0.61 73.1
1200 13.0 53 0.58 69.4 0.46 55.49 0.75 90.2
650 7.1 32 0.80 95.68 0.64 76.54 1.04 124.4
350 3.8 13 3.2 382.72 2.56 306.17 4.16 497.5
1 0.111(3) 5 58.5 4.0 46.8 6.5 76.05
0.047 0.005(3) 12 140.4 9.60 112.32 15.6 182.52
Notes:
(1) Assumes 92 ultracapacitor cells in series
(2) Battery internal resistance 0.3 ohms (nominal temperature condition) assumed for Series #1 and #2 and 0.6 ohms (< 0 deg. C temperature condition) assumed for Series #3
(3) Assumes 9 electrolytic cells in series (4) Includes 1.3 assumed packaging factor
3.1.2 Simulation Results
It was observed that adding BoostCap in parallel with the battery dramatically improves the amount of
voltage “sag” seen at the battery terminals on initial start-up of the DC Motor. For the initial 33F
BoostCap case, for example, a 62V improvement is seen in comparison to the case with no additional
capacitance (~148V at the battery terminal compared to 210V). It was also noted parallel
capacitance must go well below 1F (0.005F) before there are only minimal or no benefits observed.
Further, a moderate BoostCap of only 1F proves to be an added benefit in this case. It was also
interesting to note reducing the BoostCap equivalent series resistance (esr) by 20% only minimally
improves the amount of voltage boost that can be provided on start-up. The dip in the Battery voltage
minimum around 5F may be due to the BoostCap becoming a resonant load in this range. In
examining this aspect further, it was seen that in applying a 238V step load to the circuit, a linear di/dt
current rate rise of 80-amps per 0.01 sec was seen in series at the battery output. Equating this to
inductance results in 29.75mH (from V=L*di/dt) that must be present in the circuit including all effects.
3.8F of BoostCap was reconfirmed upon simulations as resulting in the most voltage dip or a
frequency resonance point of f = 0.473Hz (from ω=1/√LC and ω = 2πf).
The time for the motor to reach its peak speed was noted as approximately 0.23-0.24 seconds in
virtually all of the test runs. For the cold temperature conditions and BoostCap less than 0.111F
(including the case without BoostCap) the time for the motor to reach its peak speed was noted as
moderately higher (0.3 seconds) with a sag before reaching its maximum.
A summary of the simulation results is provided in figure 3-2 and figure 3-3 and Table 3-2 below.
Table 3-2: Battery Assist Simulation Results
With Capacitor esr given as per data sheet
Boost Cap
(Farad)
Battery min
(V)
time to peak
Motor speed (sec)
Peak Battery
Current (amps)
30
210.6
0.23
86
21.74
208.8
0.24
92
16.3
205.5
0.24
104
13.04
202.6
0.24
113
7.06
197.7
0.24
129
3.8
172.6
0.22
212
0.111
187.5
0.23
162
0.005
171.5
0.23
216
With improved Capacitor esr by 20% Boost Cap
(Farad) Battery min (V) time to peak Motor speed (sec)
30 212.5 0.23 80
21.74 211 0.24 85
16.3 208 0.24 95
13.04 205.6 0.24 103
7.06 201.1 0.24 118
3.8 176.5 0.24 200
0.111 188 0.24 161
0.005 144.5 0.24 305
Without Boost Capacitor
145.5 300
Figure 3-2: Simulation Results (Battery Voltage) 0 50 100 150 200 250
0 5 10 15 20 25 30 35
given data sheet Boost Cap esr/cell 20% improved Boost Cap esr/cell Without Boost Capacitor < 0 deg C simulated condition
<0 deg C simulated condition Without Boost Capacitor 100 horsepower DC Motor Start Profile - 100 N-m constant load torque
Notes:
1. 220 V nominal Nickel Metal Hydride Battery assumed
2. Initial Boost Capacitor voltage 250V (for Al Electrolytic) and 220V (for Ultracapacitor) 3. 50% initial Battery State of Charge assumed
Boost Capacitance Added (Farads)
Ba tte ry m in (V ol ts ) 0 50 100 150 200 250
0 0.05 0.1 0.15 0.2
given data sheet Boost Cap esr/cell 20% improved Boost Cap esr/cell Without Boost Capacitor < 0 deg C simulated condition
<0 deg C simulated condition Without Boost Capacitor 100 horsepower DC Motor Start Profile - 100 N-m constant load torque
Notes:
1. 220 V nominal Nickel Metal Hydride Battery assumed
2. Initial Boost Capacitor voltage 250V (for Al Electrolytic) and 220V (for Ultracapacitor) 3. 50% initial Battery State of Charge assumed
Boost Capacitance Added (Farads)
Ba tte ry m in (V ol ts )
Figure 3-3: Simulation Results (Battery Peak Current) 0 50 100 150 200 250 300 350
0 5 10 15 20 25 30 35
given data sheet Boost Cap esr/cell 20% improved Boost Cap esr/cell Without Boost Capacitor < 0 deg C simulated condition
<0 deg C simulated condition Without Boost Capacitor
100 horsepower DC Motor Start Profile - 100 N-m constant load torque
Notes:
1. 220 V nominal Nickel Metal Hydride Battery assumed
2. Initial Boost Capacitor voltage 250V (for Al Electrolytic) and 220V (for Ultracapacitor) 3. 50% initial Battery State of Charge assumed
Boost Capacitance Added (Farads)
Ba tt er y pe ak cur re nt (A m ps ) 0 50 100 150 200 250 300 350
0 0.02 0.04 0.06 0.08 0.1
given data sheet Boost Cap esr/cell 20% improved Boost Cap esr/cell Without Boost Capacitor < 0 deg C simulated condition
<0 deg C simulated condition Without Boost Capacitor
100 horsepower DC Motor Start Profile - 100 N-m constant load torque
Notes:
1. 220 V nominal Nickel Metal Hydride Battery assumed
2. Initial Boost Capacitor voltage 250V (for Al Electrolytic) and 220V (for Ultracapacitor) 3. 50% initial Battery State of Charge assumed
Boost Capacitance Added (Farads)
Ba tt er y pe ak cur re nt (A m ps
)
< 0.1F added BoostCap zoomed x-axis
Design Solution
Total Weight
(lbs.)
Comments
Maxwell 63F Modules,
125V rated (BMOD0063) 269
Assumes two modules in series for total Ceq=31F Vishay PHR-ST Series
3300 µF cells, 100V rated Aluminum Electrolytic
451
Assumes 909 parallel branches, 3 capacitors in each branch to achieve 1 Farad
Ultracap solution 0.596x the weight of Al Electrolytic Solution BUT 31x Capacitance
needed
3.1.3 Simulation Conclusion
It was clearly shown how adding capacitance typically attainable from ultracapacitors reduces battery
peak current (levels below 130-amps with 7 Farads of BoostCap) and may benefit overall battery
operating life as indicated in figure 3-3 above and specifically for highly repetitive APU starting
(pending further study – see Follow-On Study Section). Improvements in battery voltage “sag” were
also evident and may benefit applications with longer power feeder runs from the APU Starter to the
Battery (larger line losses) and would have even a more pronounced improvement in cold
temperature conditions. As expected, the amount of “sag” without any BoostCap is much higher at
simulated cold temperature conditions than at nominal temperature conditions (150V versus 100V).
Values of capacitance typical of ceramic, film or hybrid tantalum capacitors would likely not have
benefit in this application due to their limited energy contribution, even within the < 1 second time
range, although conceivably many parallel strings could be added for potential benefit at a larger
weight penalty.
Finally, trading various nominal system bus voltage levels would be worthwhile for the various
approaches and would likely favor ultracapacitors for lower voltage systems versus higher voltage
systems. One such attempt at a design study is provided in table 3-3 below where it can be seen
there is a higher proportionate amount of weight in higher voltage systems (220V) for an
ultracapacitor approach compared to a traditional capacitor design solution vs. a 28V system. Both
systems have assumed an equivalent overall capacitance requirement of 1 Farad similar to that
derived in the case study. Additionally, it can be seen in both systems the ultracapacitor design is
“capacitance oversized” although its overall weight is indeed smaller than a more conventional
capacitor solution for both systems.
Table 3-3: System Voltage Comparisons for Battery Start Assist
Design Solution
Total Weight
(lbs.)
Comments
Maxwell 58F Modules,
16V rated (BMOD0058) 2.78
Assumes two modules in series for total Ceq=29F Vishay Wet Tantalum 200D
Series 2400µF cells, 30V rated
115
Assumes 417 parallel branches, 1 capacitor in each branch to achieve 1 Farad
Ultracap solution 0.024x the weight of Wet Tantalum Solution BUT 29x Capacitance
needed
Table 3-3 (Cont.): System Voltage Comparisons for Battery Start Assist
28V System – 1 Farad Requirement
A more complete study would be required to assess the weight and efficiency impacts and trade the
various approaches for other voltages that might be worthy of consideration (see Follow-On Study
Section).
In summary, the following highlights the findings of the Simulation:
Improving BoostCap esr has minimal impact for this case study
Added BoostCap of 1F or more provides needed improvement
Added BoostCap greater than 5F reaches a point of diminishing return
3.1.4 Lab Demonstration
In an effort to perform a simple demonstration illustrating the potential benefit of ultracapacitors wired
directly in parallel with a battery, a single lithium ion supercapacitor (discussed in Chapter 2 section
2.3) 3,000F cell sample was used in combination with two Nickel Cadmium (NiCad) battery cells
placed in series. The LIC cell was provided courtesy of JSR Micro and the battery cells were spares
available from the Lockheed Martin Aeronautics Flight Line (C-5 Galaxy Modernization configuration)
Figure 3-4: Lithium Ion Supercapacitor Test Cell
Since the nominal NiCad per cell voltage is approximately 1.2V, it was projected two in series would
be required to match the nominal voltage of a single LIC cell (3.8V maximum) assuming a partially
discharged state. The intent of the test setup was to evenly match voltage of the two NiCad cells in
series to that of the single LIC cell to prevent current “bleeding” from one device into the other just
prior to application of the load. In a more typical system design, control electronics could be
implemented to perform this function more dynamically and precisely but was outside the scope of
this simple demonstration.
Prior to applying the load the voltage on the LIC cell was noted as approximately 3.0V upon
measurement (with an oscilloscope) indicating the cell was in a partial state of charge after being
stored in the lab for approximately 3 months. The LIC cell was then charged with a constant voltage,
constant current power supply to 3.7V and then allowed to discharge to approximately 2.65V.
Similarly, the two NiCad cells were charged per the normal NiCad charging procedures and allowed
to discharge to approximately 1.325V each (or 2.65V assuming two cells in series).
Finally, the two NiCad cells were then loaded with a 0.5 ohm resistance and the voltage “sag”
recorded through an “AC coupled” scope measurement. Just after this initial loading test, the NiCad
cells were noted as being relatively unaffected in terms of their overall nominal voltage level and so
the testing proceeded by placing the LIC partially discharged cell in parallel with the NiCad cells. The
system (NiCad + LIC) was then again loaded with the same 0.5 ohm resistance load and voltage
“sag” off the battery recorded (again” AC coupled” measurement). The before and after scope
36mV “dip”
20mV “dip”
Figure 3-5: Battery voltage “sag” tests (Before and after LIC in parallel)
As can be seen a nearly 45% improvement in voltage “sag” is shown based on this simple
demonstration ((36-20)mV/36mV)=0.444. The demonstration clearly indicates some benefit is
provided as the initial voltage (or surface charge) under load is extracted off the ultracapacitor with its
lower series resistance (as compared to the battery chemistry). Larger scale demonstrations may
also provide similar results and might be used to extrapolate improved battery life projections.
3.1.5 Technology Roadmap for Ultracapacitor as Electric-Start Assist Device
Given that improvements were seen in the ability of ultracapacitor technology to improve batteryvoltage sag in motor electric-start assisting, no significant technology roadmap initiative is deemed to
be of high immediate value at this time especially for lower voltage (28V) aircraft systems. Follow on
discussion might focus on additional improvements to the start-assist application in ultracapacitor
design by quantifying the amount of lengthened battery life due to the observations recorded in this
section as well as the other follow-on activity discussed in Chapter 4.1.
3.2 Application Study #2 – Peak Load Assist with Capacitance
3.2.1 Overview
A second application relates to maintaining a distribution bus at a minimum voltage which is
connected to a primary power supply (aircraft engine driven generator) in a large constant power step
load condition. In this case, the minimum voltage to be maintained is dictated by military aircraft
power quality standards and rigidly defined (in contrast to Application Study #1) to mitigate a
momentary, minimum voltage allowable is typically specified as 240V for a nominal 270V system.
Momentary step loads of1.5x (or possibly more) the steady-state rating of the engine generator are
possible in future systems.
3.2.2 Simulation
LT Spice Version IV was used as the demonstration tool to explore the potential benefits of high
levels of capacitance in parallel with a primary 270V supply as a voltage assist scheme. The circuit
diagram from LT Spice used for the simulation is shown in figure 3-6 below.
As shown in the simulation diagram, the 270V supply has been represented by a series of inductance
and resistive components with the power line to the distribution bus defined as a series R-L circuit
representative of 50 ft. of 2 gage wire (Reference 14 MIL-W-22759 wiring specification 0.17
ohms/1000 ft.) and 10µH of line inductance.
Figure 3-6: Peak Load Buffering LT Spice IV Simulation Circuit
The C3 capacitance represents the varying value of Boost Capacitance. Initially, the value of C3 was
set at 30µF as a baseline for comparison with the 80kW constant power, 5 second step load applied
at 100 milli-seconds into the simulation. As seen in figure 3-7 below, the voltage sag resulting at the
Bus voltage Monitor point is 189V (well below the 240V minimum allowable).
Boost Capacitance
Bus Voltage Monitor point
Boost
Figure 3-7: LT Spice IV Simulation Results - 30 µF Low Boost Capacitance with Constant Power Load
In expanding the study, two representative 160V, 5.8F Maxwell Ultracapacitor modules (ref:
http://www.maxwell.com/products/ultracapacitors/160v-module) in series were used as the C3
element and the voltage sag was observed as improving to 208V minimum (but again below the
minimum 240V allowable) as shown in figure 3-8 below. Regenerative Energy “Bounce-back”, as
expected, is also observed when the load is removed. 0.49 ohms was used as the boost capacitance
series resistance of the modules and derived by:
240mΩ (specification resistance per module) x 2 modules in series = 480mΩ + 10mΩ ** = 0.49Ω
** additional resistance approximation due to interconnects as provided by Maxwell Applications
Engineering
189V Minimum
at 100ms
Expanded time
scale Constant
Power Pulse
Load
100ms at step
load turn on
5.1s at step load
turn off
80kW Load
Pulse
Zoomed in time
scale Bus
Voltage Plot
Figure 3-8: LT Spice IV Simulation Results – 2.9F Boost Capacitance with Constant Power Load
Finally, varying the amount of boost capacitance series resistance (and assuming the 2.9F could be
maintained) gave the following results:
Boost Capacitance = 2.9F
Boost Cap Resistance (Ω) Bus Voltage Sag (V)
0.49 208
0.29 222
0.19 233
0.15 240 < Target Voltage minimum
With 120 cells in series (or two 160V modules in series, 60 cells each at 350F per cell) this means
that (not including the additional interconnect resistance as is included in the above summary) 140mΩ
total must be achieved or nearly a 70% reduction from the Maxwell specification value of 480mΩ.
3.2.3 Simulation Conclusion
The results of the LT Spice simulation for the Peak Load Assist case highlights:
>50% improvements in ultracapacitor cell esr is needed to maintain minimum bus voltage requirements
Expansion of ultracapacitor energy density is of minimal added value in this case
Of course, capacitor modules can always be paralleled to reduce the total Req and attack bullet 1
above but at a potentially unacceptable weight penalty to the system design for tactical, weight
sensitive platforms.
208V Minimum
Regenerative
Energy
“Bounceback”
3.2.4 Lab Testing
A simple test was executed to assess the actual performance of ultracapacitor technology as a boost
element in parallel with a power supply. For the lab test, a 16V, 110 F (nameplate) Maxwell
ultracapacitor module was used which had been stored in office space for approximately four years.
The intent of the test was to perform scaled down (i.e. scaled down loading) testing using actual
hardware with available test equipment in the Lockheed Martin Fort Worth power lab. A 16V power
supply was identified as optimal for the test and matched the ultracapacitor module rating. Figure 3-9
below provides the initial notional sketch of the test layout.
Figure 3-9: Step Load Initial Test Layout Concept
The initial testing performed was intended to evaluate the actual state of the module. By applying a 1-amp charge to the module an unusually high charge time was noted (based on C* Δv/Δt).
Subsequent inspection determined external sensor jumpers were shorted together and then corrected
by disconnecting them.
Upon reapplying 1-amp from the power supply the expected charge time was observed based on: These components only at
the discretion of the test director (Lee)
Power
Supply
(16V, 60A)
UCap Module
(16V, 110F)
Pre
Load
+
+
-Thermocouple
Measurement
(3.2): I=C*(Δv/Δt) -> 1-amp = 110F*(Δv/Δt) -> (Δv/Δt) = 1/110 or: 0.009 V/sec or 22 minutes to
charge up to 12V. Note the module was not taken up to the full 16V rating. This measurement
validated the 110F rating of the module.
Upon charging up to 12V the module was then discharged into a 0.3Ω (or 40-amps) very small duration step load with no noticeable initial voltage sag. Subsequent 3-6 second duration 40-amp
step loads were applied with 10-12V gradual decay observed from the ultracapacitor module with the
results shown in figure 3-10 below.
Figure 3-10: Step Load Testing with 40-amp load
Finally, test loading applied was increased to 200-amps by utilizing a spool of 8 awg wire trimmed down to a size to yield 60mΩ measured with an ohmmeter and thus:
12/0.06 = 200-amps
In these conditions, large initial voltage sag was noted (approximately 20% of the initial voltage). The
results are provided in figure 3-11 below.
12-10V Voltage Decay
12V
10V
Figure 3-11: Step Load Testing with 200-amp load
This voltage sag was initially thought to be due to the wiring of the test set up but upon further
investigation was found to be due to the specified increase in the ultracapacitor module series
resistance over time. Per the “Life” Section of a typical 16V module datasheet
(ref: http://www.maxwell.com/products/ultracapacitors/docs/datasheet_16v_small_cell_module.pdf):
“ESR Change (% increase from maximum initial value): 100%”
3.2.5 Technology Roadmap for Peak Load Assist - Ultracap as a Baseline
A technology roadmap outline discussion based on the observations in this section can besummarized in that:
Improvements in ultracapacitor cell resistance are required to meet high step load conditions
where a minimum voltage must be maintained at a bus
Improvements must be made in the storage life cell resistance rise of ultracapacitors Again, paralleling multiple ultracapacitor modules may not be an option in some weight sensitive
applications. This can be seen, for example, in assuming four parallel strings are modified to the
case studied in Chapter 3.2.2 to achieve the required reduction in resistance, or: