BRIDGE EVALUATION THROUGH NONDESTRUCTIVE
TESTING IN COMPARISON WITH VISUAL INSPECTION
Azlan Adnan1, Sophia C. Alih2, Karim Mirasa3
SEER, Faculty of Civil Engineering, Universiti Teknologi Malaysia, Skudai, 81310 1[email protected], 2[email protected], 3[email protected]
ABSTRACT: This paper presents a nondestructive testing method in evaluating bridge condition in comparison with visual inspection that has been used for ages. While condition ratings are all qualitative and defined primarily as sets of visual indicators in routine inspection, nondestructive testing are more quantitative and has large potential in determining damages inside the structure that are not visible. Hence, an attempt to integrate the nondestructive evaluation and bridge management system has been carried out by several researchers. This study is aimed to determine bridge strength through non-destructive testing and thus establish correlation between visual inspection rating and the nondestructive testing results. 75 concrete bridges under the supervision of Public Works Department (Malaysia) have been selected for the preliminary testing which includes the Rebound Hammer test, Ultrasonic Pulse Velocity, and electromagnetic cover meter. However, this paper will only discuss the methodology and results from Rebound hammer test. Generally, this study indicates good correlation between visual rating and strength from Rebound Hammer result. Ratings assigned to the bridge during visual inspection are within an acceptable range in reflecting the bridge strength. Rebound hammer has a potential to be a preliminary test in evaluating the bridge condition. However, since the nondestructive testing is not always readily available and there may be problems occurred with the lack of experienced inspectors to conduct the test, the implementation of this method in routine inspection may be limited. Therefore, an initial study to develop an intelligent rating system combining both nondestructive test data and visual inspection rating has been conducted in the later stage of this research as part of the solution to this problem.
Keywords: Non-destructive testing, Rebound Hammer Test, visual inspection, bridge defects
1. INTRODUCTION
Bridges and other structures deteriorate with time and use. The deterioration process is affected by several characteristics: traffic, rain, freeze, thaw cycles, climate, pollution, temperature, and moisture variations (Rens et al., 2005). This deterioration process can lead to eventual failure of the bridge. Periodic bridge inspections are therefore necessary to assess the extension, implications, and current state of the deterioration process. Inspections not only help to prevent failure but also deliver information necessary to effective administration of the bridge network. During inspections, the need for urgent repairs, maintenance action, and replacements of bridges can be detected and reported. Based on this report, the administrative bodies can further define priorities and establish programs to apply available resources to the most critical bridges.
Damages inside the structure that are not visible are difficult to identify (Chang and Liu, 2003). The application of the nondestructive testing method in bridge inspections has gained interests among researchers due to its effective ability in evaluating structural condition of the bridge (Nash’t et al. 2005; Parhizkar 2003; Rens et al. 2005; Hearn and Shim 1998; Rens and Transue 1998). This study looks at the application of Rebound Hammer Test as nondestructive approach in evaluating bridge condition.
2. NONDESTRUCTIVE TESTING IN BRIDGE EVALUATION
The use of nondestructive techniques could provide invaluable information to the engineers in evaluating the structural integrity and serviceability of an existing structure. Nondestructive testing of concrete includes methods of test on concrete structure or structural members which do not reduce the functional capability of the structure. Nondestructive test may be used to locate areas of unsound concrete or concrete suspected of being significantly below the specified level of strength required by the design or the required level of durability. Nondestructive testing may also be used to indicate changes with time in characteristic of concrete. Rebound hammer together with other testing like the penetration resistance, cast-in-place pullout tests, maturity method, and pulse velocity method are among the available methods in nondestructive testing as been standardized in ASTM.
Survey conducted by Rens and Transue in 1993 and 1996 reveal that the use of nondestructive evaluation as a tool for maintenance decision is increasing. A case study has been conducted by Parhizkar et al. (2003) to revise the role of nondestructive test for evaluation of concrete structure in the Persian Gulf region. The tests that were carried out include concrete uniformity test, compressive test, concrete cover over reinforcement, potential corrosion, and chloride penetration depth determination. This study shows that nondestructive tests are effective methods of assessing deterioration in existing concrete structure.
Due to its large potential, an attempt to integrate the nondestructive evaluation and bridge management system has been carried out by several researchers. In 1998, Hearn and Shim have developed procedures to communicate data from quantitative nondestructive evaluation methods to bridge management system. Nondestructive evaluation method are used directly to assign condition ratings and it offer definite determinations of condition states, without the differences in condition reporting that occur among human inspector.
In 2005, Rens et al. have illustrated a methodology called Bridge Evaluation using Nondestructive Testing (BENT). The methodology used major bridge network under The City and Country of Denver Public Works Department supervision for the application of nondestructive evaluation methods in bridge inspection. The BENT method establishes criteria to determine the bridges to be inspected with nondestructive evaluation technique and also helps determine the nondestructive methods to be applied in the inspection.
2.1 Rebound Hammer Test
to gain as much information on the bridge condition. However it’s only the Rebound hammer test will be discussed in this paper.
Figure 1: Use of NDT method
2.2 Method of Inspection
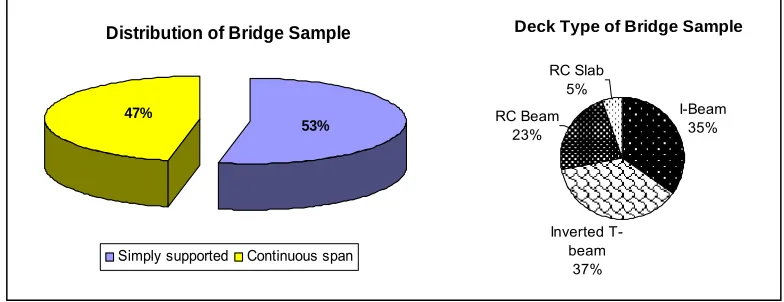
In this research, concrete bridges on the federal highway in Johor state (Malaysia) are chosen as research samples. 75 concrete bridges from various samples are chosen for the testing. Full tests are carried out on the bridge deck, pier, and abutment. Findings from this testing will be correlated indirectly with the overall strength of the bridges. Figure 2 shows the distribution of bridge samples used in this research. Based on interspan relationship, bridge sample are divided in two main types; simply supported and continuous bridge. Number of samples for each type is almost equal with 47% and 53% respectively. Deck type for the selected bridge sample are categorized in two groups; precast (I-beam and inverted T-beam) and cast-in-situ (RC beam and RC slab). Most of the bridge deck samples are from precast type; 37% inverted T-beam and 35% I-beam. There’s only 5% deck from RC slab type and 23% from RC beam.
Distribution of Bridge Sample
47%
53%
Simply supported Continuous span
Deck Type of Bridge Sample
I-Beam 35%
Inverted T-beam
37% RC Beam
23% RC Slab
5%
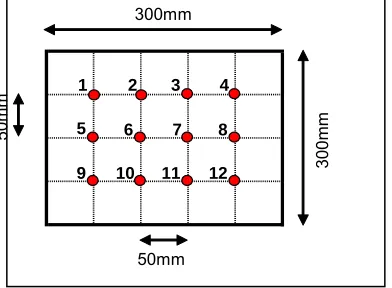
Method used in the application of Rebound hammer test in this research is based on the standard specification outlined in British Standard BS 1881: Part 202. Rebound Hammer Type N with impact energy = 0.225 mkg is used in this research. Smooth and clean surface are selected prior to the testing since rough surface will not give reliable results. 12 readings are taken to estimate surface hardness at each location. Readings are confined to an area not exceeding 300mm x 300mm. A regular grid of lines approximately 50mm apart are drawn on the sample and readings are taken on the intersection of the lines as shown in Figure 3. The mean rebound number obtained in this research is likely to be accurate within ± 4.3% with 95% confidence. To take readings, the plunger of the Rebound hammer is pressed strongly against the concrete surface under test. An impact will cause, and while the hammer is still in position, the index is taken to the nearest whole number. The mean of each set of readings are calculated using all the readings (including abnormally high and abnormally low results).
1 2 3 4
5 6 7 8
9 10 11 12
300mm
300
m
m
50mm
50
mm
Figure 3: Readings on each location sample
Before Rebound hammer test are conducted on the bridge structure, sketches are drawn to identify the most suitable area to conduct the testing in order to develop a contour of concrete quality on the structure. Reference numbers are assigned to each location so it’ll be easy to manage the readings data during analysis. Number of location sample for each element is depends on the size of the bridge structure and visible concrete defects. Larger bridge will require more reading sample compare to the smaller bridges. Figure 4 shows a standard form that has been developed to record Rebound readings during site inspection. Element type and test location are recorded based on the sketches made earlier. Each Rebound number is recorded.
Element Test Readings Location Rebound Strength Concrete
Type Location Location Point Number (N/mm^2) Quality
Deck B1 1 30
I-Beam B2 2 36
Inverted T-Beam B3 3 30
RC Beam B4 4 28
RC Slab A1 5 30
Abutment A2 6 28
Piers A3 7 29
Others: A4 8 29
P1 9 28
P2 10 28
P3 11 29
Others: 12 30
Mean 30
Many trials were carried out to predict the correlation between rebound number and strength. Study has been conducted by Giovanni Pascale et al. (2003) in order to obtain relationship between nondestructive test parameters and strength. The following power function was obtained:
Rc,s = αx β
(1)
Where Rc,s = estimated cube strength and x = nondestructive parameter typical of the method
used.
While in 2005, a study conducted by Dr. Isam H. Nash’t et al. (2005) has obtained the following equation for rebound number and strength relationship:
Sc = 0.788R1.03 (2)
Where, Sc = Crushing strength (N/mm2) and R = Rebound number
Even though this value are subjected to other factors and core sample has to be taken to evaluate specific concrete strength for each sample, for comparison purposes, this value will be used in this preliminary study.
Figure 5 shows Rebound hammer test conducted on selected abutment location.
Figure 5: Rebound hammer test conducted on selected abutment
2.3 Discussion of Results
Table 1: Distribution of Rebound Hammer readings
Rebound No.
Range RC Beam RC Slab I-Beam Inv. I-beam
15≤R≤20 2 0 0 0
21≤R≤25 0 0 0 0
26≤R≤30 11 1 0 0
31≤R≤35 11 5 0 1
36≤R≤40 17 18 0 11
41≤R≤45 13 21 8 12
46≤R≤50 4 9 30 31
51≤R≤55 0 5 22 5
56≤R≤60 0 1 0 0
61≤R≤65 66≤R≤70
Avg. Strength 36 42 49 46
Std. Dev. 6.38 5.92 3.16 4.83
No. of Readings
15 ≤ R ≤ 20 21 ≤ R ≤ 25 26 ≤ R ≤ 30 31 ≤ R ≤ 35 36 ≤ R ≤ 40 41 ≤ R ≤ 45 46 ≤ R ≤ 50 51 ≤ R ≤ 55 56 ≤ R ≤ 60 0 5 10 15 20 25 30 35 N o. of R e a d in g s Rebound Ranges Distribution of Rebound Hammer Readings
RC Beam RC Slab Inverted T-Beam I-Beam
36±6.4 42±5.9
49±3.2 46±4.8
Figure 6: Distribution of Rebound numbers in bridge deck
Concrete Strength for Simply Supported Bridges
0.0 20.0 40.0 60.0 80.0
7 12 12 12 39 39
Age (Year)
C
onc
re
te
S
tre
ngt
h
(N/
m
m
^
2
)
Deck Abutment
Figure 7: Concrete strength in simply supported bridge sample
Concrete Strength for Continuous Bridges
0.0 20.0 40.0 60.0 80.0
4 6 27 30 30 34 39 46 46
Age (Year)
C
onc
re
te
S
tr
e
ngt
h
(N
/mm^2
)
Deck Pier
Figure 8: Concrete strength in continuous bridge sample
Concrete strength obtained from Rebound hammer test is also compared with visual rating assigned to bridge members during inspection to evaluate the correlation between these two parameters. Visual ratings used in this research are based on rating assigned by the inspector for the year 2005. The inspection processes are based on the Public Works Department (Malaysia) specifications and format. Ratings are ordinal and range from 0 to 5; ‘1’ indicates no visible defects while ‘5’ designate critical defects. ‘0’ rating will be assigned if the members can’t be accessed.
Concrete Strength vs. Visual Rating for Simply Supported Bridge
0.0 20.0 40.0 60.0 80.0
7 12 12 12 39 39
Age (Year) Co n c re te st re n g th (N /mm^ 2 ) 0 1 1 2 2 3 Vis u a l R a ti n g
Deck Strength Abutment Strength
Deck rating Abutment rating
Figure 9: Concrete strength in comparison with visual rating (Simply supported bridge sample)
Concrete Strength vs. Visual Rating for Continuous Bridge 0.0 10.0 20.0 30.0 40.0 50.0 60.0 70.0 80.0
4 6 27 30 30 34 39 46 46
Age (Year) C o n c re te s tre n g th (N /mm^2 ) 0 1 2 3 4 5 V isu al R a ti n g
Deck Strength Pier Strength Deck rating Pier rating
Figure 10: Concrete strength in comparison with visual rating (Continuous bridge sample)
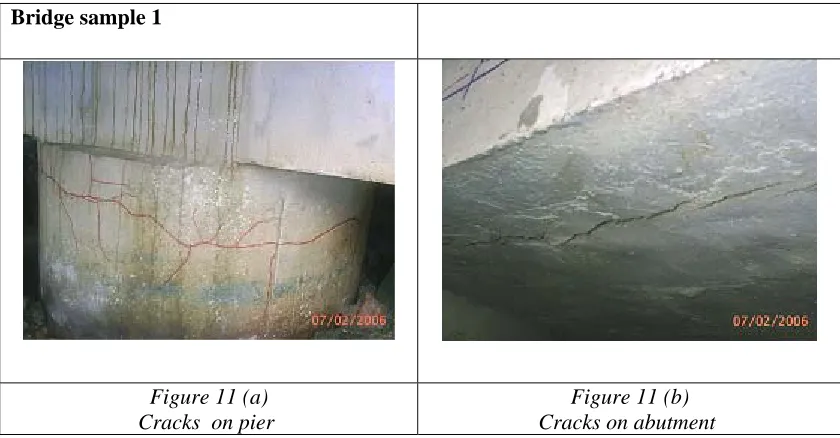
Bridge sample 1
Figure 11 (a) Cracks on pier
Figure 11 (b) Cracks on abutment
Figure 12 shows another example in concrete deterioration and corrosion in reinforcement. Rating 4 are assigned to the bridge deck through visual inspection, while pier and abutment were both rated 3. Through Rebound hammer test, the overall concrete strength on bridge deck is 25 N/mm2, while both pier and abutment has the overall strength of 30 N/mm2. The visual inspection value is comparable with that of visual inspection.
Bridge sample 2
Figure 12 (a)
Corrosion of reinforcement and concrete crack on beam (near abutment)
Figure 12 (b)
Corrosion of reinforcement and concrete crack at middle span of beam
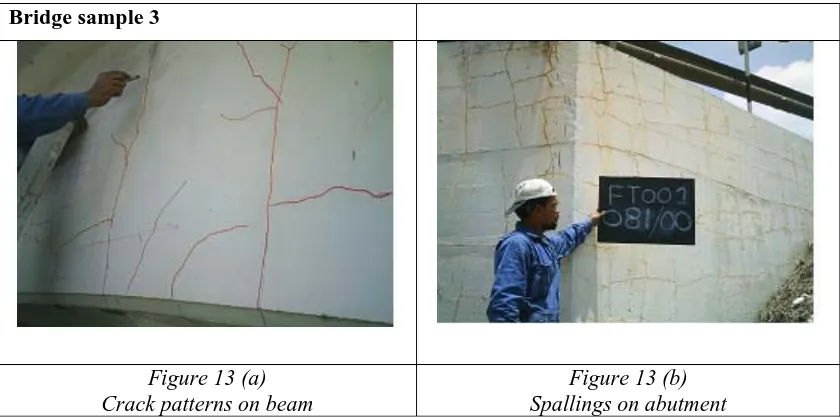
Bridge sample 3
Figure 13 (a) Crack patterns on beam
Figure 13 (b) Spallings on abutment
3. CONCLUSIONS
In general, this study indicates good correlation between visual rating and strength from Rebound Hammer results. Ratings assigned to the bridge during visual inspection are within an acceptable range in reflecting the bridge strength. Rebound hammer has a potential to be a preliminary test in evaluating the bridge condition. The Rebound hammer test method described in this study can be used as future guideline in conducting this test on site. However, since the nondestructive testing is not always readily available and there may be problems occur with the lack of experienced inspectors to conduct the test, the implementation of this method in routine inspection may be limited. Therefore, an initial study to develop an intelligent rating system combining both nondestructive test data and visual inspection rating has been conducted in the later stage of this research as part of the solution to this problem.
4. AKNOWLEDGEMT
The authors gratefully acknowledge the Construction Industry Development Board (CIDB) for the financial support. Also special gratitude to the Public Works Department (Malaysia) for the data they provided and co-operation along the way. Last but not least, thanks to the Faculty of Civil Engineering, Universiti Teknologi Malaysia for their support in making this researches a great success.
5. REFFERENCES
British Standards Institution (1986). Recommendations for Measurement of Velocity of Ultrasonic Pulses in Concrete, London, BS 1881: Part 203
British Standards Institution (1986). Recommendations for Surface Hardness Testing by Rebound Hammer, London, BS 1881: Part 202
Chang, P. C., and Liu, S. C., (2003). Recent Research in Nondestructive Evaluation of Civil Infrastructure. Journal of Material in Civil Engineering. Volume (15): page. 298-304 CNS Farnell Ltd. (2003). PUNDIT 6 Model PC1000. Hertfordshire, England: Operating
Instruction
Management Systems Visual Inspection Results. Journal of Bridge Engineering. Volume (8): page. 374-382
Frangopol, D. M., and Estes, A. C., (1997). Lifetime Bridge Maintenance Strategies Based on System Reliability. Struc. Eng. Int. (IABSE, Zurich, Switzerland), Volume (7)3, page. 193-198
Hearn, G., and Shim, H., (1998). Integration of Bridge Management System and Nondestructive Evaluations. Journal of Infrastructure System. Volume (4): page 49-55 Malaysia (2004). A Guide for Bridge Inspection. REAM – GL 5/2004
Nash’t, I. H., A’bour, S. H., Sadoon, A. A., (2005). Finding an Unified Relationship Between Crushing Strength of Concrete and Non-destructive Tests. 3rd Middle East Nondestructive Testing Conference & Exhibition. November 27-30. Bahrain, Manama: MENDT, 1-9
Parhizkar, T., Ramezanianpour, A. A., Hillemeier B., and Mozafari, N., (2003). The Role of Non-Destructive Tests for Evaluation of a Concrete Structure in the Persian Gulf Region- Case Study. Intenational Symposium (NDT-CE 2003)
Pascale, G., Leo, A. D., Bonora, V., (2003). Nondestructive Assessment of the Actual Compressive Strength of High-Strength Concrete. Journal of Materials in Civil Engineering. Volume (15): page. 452-459
Proceq (1972). Concrete Test Hammer N. Basle, Switzerland: Operating Instruction
Rens, K. L., Nogueira, C. L., and Transue, D. J., (2005). Bridge Management and Nondestructive Evauation. Journal of Performance of Constructed Facilities. Volume (19): page 3-16