ABSTRACT
FIX, JUSTIN SCOTT. Differences in Growth Performance, Carcass Composition and Meat Quality Traits of Commercial Pigs Representative of 1980 and 2005 Genetic Types when Reared on 1980 and 2005 Representative Feeding Programs. (Under the direction of Dr. M. Todd See.)
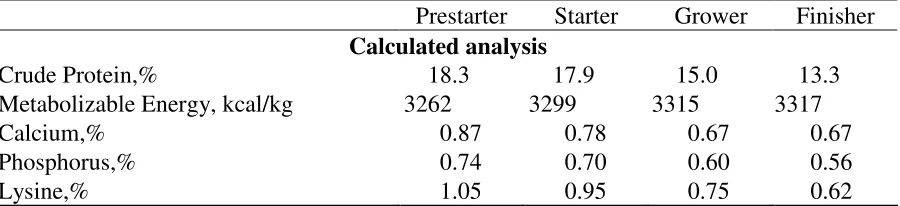
This study examines changes in most traits of economic interest due to changes in genetics and feeding programs over 25 yr. Pigs (n = 185) representative of the current commercial industry (2005) were compared to pigs representative of the commercial industry 25 yr ago (1980). The sample of 2005 genetic type pigs was obtained from a North Carolina commercial producer. The 1980 genetic sample was produced from dams selected to minimize genetic improvement since 1979 and frozen semen from boars commercially available in 1980. Pigs within sex, farrowing group, and genetic sample (GS) were randomly assigned to a feeding program (FP) and placed 3 per pen (n = 62). The 2005 FP was a seven phase pelleted FP (lysine from 1.51 to 0.73% and ME from 3428 to 3651 Kcal/kg) with added antibiotics, synthetic amino acids, and added dietary fat. The 1980 FP consisted of four meal diets (lysine from 1.05 to 0.62% and ME from 3262 to 3317 Kcal/kg) based on formulations from the 1980 Pork Industry Handbook which included no antibiotics, synthetic amino acids or added dietary fat. Individual BW and pen feed consumption were measured every 2 wk. When the average BW of pigs in a pen exceeded 116 kg pens were removed from test and slaughtered.
ultrasound (RTU) (42.7 ± 1 kg) to slaughter (FSS). Real-time ultrasound (n = 3) for backfat depth (BF) and loin muscle area (LMA) at the 10th rib was done every 4 wk, beginning wk 8 (group 1) or wk 10 (group 2). Three evaluators scored structural correctness and mobility.
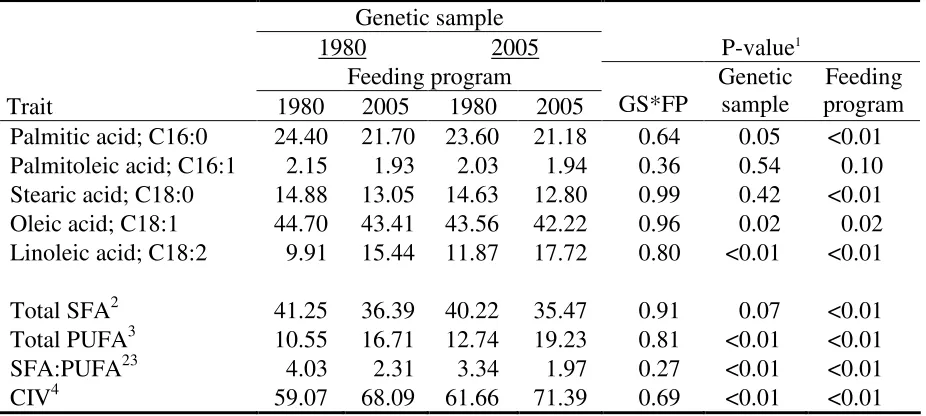
The carcass composition portion of this study evaluated differences in pig carcass and fatty acid composition. Hot carcass weight, dressing percent, belly length, belly firmness, belly thickness, LMA, and BF thickness (1st rib, 10th rib, last rib, last lumbar) were recorded for all carcasses. Samples of subcutaneous adipose tissue were collected from the loin, ham, and belly primals for fatty acid analysis.
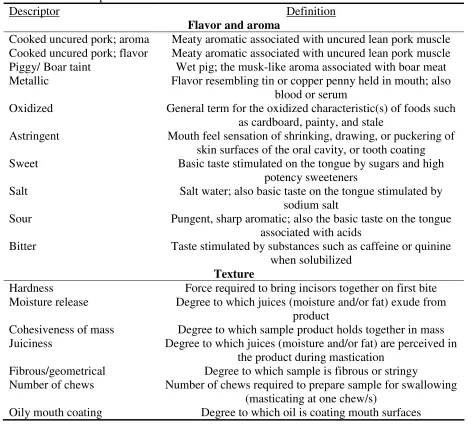
The meat quality portion of this study evaluated differences in pork quality traits and sensory characteristics. At slaughter 45 minute pH was measured. At 24 h post-mortem Minolta color (L*, a*, b*) and ultimate pH of loins and hams were collected. National Pork Board marbling score (1-10), firmness score (1-3), wetness score (1-3), and color score (1-6) were also collected 24 hours post mortem. Percent drip loss, Warner-Bratzler shear force, cooking loss, chemical analysis of lipid content, consumer sensory analysis and trained flavor, and texture descriptive panels were conducted on pork loin chops.
DIFFERENCES IN GROWTH PERFORMANCE, CARCASS COMPOSITION AND MEAT QUALITY TRAITS OF COMMERCIAL PIGS REPRESENTATIVE OF 1980
AND 2005 GENETIC TYPES WHEN REARED ON 1980 AND 2005 REPRESENTATIVE FEEDING PROGRAMS
by
JUSTIN SCOTT FIX
A thesis submitted to the Graduate Faculty of North Carolina State University
in partial fulfillment of the requirements for the Degree of
Master of Science
ANIMAL SCIENCE
Raleigh, North Carolina 2007
APPROVED BY:
_________________________ _________________________ Dr. M. Todd See Dr. Dana Hanson
Chair of Advisory Committee
BIOGRAPHY
AKNOWLEDGEMENTS
I would like to thank all of my committee members, Dr. Eric van Heugten, Dr. Dana Hanson, Dr. Joe Cassady and especially my advisor Dr. Todd See for all their guidance and expertise during my Masters studies. Without their help and support this would not have been possible.
I would also like to thank James, Morris, Frank, David, Kyle, Peggy and others who without their help collecting data none of this would have been possible. Also, thanks to Dr. Boyd and Dr Lisa Dean for helping to point me in the right direction during the fatty acid analysis. Thank you to Marian Correll and Carla Mckinney for all their assistance and making sure I had all my paper work done correctly.
Of course, thanks to my family without their love and support I would not be where I am today.
TABLE OF CONTENTS
Table
LIST OF TABLES ... vii
LIST OF APPENDIX TABLES ... iv
CHAPTER 1 LITERATURE REVIEW ...1
Introduction...2
Genetic Improvement...2
Genetic Improvement through Technology ...3
Feeding Program Improvements...8
Related Studies with Poultry...9
Genetic Effects on Economically Important Traits ...12
Growth and Performance ...12
Genetics Trends ...12
Correlated Responses...16
Effects of Feeding Program Changes on Economically Important Traits ...24
Pelleting Diets ...24
Feed Grade Antibiotics ...25
Metabolizable Energy: Added Fat ...26
Protein Increase...27
Synthetic Amino Acids ...28
Increased Lysine ...29
Increase Number of Phases ...30
Final Conclusion ...31
Literature Cited ...33
CHAPTER 2 Differences in Growth Performance, Lean Growth Performance and Leg Structure/Mobility of Commercial Pigs Representative of 1980 and 2005 Genetic Types when Reared on 1980 and 2005 Representative Feeding Programs...43
Abstract ...44
Introduction...45
Materials and Methods...48
Genetic Samples...48
Feeding Program ...48
Management and Experimental Procedures...49
Results and Discussion ...52
Growth Performance ...52
Real-time Ultrasound Backfat and Longissimus Dorsi Muscle Area...55
Leg Structure/Mobility...57
Literature Cited ...60
CHAPTER 3 Differences in Carcass Composition and Fatty Acid Profiles of Commercial Pigs Representative of 1980 and 2005 Genetic Types when Reared on 1980 and 2005 Representative Feeding Programs...70
Abstract ...71
Introduction...72
Materials and Methods...75
Genetic Samples, Feeding Programs and Management...75
Slaughter Procedures ...76
Fatty Acid Analysis...77
Statistical Analysis...78
Results...79
Carcass Composition ...79
Fatty Acid Composition...80
Subcutaneous Adipose Tissue from Pork Loins ...80
Subcutaneous Adipose Tissue from Pork Bellies ...81
Subcutaneous Adipose Tissue from Pork Hams ...82
Discussion ...84
Carcass Composition ...84
Fatty Acid Composition...86
Literature Cited ...91
CHAPTER 4 Differences in Pork Quality Traits and Sensory Characteristics of Commercial Pigs Representative of 1980 and 2005 Genetic Types when Reared on 1980 and 2005 Representative Feeding Programs...100
Abstract ...101
Introduction...103
Materials and Methods...104
Genetic Samples, Feeding Programs and Management...104
Carcass Measures...105
Statistical Analysis...108
Results and Discussion ...109
Pork Quality of the Longissimus Dorsi Muscle...109
Pork Quality of the Ham ...111
Consumer Sensory Analysis ...113
Trained Panel Analysis ...114
Flavor and Aroma Descriptors...114
Literature Cited ...117
CHAPTER 5
LIST OF TABLES
Table Page
CHAPTER 1
1. 1980 Nutrient requirements of swine...9
2. 2005 Nutrient requirements of swine...9
3. Genetic trends of the Canadian swine industry...14
4. Genetic correlations between growth and performance traits and pork quality traits ...21
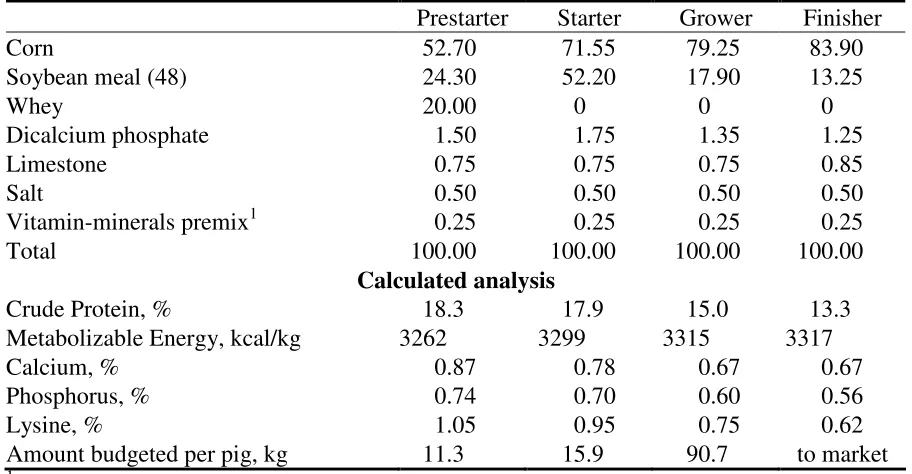
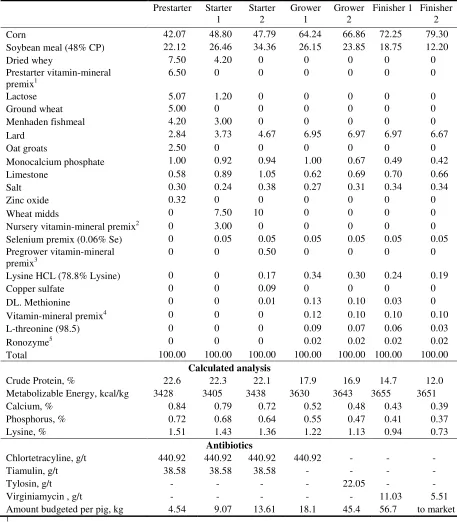
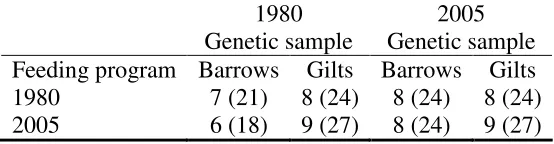
CHAPTER 2 1. 1980 Feeding program ingredients ...65
2. 2005 Feeding program ingredients ...66
3. Pen distribution and (number of pigs per treatment for growth performance and lean growth performance)...67
4. Pen distribution and (number of pigs per treatment for leg structure/mobility evaluation)...67
5. Effect of genetic sample and feeding program on growth performance...67
6. Effect of genetic sample and feeding program on real-time ultrasound backfat and longissimus dorsi muscle area taken at the 10th rib ...68
7. Effect of genetic sample and feeding program on lean growth performance ...68
8. Effect of genetic sample and feeding program on structural correctness ...69
CHAPTER 3 1. 1980 Feeding program ...95
2. 2005 Feeding program ...95
3. Effect of genetic sample and feeding program on carcass measurements...96
LIST OF TABLES (Continued)
5. Effect of genetic sample and feeding program on fatty acid composition of
subcutaneous adipose tissue taken from pork loins ...97 6. Effect of genetic sample, feeding program and sex on fatty acid composition of
subcutaneous adipose tissue taken from pork bellies ...97 7. P-values of main effects and two-way interactions for fatty acid composition of
subcutaneous adipose tissue taken from pork bellies ...98 8. Effect of genetic sample, feeding program and sex on fatty acid composition of
subcutaneous adipose tissue taken from pork hams ...98 9. P-values of main effects and two-way interactions for fatty acid composition of
subcutaneous adipose tissue taken from pork hams ...99
CHAPTER 4
LIST OF FIGURES
Table Page
CHAPTER 5
LIST OF APPENDIX TABLES
Table Page
1. Effect of genetic sample, feeding program and sex on growth performance ...138
2. Effects of genetic sample, feeding program and sex on real-time ultrasound backfat and longissimus dorsi muscle area...139
3. Effects of genetic sample, feeding program and sex on lean growth performance ...140
4. Effect of genetic sample, feeding program and sex on leg structure/mobility ...141
5. Effect of genetic sample, feeding program and sex on carcass measurements ...142
6. Effect of genetic sample, feeding program and sex on trimmed belly measurements 143 7. Effect of genetic sample, feeding program and sex on fatty acid composition of subcutaneous adipose tissue taken from pork loins ...144
8. Effect of genetic sample, feeding program and sex on pork quality of the longissimus dorsi muscle ...145
9. Effect of genetic sample, feeding program and sex on pork quality of the ham ...146
LIST OF APPENDIX FIGURES
Table Page
CHAPTER 1
Introduction
Many changes occurred in the U.S. swine industry during the past 25 years. Technical advances in genetic selection, nutrition and management are areas where the majority of improvements have occurred. From 1980 to 2005 live weight at slaughter increased from 109.8 to 122 kg, dressing percent increased from 71 to 74.7%, and percent retail meat yield rose from 55 to 58% (National Pork Board, 2005). These phenotypic trends for live weight, dressing percent and percent retail meat yield from USDA data indicate an increase in overall efficiency of swine production. While these trends show increased efficiency, it is important to measure other economically important traits that may be negatively correlated (National Pork Board, 2005). This literature review will describe changes in genetic selection and feeding programs and examine how these changes have affected trends in economically important traits from 1980 to 2005.
Genetic Improvement
Genetic selection is commonplace in the genetic nucleus of commercial swine production systems. From 1980 to 2005 advancements were made in how animals were selected. Previously, breeding values were predicted using half and full-sib families from the same contemporary group in the form of a selection index. Today, best linear unbiased prediction (BLUP) has replaced this form of selection and become more prevalent in most livestock species (Morris and Pollott, 1997). The greatest advantage of BLUP lies in increased accuracy due to the use of full pedigree information (Henderson, 1973).
different levels of heritability. They found the genetic response for the selection index was 64 to 91% of the genetic response from selection based on BLUP. In a similar study using two different heritability levels, Sorensen (1988) found genetic response of the selection index was 81 to 96% of that achieved using BLUP. One negative aspect associated with using BLUP is increased levels of inbreeding due to increased selection of family members (Quinton et al., 1992; Quinton and Smith, 1995). When holding inbreeding constant across selection procedures, genetic responses were greater for the selection index, however, if inbreeding is not a problem BLUP is the superior method for genetic selection (Quinton et al., 1992).
Swine testing and genetic evaluation system (STAGES) utilizes BLUP procedures and was introduced to the swine industry in 1986. Prior to 1986 mixed model genetic evaluation with performance data and family data were not used extensively within the U.S. swine industry (Meeker, 1986; Stewart et al., 1991). The STAGES system created an avenue for breeders to report performance data from economically important traits and in turn receive within herd and beginning in 1990, across herd genetic evaluations on a frequent basis, to assist in selection of animals (Stewart et al., 1991). With the incorporation of BLUP into Canadian selection programs in 1985 the rate of genetic change increased 50% for backfat and doubled for age at 100 kg (Sullivan and Dean, 1994). Today most large swine integrators and breeding companies use their own selection indices, utilizing BLUP breeding values and economic weights which are best suited for their breeding objectives.
Genetic Improvement through Technology
Live Prediction of Carcass Measures. Selection to improve carcass measures has
sibling data or progeny data. For the greatest genetic response it is best to select individuals based on data gathered from the both the individual and family rather than solely family data (Falconer and Mackay, 1996).
Prior to 1950, live measures were not overly successful at predicting carcass value (Hetzer et al., 1950). Hazel and Kline (1952) developed the “probing” method which entailed creating a small incision in the skin 3.81 cm off the midline and using a steel ruler to measure backfat depth. Correlations between the live pig measure of backfat and carcass measure of backfat ranged from 0.59 for the middle of the back to 0.79 for behind the shoulder. The use of probing is a fairly accurate way of predicting carcass backfat on a live pig however there was still a need to estimate muscle on animals selected for the breeding herd.
Real-time ultrasound or B-mode, which provides a cross sectional image of the loin and fat layers, has been used on live pigs to predict carcass measurements for LMA, loin muscle depth and BF at various locations (Christian and Moeller, 1990; Smith et al., 1992). One of the initial studies using this type of ultrasound found correlations between live measures and carcass measures of 0.92 for fat depth, 0.70 for LMA, and 0.47 for loin depth (Stouffer et al., 1961). However, initially B-mode was quite expensive and consequently, seldom used (Ramsey et al., 1972). Correlations between real-time ultrasound measures and carcass measures have been shown to be moderate to highly correlated. Smith et al. (1992) measured correlations between real-time ultrasound and carcass measures for 10th rib BF (0.63), last rib BF (0.91), and LMA (0.53). Christian and Moeller (1990) found correlations between real-time ultrasound measures and carcass measures for first rib BF (0.82), 10th rib BF (0.82), last rib BF (0.60), last lumbar BF (0.69), and LMA (0.73). Correlations have been reported as high as 0.87 for 10th rib BF and 0.74 for LMA (Moeller and Christian, 1998).
Technological advancements in measurement technology and increased uniformity of measurement procedures resulted in increased accuracy in the prediction of carcass characteristics based on live data. This along with heritabilities reported by Lo et al. (1992) for real-time ultrasound BF (0.54) and LMA (0.46) at the last rib indicates carcass traits can be improved through selection for real-time ultrasound data. The ability to select individuals based on their own information, as opposed to solely on sibling data or progeny data, is less expensive and results in greater genetic response (Falconer and Mackay, 1996).
Artificial Insemination. Artificial insemination (AI) with fresh extended semen was
Olsen (1981) stated International Boar Semen, a popular boar stud, would only purchase the top 2% of tested Duroc boars for their stud and 95% of their boar semen was sold to commercial producers. Natural service mating typically requires a female to boar ratio of 16:1 while the same ratio with AI use is 100:1 (Estienne, 1999). Use of AI allows for greater genetic improvement in the U.S. swine industry due to the ability to mate superior boars to more females which allows fewer boars to be selected, and thus, greater selection intensity can be practiced (Estienne, 1999).
Central Test Stations. For many years central test stations were a place for hog
producers to evaluate performance of boars and market pigs. During the early years of these central test stations they were mainly used for sib-testing or market-litter testing (Drewry, 1979; Robison, 1982). Many eventually converted to boar test stations. These central test stations also allowed producers to market and purchase centrally tested boars. In 1954 the first facility, Ohio Evaluation Station, was built and by 1971, 26 states had 36 central test stations. Before 1974, there were no standards for testing or reporting of performance data (Robison, 2000). Test stations were managed separately, and in 1974, the National Association of Swine Testing Stations, which later became National Swine Improvement Federation, was formed to create guidelines for performance testing at the central test stations (Miller, 2000).
The goals and accomplishments of central test stations varied over time. One goal was to collect data for traits such as feed conversion, which were not easily measured (Meeker, 1986). Another goal was to increase genetic progress by identifying superior genetics and exchanging these genetics between producers (Rus, 1978; Robison, 1982).
The central testing stations allowed producers to compare genetics from different swine herds at a central location. With the advent of AI, boar studs would purchase these superior genetics and make them available to a greater number of producers (Olson, 1981).
Feeding Program Improvements
Table 1. 1980 Nutrient requirements of swine
1979 NRC
BW (kg) 1-5 5-10 10-20 20-35 35-60 60-100
Daily Feed Intake (kg) 0.25 0.5 1 1.5 2 3
Digestible energy (kcal/kg) 3700 3500 3370 3380 3390 3195 Metabolizable energy (kcal/kg) 3600 3400 3160 3175 3190 3195
Crude protein (%) 27 20 18 16 14 13
Lysine (%) 1.28 0.95 0.79 0.7 0.61 0.57
Linoleic acid (%) 0 0 0 0 0 0
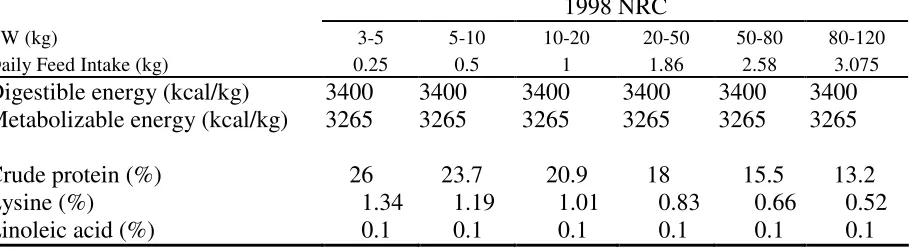
Table 2. 2005 Nutrient requirements of swine
1998 NRC
BW (kg) 3-5 5-10 10-20 20-50 50-80 80-120
Daily Feed Intake (kg) 0.25 0.5 1 1.86 2.58 3.075
Digestible energy (kcal/kg) 3400 3400 3400 3400 3400 3400 Metabolizable energy (kcal/kg) 3265 3265 3265 3265 3265 3265
Crude protein (%) 26 23.7 20.9 18 15.5 13.2
Lysine (%) 1.34 1.19 1.01 0.83 0.66 0.52
Linoleic acid (%) 0.1 0.1 0.1 0.1 0.1 0.1
Advances in genetics, nutrition and technology previously described have led to the phenotypic improvements experienced in the U.S. swine industry from 1980 to 2005.
Related Studies with Poultry
Havenstein et al. (1994a and 1994b) and Qureshi and Havenstein (1994) evaluated economically important traits comparing 1957 broilers to 1991 broilers when fed diets representative of those time periods.
Broilers from the 1991 genetic strain fed the 1991 diet had BW 3.2 to 4.2 times greater than 1957 genetic strain fed the 1957 diet for BW measures one through five. The authors indicate that improved growth was mainly due to genetic selection for increased BW, 85 to 90%, of the total improvement. The 1991 diet improved feed conversion 20%, while the 1991 genetic strain showed a 30% improvement in feed conversion. The authors suggested that the majority of the improved feed conversion from diet was due to difference in wasted feed for the 1957 mash diet versus the 1991 crumbled and pelleted diet. Mortality for the 1957 genetic strain was nearly three times less (3.3 vs. 9.1%) than the 1991 genetic strain (Havenstein et al., 1994a).
Similar to BW differences reported in Havenstein et al. (1994a), carcass weights for the 1991 genetic strain fed the 1991 diet were 3.5 to 4.4 times heavier than 1957 genetic strain fed 1957 diet. Hot carcass yield was nearly 7% greater for 1991 genetic strain versus 1957 genetic strain; compared to a 2% increase for the 1991 diet versus 1957 diet. At the same age, broilers from the 1991 genetic strain were fatter than 1957 genetic strain broilers, while fatness did not differ between diets. The most important measure, according to the authors, was fat at the respective market ages for the two genetic strains. The 1991 genetic strain at 42 days of age and the 1957 genetic strain at 85 days of age did not differ in carcass fat (Havenstein et al., 1994b).
broilers; however, these studies compared them to 2001 broilers, when fed diets representative of 1957 and 2001.
Broilers from the 2001 genetic strain fed the 2001 diet were 3.86 to 4.96 times heavier for five live measures of BW. Change in diet regardless of genetic strain increased BW 7.4 to 12% for the five BW measures. Similar to Havenstein et al. (1994a) changes in diet accounted for 7 to 12% of the increase in BW. The combination of genetic and nutritional improvement reduced feed conversion for 2001 genetics and nutrition nearly three times from what it was in 1957. Also in agreement with Havenstein et al. (1994a), the genetic improvements accounted for 85 to 90% of the change in growth rate, while nutrition accounted for 10 to 15% of change. The authors also suggested the improvement in growth rate reported in Havenstein et al. (1994a), has continued at a similar to slightly higher rate through 2001. Mortality for the 1957 genetic strain was one-half that of the 2001 genetic strain (Havenstein et al., 2003a).
Carcass weights were 4.6 to 6.0 times heaver for the 2001 genetic strain fed the 2001 diet compared to the 1957 strain fed the 1957 diet, which is in agreement with Havenstein et al. (1994a) and (2003a). Carcass weight and yield showed genetic strain by diet interaction of magnitude, where 2001 genetic strain showed a greater increase in both traits when fed 2001 vs. 1957 diets than the 1957 strain fed 2001 vs. 1957 diets. In agreement with Havenstein et al. (1994b), carcass fat did not differ for the two genetic strains at their respective slaughter ages of 43 and 85 days. The 2001 diet increased carcass fat compared to the 1957 diet (Havenstein et al., 2003b).
Genetic Effects on Economically Important Traits
Growth and Performance
There are several important traits that fall into the category of growth and performance. Average daily gain (ADG), average daily feed intake (ADFI), gain to feed (G:F) or feed to gain (G:F), days to a specified BW, loin muscle area (LMA), backfat (BF) at various locations, and lean gain which takes into account ADG, LMA, and BF. These traits are focal points of most terminal selection programs.
Genetics Trends
The National Barrow Show (NBS) progeny test is an evaluation of a sire’s progeny for various traits. Pigs in the 1980 NBS progeny test averaged 0.72 kg/d for ADG, 2.64 cm for 10th rib BF, and 29.48 cm2 LMA (Phillips, 1980). Phenotypic improvements were demonstrated when these figures were compared to those reported for the 2005 NBS progeny test. The 2005 NBS progeny test averaged 0.81 kg/d for ADG, 10th rib BF was reduced to 1.91 cm, and LMA was increased to 38.00 cm2 (2006). Similar phenotypic trends during part of this time period were reported for the North Carolina Central Boar Test (Jones, 1994). From 1980 to 1993 ADG improved by 12%, backfat was reduced by 17% and feed efficiency improved by 13.50%.
mm/yr for 10th rib BF, 0.37 cm2/yr for LMA, and 2.35 g/d/yr for lean gain. Lean gain was calculated using fat-free lean prediction from NPPC (2000).
Table 3. Genetic trends of the Canadian swine industry (Adapted from Sullivan and Dean, 1994)
1980-1985 1985-1990 1990-1992
BF1 (mm/yr)
Age at 100 kg (d/yr)
BF1 (mm/yr)
Age at 100 kg (d/yr)
BF1 (mm/yr)
Age at 100 kg (d/yr)
Yorkshire -0.20 -0.60 -0.21 -0.90 -0.30 -1.50
Landrace -0.33 -0.80 -0.25 -1.30 -0.43 -1.40
Hampshire -0.08 -0.60 -0.07 -0.90 -0.20 -1.30
Duroc -0.18 -0.90 -0.18 -1.30 -0.34 -1.50
1
BF: backfat depth
Kaplon et al. (1991a) evaluated phenotypic and genetic trends for Polish Large White pigs from 1978 to 1987 based on on-farm tests of boars and nucleus records for sows. Phenotypic trends for BF, ADG, and days to 110 kg were 0.065 mm/yr, 6.80g/d/yr, and -2.76 days/yr. Genotypic trends varied in magnitude and direction for animal, sire, and dam genetic values. For BF, animal, sire, and dam genetic trends were favorable but insignificant. Genetic trends for days to 110 kg and ADG were favorable and significant for sire but were negated by the dam’s unfavorable value and therefore, animal was not different from zero.
Data from pigs at central test stations in Finland from 1982 to February 1994 were used to estimate genetic trends in the Large White and Landrace breeds for ADG and feed conversion (Mantysaari et al., 1994). Examination of mean breeding values shows obvious improvements for both breeds from 1987 to 1992 in ADG and feed conversion. Both breeds had similar genetic progress in their feed conversion improvement while Landrace had slightly greater improvement in ADG than Large White.
period occasionally exceeded phenotypic response due to the unfavorable environmental effect. Estimates of genetic trends were 21.7 g (Landrace, dam), 49.2 g (Large White), and 23.0 g (Landrace, sire) for ADG and -0.42 (Landrace, dam), -0.82 (Large White), and -0.107 (Landrace, sire) for feed conversion.
Phenotypic and genetic trends for traits emphasized in most selection programs throughout the world’s swine industries around the 1980 to 2005 time period are mainly favorable and show vast improvements were made.
ADG (0.27), BF (0.29), and days to 110 kg (0.26) (Kaplon et al., 1991b). Stewart and Schinckel (1989) summarized more than 175 research papers and calculated a weighted average of heritabilities for ADG (0.30), days to 104.3 kg (0.25), BF (0.41), F:G (0.30), and ADFI (0.24).
The traits summarized are typically the focal points of selection indices; however, not all selection indices include the same traits or measures for the traits. Subsequently, it is important to look at correlations among these traits.
Genetic correlations between these traits were reported by Kaplon et al. (1991b), Lo et al. (1992), Mrode and Kennedy (1993), NPPC (1995) and a summary of over 175 research papers in Stewart and Schinckel (1989). Average daily gain had favorable genetic correlations with days to a specified BW (-0.83 to -0.99), lean gain (0.24 to 0.96), and feed to gain (-0.28 to -0.70). Genetic correlation between LMA and ADG were both unfavorable and favorable and ranged from (-0.18 to 0.36) while ADFI and ADG were highly positive in correlation (0.58 to 0.80). Average daily gain (0.13 to 0.43) days to a specified BW (-0.04 to -0.43), feed to gain (0.09 to 0.40), ADFI (0.33 to 0.64), and lean gain (0.11) were unfavorably correlated with BF. However, BF was favorably correlated with LMA (0.27 to -0.61).
Correlated Responses
Structure. The U.S. swine industry’s shift to confinement housing with slatted and hard-surfaced floors has led to an increased need to emphasize feet and leg structure (Bereskin, 1979a). Selection for structural correctness is typically done in two ways, direct selection where animals that are deemed unsound are not selected and indirect selection where animals whose soundness reduces longevity will not have as much influence in the herd. Heritabilities have been reported for subjective scores of structural soundness for front legs of 0.28 and rear legs of 0.39 (Bereskin, 1979b), and overall structural correctness of 0.19 (NPPC, 1995). Bereskin (1979b) and NPPC (1995) also reported the following genetic correlations: front leg with ADG (0.33), BF (0.35), and LMA (-0.33), rear leg with ADG (0.09), BF (0.05), and LMA (-0.19) and overall structural correctness with ADG (0.11), BF (0.07), and days to 113 kg (-0.09). Structural correctness is low to moderately correlated with the aforementioned performance traits. Selection for increased ADG and Days to 113 kg is favorable while selection for BF and LMA are unfavorable for improving structural correctness.
Carcass Traits. Carcass traits such as dressing percent and carcass length are aspects
(-0.10), ADG ((-0.10), and F:G (-0.07). Stewart and Schinckel (1989) also reported dressing percent has no genetic correlation with ADG, days to 104.3 kg, and F:G but is unfavorably correlated with BF and favorably correlated with ADFI. Genetic correlations reported in these two papers contradict one another and indicate the direction and magnitude of the correlation depends on the population of pigs. Results of the two papers were consistent with regard to the relationship between BF and carcass length, and it was concluded that selection for reduced BF would result in longer carcasses. Stewart and Schinckel (1989) indicates selection for reduced BF leads to lower dressing percent and selection for increased ADFI leads to higher dressing percent.
Pork Quality. Pork quality or measures of the quality of the muscle, which affects
0.14), meat color (0.26 and 0.12), drip loss (0.38 and 0.67) and IMF (0.38 and 0.67). A comprehensive study measuring most pork quality measures was reported by NPPC (1995). Heritability estimates were calculated on 9 breeds or genetic lines in the U.S. swine industry. Heritability estimates at 45 minutes for color score (0.17), marbling score (0.13), firmness score (0.17), Hunter L color (0.24), and loin reflectance (0.25) and at 24 hours after initial measurement for color score (0.19), marbling score (0.31), firmness score (0.21), Hunter L color (0.31), and muscle reflectance (0.29) were reported. Heritability estimates for other pork quality traits included pH (0.38), drip loss (0.16), water holding capacity (0.19), and percent IMF (0.47) of the loin muscle. The heritabilities summarized indicate there is genetic variation, and thus, it is important to examine the genetic correlation between these traits and performance traits.
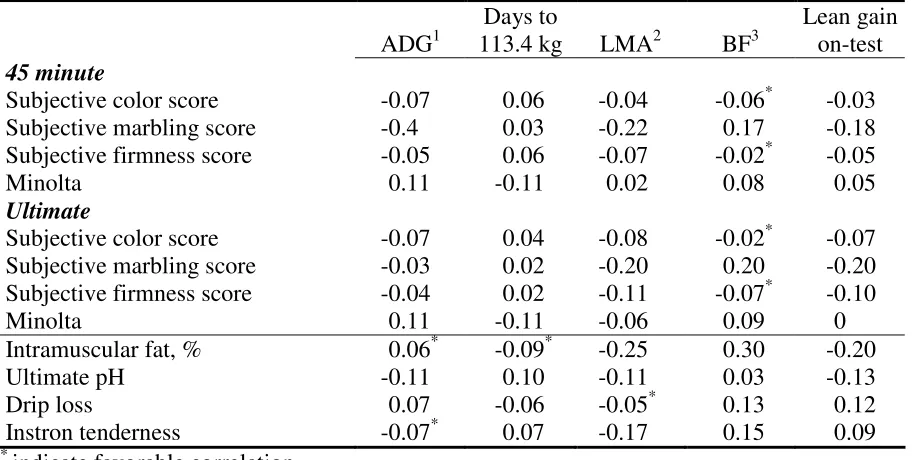
Table 4. Genetic correlations between growth and performance traits and pork quality traits (Adapted from NPPC, 1995)
ADG1
Days to
113.4 kg LMA2 BF3
Lean gain on-test
45 minute
Subjective color score -0.07 0.06 -0.04 -0.06* -0.03
Subjective marbling score -0.4 0.03 -0.22 0.17 -0.18
Subjective firmness score -0.05 0.06 -0.07 -0.02* -0.05
Minolta 0.11 -0.11 0.02 0.08 0.05
Ultimate
Subjective color score -0.07 0.04 -0.08 -0.02* -0.07
Subjective marbling score -0.03 0.02 -0.20 0.20 -0.20
Subjective firmness score -0.04 0.02 -0.11 -0.07* -0.10
Minolta 0.11 -0.11 -0.06 0.09 0
Intramuscular fat, % 0.06* -0.09* -0.25 0.30 -0.20
Ultimate pH -0.11 0.10 -0.11 0.03 -0.13
Drip loss 0.07 -0.06 -0.05* 0.13 0.12
Instron tenderness -0.07* 0.07 -0.17 0.15 0.09
*
indicate favorable correlation
1
ADG: average daily gain
2
LMA: loin muscle area
3
BF: backfat depth
Genetic correlations reported by Lo et al. (1992), Hovenier et al. (1992), and NPPC (1995) indicate there is considerable variation in the genetic relationship between growth and performance traits and pork quality traits in different populations. Average daily gain and days to a specified BW had both favorable and unfavorable genetic correlations, which suggest selection for those traits will not have a consistent effect on pork quality. Genetic correlations for BF, LMA, and lean gain with pork quality traits indicate selection with emphasis only for those three traits will lead to poorer pork quality.
Heritability estimates for taste panel traits were estimated by Lo et al. (1992) for juiciness (0.12), tenderness (0.45), pork flavor intensity (0.13), off-flavor intensity (0.03), and overall acceptance (0.34). Cameron et al. (1990b) estimated heritabilities for flavor liking (0.16), pork flavor (0.14), abnormal flavor (0.31), tenderness (0.23), juiciness (0.18), and acceptability (0.16). Estimates from NPPC (1995) were for juiciness (0.01), tenderness (0.20), chewiness (0.20), flavor (0.05), and off-flavor (0.25). There is considerable variation for heritabilities between studies. Still, there is enough evidence to conclude that taste panel traits are heritable, and thus, selection is possible.
Pork quality has also been evaluated in pigs from selection studies for leanness and lean gain (Lonergan et al., 2001; Schwab et al., 2006). Duroc pigs from a line selected for lean growth efficiency had lower 45 minute pH, lower subjective firmness score, higher Warner-Bratzler shear force, more drip loss, and lower percent IMF in the loin muscle (Lonergan et al., 2001). These results were in agreement with another study using Duroc pigs selected for increased leanness compared to pigs from boars from an older time period (Schwab et al., 2006). Pigs from the selected line had lower percent IMF, subjective marbling score, Instron tenderness, and subjective color score. Pigs from the selected line also had lower pork flavor score and a greater incidence of off-flavor. Cameron et al. (1999) used Large White pigs selected for efficient lean growth to evaluate meat quality differences. This study did not report significant differences in pork quality between the select and control line which may be due to the utilization of both restricted and ad-libitum feeding regimes. Lonergan et al. (2001) and Schwab et al. (2006) used ad-libitum feeding and the results agree with genetic correlations indicating selection for increased leanness and muscle subsequently decreases pork quality.
tender loin muscles. These findings appear to agree with genetic correlations between BF and pork quality traits previously discussed.
The genetic trends for growth and performance traits and the genetic correlations for typically unselected traits indicate great amounts of change have possibly occurred from 1980 to 2005 based on practiced selection. Growth and performance have changed for the better. However, pork quality traits may have suffered due to unfavorable correlations.
Effects of Feeding Program Changes on Economically Important Traits
Significant changes have been made in feeding programs during the time period from 1980 to 2005. Recommendations in nutrition requirements of swine (NRC, 1979; NRC, 1998) suggest increased crude protein levels from 5 kg BW to slaughter, increased metabolizable energy from 10 kg BW to slaughter, higher percent lysine, and added dietary fat. Other important changes in feeding programs include increased prevalence of pelleted diets, increased number of dietary phases, more wide spread usage of growth promoting levels of antibiotics, and availability of synthetic amino acids. The effects of theses feeding program changes on growth and performance, carcass composition, and pork quality will be summarized in the following section.
Pelleting Diets
from weaning to 100 kg (Baird, 1973). Hanke et al. (1972) reported a modest improvement in ADG but a sizable improvement in G:F in 740 commercial market pigs. Pelleted diets vs. mash diets fed to 146 weanling pigs resulted in no difference in ADG, ADFI or F:G. However, during the grow-finish phase these pigs showed a 6% improvement in F:G (Skoch et al., 1983). Wondra et al. (1995) reported pelleting diets improved ADG by 5% and G:F by 7% for 160 finishing pigs. These studies are in agreement with a summary of 117 experiments (Patience and Thacker, 1989), where pelleting increased ADG by 6.6% and feed efficiency by 7.9%. Baird (1973) reported pelleting diets had no effect on dressing percent, BF, LMA, carcass length, loin firmness, wetness or lean color. Wondra et al. (1995) also reported pelleting diets had no effect on dressing percent or BF. There is not a consensus among these authors for improvement in ADG; however, reported change in ADG may be due to improved nutrient digestibility (Wondra et al., 1995). Improvement in feed efficiency due to pelleting was consistent across all studies and is believed to be a result of reduced feed wastage. These improvements in ADG and feed efficiency come without sacrifice in other performance or carcass traits.
Feed Grade Antibiotics
of testing (Weber et al., 2001). Cromwell et al. (1996) found a 2.5% improvement in ADG and F:G for 576 pigs in the grow-finish stage fed antibiotics vs. no antibiotics. A governmental report indicated feeding growth promotant levels of antibiotics resulted in improvements in ADG and F:G for 7-25 kg BW (16 and 7%), 7-49 kg BW (11 and 5%) and 7 kg BW to finish (4 and 2 %) (Cromwell and Dawson, 1992). Cromwell (1991) suggested the response in a commercial environment could be two-fold that which is reported in trials involving research facilities which tend to have less disease. Feeding antibiotics to pigs as a growth promotant has been effective in increasing ADG and thereby, improving feed efficiency. These improvements appear to be the greatest when pigs are younger and decrease with age.
Metabolizable Energy: Added Fat
fat improved G:F linearly but did not affect dressing percent, pH, BF, carcass length, LMA or percent lean. This study also found added fat had no effect on the following pork quality traits and sensory characteristics: subjective color, firmness, wetness, marbling, objective color, drip loss, Warner-Bratzler shear force, overall tenderness, juiciness, flavor intensity or off flavor intensity. These studies indicate adding fat, specifically choice white grease at the 5% level to pig diets improves feed efficiency and has no unfavorable effects on other economically important traits.
Protein Increase
thickness (Bereskin and Davey, 1978). Goerl et al. (1995) reported increasing protein had a linear effect on BF, as percent protein increased BF decreased, a quadratic effect on LMA, lowest percent protein had smallest LMA and a quadratic effect on percent IMF, lowest percent protein had the most IMF and the two highest percent protein levels had similar low amounts of IMF. Increasing percent protein in the diet did not affect pH, water holding capacity or Hunter “L” value in the loin muscle. A quadratic effect was reported for Warner-Bratzler shear force, where the lowest and highest percent protein had the lowest or most ideal shear force values. Increasing percent protein in the diet has been shown to increase ADG and feed efficiency by varying amounts, increase LMA, reduce BF and increase carcass percent lean. However, low levels of dietary protein resulted in increased percent IMF.
Swine diets are typically corn and soybean meal based. Prior to the introduction of synthetic amino acids, crude protein level was an indicator of amino acid levels in the diet. It is now known that pigs require amino acid, protein components, not protein (Lewis, 1991). Therefore it is important to examine the effect of amino acid levels, specifically synthetic amino acids, on swine performance.
Synthetic Amino Acids
economically important traits; however, this places more emphasis on the next limiting amino acids. Subsequently, the advent of synthetic amino acids allows more choice among protein meals in balancing swine diets with respect to amino acids (Patience and Thacker, 1989; Whittemore, 2006a).
Increased Lysine. Increasing lysine in pig diets has been shown to improve pig
lumbar BF, ultimate pH, drip loss, Hunter color, shear force or subjective loin muscle scores for color firmness or marbling. However, LMA was reduced, 10th rib BF increased, and carcass lean decreased while percent IMF increased by nearly 19%. This is in agreement with Cisneros et al. (1996). In this study, 24 hybrid gilts were fed 5.6 vs. 4.0 g/kg lysine for 21 or 35 day intervals prior to slaughter. Increasing lysine had no effect on ADG, G:F or BF but increased carcass yield. Subjective loin muscle scores for color, firmness and marbling were not affected; however, LMA was increased and IMF was decreased. Improvements in ADG, feed efficiency, muscle and leanness vary with lysine changes between trials. However, all these traits appear to be favorably affected by increases in lysine. Most pork quality and taste panel traits, except IMF, which is negatively affected, appear to be unaffected by increasing lysine content in pig diets. Lysine’s effect on IMF may be due to the increase in muscle production and decrease in fat production which occurs when lysine content is increased. The lysine requirement for pigs to maximize lean gain varies due to their genetic makeup. As lean gain potential increases the lysine requirement to maximize the potential also increases. If the lysine requirement is not met it appears the IMF is increased
Increased Number of Dietary Phases
an increased number of phases in a swine diet as long as the initial phases meet the growing pig’s nutrient requirement. However, as previously discussed, pigs require different nutrient levels at different stages (NRC, 1979; NRC, 1998). Modern feeding programs typically have smaller weight ranges for more feeding phases (NRC, 1998) than suggested feeding programs in the 1979 Pork Industry Handbook as reported in Krider et al. (1982). Younger pigs require higher protein or amino acids levels, which tends to be more expensive, than older pigs to reach maximum lean gain. By having more phases the nutrient levels may be lowered in the final stages of growth, which in turn could lead to lower costs and reduced nutrient excretion without negative effects on other economically important traits (Tokach et al., 1999).
The changes in feeding programs discussed have had large impacts on the swine industry in the past 25 years. Many of the traits have improved growth and efficiency of swine, which supports the phenotypic trends observed over this time period. Feeding program improvements have increased muscle and to a lesser extent leanness with only minor negative effects on important pork quality traits. The reported reductions in IMF may not necessarily be a negative result of increased protein or lysine rather when pig’s growth requirements for lysine are not met IMF is increased. However, the vast majority of effects have been positive for the U.S. swine industry.
Final Conclusion
Literature Cited
2006. 60th NBS Progeny Test winners announced High Plains/Midwest Ag Journal.
Baird, D. M. 1973. Influence of pelleting swine diets on metabolizable energy, growth and carcass characteristics. J. Anim. Sci. 36:516-521.
Baker, D. H. and V. C. Speer. 1983. Protein-amino nutrition of nonruminant animals with emphasis on the pig: past, present and future. J. Anim. Sci. 57(Suppl. 2):284.
Barton-Gade, P. A. 1990. Pork quality in genetic improvement programmes- the Danish experience. Proc. of the National Swine Improvement Federation Annual Meeting. Des Moines, IA.
Belonsky, G. M. and B. W. Kennedy. 1988. Selection of individual phenotype and best linear unbiased predictor of breeding value in a closed swine herd. J. Anim. Sci. 66:1124-1131.
Bereskin, B. and R. J. Davey. 1978. Genetic, sex and diet effects on pig carcass traits. J. Anim. Sci. 46:1581-1591.
Bereskin, B. 1979a. Feet and leg soundness. Proc. of the National Swine Improvement Federation Annual Meeting. St. Louis, Missouri.
Bereskin, B. 1979b. Genetic aspect of feet and leg soundness in swine. J. Anim. Sci. 48:1322-1328.
Blanchard, P. J., M. B. Willis, C. C. Warkup, and M. Ellis. 2000. The influence of carcass backfat and intramuscular fat level on pork eating quality. J. Sci. Food. Agric. 80:145-151.
Boessen, B., J. D. Lawrence and G. Grimes. 2004. U.S. Hog Marketing Contract Study. Working paper no. AEWP 2004-04, Dept. of Agric. Econ., Univ. Missouri, Columbia.
Brisbane, J. R. and J. Chesnais. 1998. Genetic evaluation for carcass quality and feed efficiency at the Canadian Centre for Swine Improvement (CCSI). Proc. of the National Swine Improvement Federation Annual Meeting. East Lansing, MI.
Cameron, N. D. 1990a. Comparison of Duroc and British Landrace pigs and the estimation of genetic and phenotypic parameters for growth and carcass traits. Anim. Prod. 50:141-153.
Cameron, N. D., G. R. Nute, S. N. Brown, M. Enser, and J. D. Wood. 1999. Meat quality of Large White pig genotypes selected for components of efficient lean growth rate. Anim. Sci. 68:115-127.
Cheema, M. A., M. A. Qureshi, and G. B. Havenstein. 2003. A comparison of the immune response of a 2001 commercial broiler with a 1957 randombred strain when fed “typical” 1957 and 2001 broiler diets. Poultry Sci. 82:1519:1529.
Chen, P., T. J. Baas, J. W. Mabry, J. C. M. Dekkers, and K. J. Koehler. 2002. Genetic parameters and trends for lean growth rate and its components in U.S. Yorkshire, Duroc, Hampshire, and Landrace pigs. J. Anim. Sci. 80:2062-2070.
Christian, L. L., and S. J. Moeller. 1990. Current status of real-time ultrasound research. Proc. of the National Swine Improvement Federation Annual Meeting. Des Moines, Iowa.
Cisneros, F., M. Ellis, D. H. Baker, R. A. Easter and F. K. McKeith. 1996. The influence of short-term feeding of amino acid-deficient diets and high dietary leucine levels on the intramuscular fat content of pig muscle. Anim. Sci. 63:517-522.
Cline, C. R. 1990. Effects of fat on the lysine requirements of finishing barrows and gilts. Swine Day, Purdue University, West Lafayette, IN.
Cline, C. R. and D. Smith. 1998. Phase-feeding in the grow-finish period. Swine Day, Purdue University, West Lafayette, IN.
Cromwell, G. L. 1991. Antimicrobial agents. In: E. R. Miller, D. E. Ullrey and A. J. Lewis (ed.) Swine Nutrition. Butterworth-Heinemann, Stoneham, MA.
Cromwell, G. L. and K. A Dawson. 1992. Antibiotic growth promotants. In emerging agriculture technology: Issues for the 1990’s. Office of Technology Assessment, U.S. Congress, Washington, D.C.
Cromwell, G. L., G. W. Davis, W. E. M. Morrow, R. A. Primo, D. W. Rozeboom, M. D. Sims, E. P. Sanisiewski, and C. H. Ho. 1996. Efficacy of antimicrobial compound U-82,127 as a growth promoter for grow-finishing pigs. J. Anim. Sci. 74:1284-1287. Davey, R. J. and D. P. Morgan. 1969. Protein effect on growth and carcass composition of
swine selected for high and low fatness. J. Anim. Sci. 28:831-836.
Drewry, K. J. How do commercial producers use the central test station. 1979. Proc. of the National Swine Improvement Federation Annual Meeting. St. Louis, MO.
Emmett, R., S. Moeller, K. Irvin, M. Rothschild, G. Plastow and R. Goodwin. 2000. An investigation into the genetic controls of pork quality. Proc. of the National Swine Improvement Federation Annual Meeting. Nashville, TN.
Engel, J. J., J. W. Smith, II, J. A. Unruh, R. D. Goodband, P. R. O’Quinn, M. D. Tokach and J. L. Nelssen. 2001. Effects of choice white grease or poultry fat on growth performance, carcass leanness and meat quality characteristics of growing-finishing pigs. J. Anim. Sci. 79:1491-1501.
Estienne, M. 1999. Advantages to using artificial insemination in swine breeding programs. Livestock Update, Virginia Polytechnic Institute and State University, Blacksburg, VA.
Falconer, D. S., and T. F. C. Mackay. 1996. Introduction to Quantitative Genetics (4th Ed.). Pearson Education Limited, Edinburgh Gate, England.
Friesen, K. G., J. L. Nelssen, R. D. Goodband, M. D. Tokach, J. A. Unruh, D. H. Kropf, and B.J. Kerr. 1994. Influence of dietary lysine on growth and carcass composition of high-lean-growth gilts fed from 34 to 72 kilograms. J. Anim. Sci. 72:1761-1770. Friesen, K. G., J. L. Nelssen, R. D. Goodband, M. D. Tokach, J. A. Unruh, D. H. Kropf, and
B. J. Kerr. 1995. The effect of dietary lysine on growth carcass composition and lipid metabolism in high-lean-growth gilts fed from72 to 136 kilograms. J. Anim. Sci. 73:3392-3401.
Goerl, K. F., S. J. Eilert, R. W. Mandigo, H. Y. Chen and P. S. Miller. 1995. Pork characteristics as affected by two populations of swine fed six crude protein levels. J. Anim. Sci. 73:3621-3626.
Hale, O. M. and B. L. Southwell. 1967. Differences in swine performance and carcass characteristics because of dietary protein level, sex and breed. J. Anim. Sci. 26:341-344.
Hanke, H. E., J. W. Rust, R. J. Meade and L. E. Hanson. 1972. Influence of source of soybean protein and of pelleting, on rate of gain and gain/feed of growing swine. J. Anim. Sci. 35:958-962.
Havenstein, G. B., P. R. Ferket, S. E. Scheideler, and B. T. Larson. 1994a. Growth, livability, and feed conversion of 1957 vs. 1991 broilers when fed “typical” 1957 and 1991 broiler diets. Poultry Sci. 73:1785-1794.
Havenstein, G. B., P. R. Ferket, S. E. Scheideler, and D. V. Rives. 1994b. Carcass composition and yield of 1957 vs. 1991 broilers when fed “typical” 1957 and 1991 broiler diets. Poultry Sci. 73:1795-1804.
Havenstein, G. B., P. R. Ferket, and M. A. Qureshi. 2003a. Growth, livability, and feed conversion of 1957 vs. 2001 broilers when fed “typical” 1957 and 2001 broiler diets. Poultry Sci. 82:1500-1508.
Havenstein, G. B., P. R. Ferket, and M. A. Qureshi. 2003b. Carcass composition and yield of 1957 vs. 2001 broilers when fed “typical” 1957 and 2001 broiler diets. Poultry Sci. 82:1500-1508.
Hazel, L. N. and E. A. Kline. 1952. Mechanical measurement of fatness and hog carcass value on live hogs. J. Anim. Sci. 11:313-318.
Hazel, L.N. and E.A. Kline. 1959. Ultrasonic measurements of fatness in swine. J. Anim. Sci. 18:815.
Hazzledine, M. and C. Whittemore. 2006. Diet formulation. In: I. Kyriazakis and C.T. Whittemore (ed.) Whittemore’s Science and Practice of Pig Production. 3rd ed. Blackwell Publishing Ltd, Oxford, UK.
Henderson, C. R. 1973. Sire evaluation and genetic trends. In: Proc. of the Anim. Breed. Genet. Symp. in Honor of Dr. J. L. Lush. Am. Soc. Anim. Sci., Champaign, IL. 10-41.
Hetzer, H.O., O.G. Hankins, J.K. King, and J.H. Zeller. 1950. Relationship between certain body measurements and carcass characteristics in swine. J. Anim. Sci. 9:37-47
Hovenier, A., E. Kanis, Th. Van Asseldonk and N. G. Westerink. 1992. Genetic parameters of pig meat quality traits in halothane negative population. Livest. Prod. Sci. 32:309-327.
Hudson, G. F. S. and B. W. Kennedy. 1985. Genetic trend of growth rate and backfat thickness of swine in Ontario. J. Anim. Sci. 61:92-97.
Huinker, D. 1979. What we have learned from central testing. Proc. of the National Swine Improvement Federation Annual Meeting. St. Louis, MO.
Johnson, Z. B., J. J. Chewning, and R. A. Nugent, III. 1999. Genetic parameters for production traits and measures or residual feed intake in swine. J. Anim. Sci. 77:1679-1685.
Kaplon, M. J., M. F. Rothschild, P. J. Berger, and M. Healey. 1991a. Genetic and phenotypic trends in Polish Large White nucleus herds. J. Anim. Sci. 69:551-558.
Kaplon, M. J., M. F. Rothschild, P. J. Berger, and M. Healey. 1991b. Population parameters for performance and reproductive traits in polish large white herds. J. Anim. Sci. 69:91-98.
Kempster, A. J., A. W. Dilworth, D. G. Evans and K. D. Fisher. 1986. The effects of fat thickness and sex on pig meat quality with special reference to the problems associated with overleaness 1. butcher and consumer panel results. Anim. Prod. 43:517-533.
Kendall, D. C., B. T. Richert, T. E. Weber, K. A. Bowers, S. A. DeCamp, A. P. Schinckel, and P. Matzat. 2000. Evaluation of genotype, strategic use of antibiotics and grow-finish management effects on lean growth rate and carcass characteristics. J. Anim. Sci. 77(Suppl. 2):39 (Abstr.).
Kennedy, B. W., K. Johansson, and G. F. S. Hudson. 1985. Heritabilities and genetic correlations for backfat and age at 90 kg in performance-tested pigs. J. Anim. Sci. 61:78-82.
Kennedy, B. W., V. M. Quinton, and C. Smith. 1996. Genetic changes in Canadian pig performance-tested pigs for fat depth and growth rate. Can. J. Anim. Sci. 76:41-48. Knap, P., A. William, and J. Solkner. 1997. Genetic parameters for lean meat content and
meat quality traits in different pig breeds. Livest. Prod. Sci. 52:69-73.
Kovac, M., and E. Goeneveld. 1990. Genetic and environmental trends in German swine herdbook populations. J. Anim. Sci. 68:3523-3535.
Krider, J. L., J. H. Conrad and W. E. Carroll. 1982. Formulating balanced rations for efficient production. Pages 555-561 in Swine Production. J. J. Corrigan and S. Wagley, ed. McGraw-Hill, Inc., New York, NY.
Lewis, A. J. 1991. Amino acids in swine nutrition. In: E. R. Miller, D. E. Ullrey and A. J. Lewis (ed.) Swine Nutrition. Butterworth-Heinemann, Stoneham, MA.
Lo, L. L., D. G. McLaren, F. K. McKeith, R. L. Fernando, and J. Novakofski. 1992. Genetic analysis of growth, real-time ultrasound, and pork quality traits in Duroc and Landrace pigs: II. heritabilities and correlations. J. Anim. Sci. 70:2387-2396.
Mabry, J. 2004. Comparison of commercial delivery systems for commercial swine production in Iowa. A. S. Leaflet R1943. Iowa State University Animal Industry Report. Iowa State Univ., Ames, IA.
Mantysaari, E. A., S. Haltia, and K. Aakula. 1994. Multitrait animal model evaluation for station tested pigs. Proc. 5th World Congr. on Genetics Applied to Livestock Production 17:406-408.
McConnell, J. C., K. M. Barth and S. A. Griffin. 1971. Nutrient digestibility and nitrogen metabolism at different stages of growth with fat and lean type swine fed two levels of protein. J. Anim. Sci. 32:654-657.
McLaren, D. G., J. Novakofski, D. F. Parrett, L. L. Lo, S. D. Singh, K. R. Neuman and F. K. McKeith. 1991. A study of operator effects on ultrasonic measures of fat depth and longissismus muscle area in cattle, sheep and pigs. J. Anim. Sci. 69:54-66.
Meeker, D. 1986. How central testing can improve pork value. Proc. of the National Swine Improvement Federation. St. Louis, Missouri.
Mersmann, H. J. 1982. Ultrasonic determination of backfat depth and loin area in swine. J. Anim. Sci. 58: 324.
Miller, D. 2000. 25 years of NSIF history. Proc. of the National Swine Improvement Federation Annual Meeting. Nashville, Tennessee.
Moeller, S. J. and L. L. Christian. 1998. Evaluation of the accuracy of real-time ultrasonic measurements of backfat and loin muscle area on swine using multiple statistical analysis procedures. J. Anim. Sci. 76:2503-2514.
Morris, A. J. and G. E. Pollot. 1997. Comparison of selection based on phenotype, selection index and best linear unbiased prediction using data from a closed broiler line. Brit. Poultry Sci. 1997 Jul; 38(3):249-54.
Mrode, R. A. and B. W. Kennedy. 1993. Genetic variation in measures of food efficiency in pigs and their genetic relationship with growth rate and backfat. Anim. Prod. 56:225-232.
National Pork Board. 2005. Quick facts: The pork industry at a glance. National Pork Board, Des Moines, IA #09133.
National Pork Producers Council (NPPC). 1995. Genetic Evaluation/Terminal Line Program Results. Ed. R. Goodwin and S. Burroughs. NPPC. Des Moines, IA.
Newcom, D. W., T. J. Baas and K. J. Stalder. 2003. Genetics of pork quality. Proc. of the National Swine Improvement Federation Annual Meeting. Des Moines, Iowa.
NRC. 1979. Nutrient Requirements of Swine (8th Ed.). National Academy of Sciences, Washington, DC.
NRC. 1998. Nutrient Requirements of Swine (10th Ed.). National Academy Press, Washington, DC.
O’Connell, M. K., P. B. Lynch and J. V. O. Doherty. 2005. A comparison between feeding a single diet or phase feeding a series of diets, with either the same or reduced crude protein content, to growing finishing pigs. Anim. Sci. 81:297-303.
Olsen, K. 1981. Swine artificial insemination and frozen boar semen. Duroc News. July 1981. p. 275-283.
Patience, J. F. and P. A. Thacker. 1989. Swine Nutrition Guide. Prairie Swine Centre, University of Saskatchewan, Saskatoon, Saskatchewan.
Pettigrew, J. E. and R. L. Moser. 1991. Fat in swine nutrition. In: E.R. Miller, D.E. Ullrey and A.J. Lewis (ed.) Swine Nutrition. Butterworth-Heinemann, Stoneham, MA. Phillips, J. 1980. Resume: the 1980 national central tested barrow show. Proc. of the National
Swine Improvement Federation Annual Meeting. St. Louis, MO. Pork’98 Staff. Artificial insemination use explodes. Pork’98. 18(9):52.
Quinton, M. and C. Smith. 1995. Comparison of evaluation-selection systems for maximizing genetic response at the same level of inbreeding. J. Anim. Sci. 73:2208-2212.
Quinton, M., C. Smith, and M. E. Goddard. 1992. Comparison of selection methods at the same level of inbreeding. J. Anim. Sci. 70:1060-1067.
Qureshi, M. A. and G. B. Havenstein. 1994. A comparison of the immune performance of a 1991 commercial broiler with a 1957 randombred strain when fed “typical” 1957 and 1991 broiler diets. Poultry Sci. 73:1805-1812.
Ramsey, C. B., E. R. Lidvall, and J. R. Conger Jr. 1972. Estimating loin eye area in swine with a single ultrasonic image. J. Anim. Sci. 35:1160-1165.
Robison, O. W. 1982. Role of central test stations in swine improvement. Proc. of the National Swine Improvement Federation Annual Meeting. Des Moines, IA.
Robison, O. W., L. L Christian , R. Goodwin, R. K. Johnson, J. W. Mabry, R. K. Miller and M.D. Tokach 2000. Effects of genetic type and protein levels on growth of swine. Proc. of the ASAS, Indianapolis, IN.
Rus, L. L. The central test station’s role in breeding purebred hogs. 1978. Pages 104-107 in Proc. of the National Swine Improvement Federation Annual Meeting. St. Louis, MO. Safranski, T. J. 1997. Artificial insemination in swine: A tool whose time has come.
University of Missouri-Columbia, Animal Sciences Departmental Report. p. 10. Schwab, C. R., T. J. Baas, K. J. Stalder, and J. W. Mabry. 2006. Effect of long-term selection
for increased leanness on meat and eating quality traits in Duroc swine. J. Anim. Sci. 84:1577-1583.
See, M. T. 1998. Evaluating machine and technician effects on ultrasonic measures of backfat and longissimus dorsi muscle depth in swine. Swine Health and Production. 6(2):61-66.
See, M. T. 2000. Selection for AI stud traits. Proc. of the National Swine Improvement Federation Annual Meeting. Nashville, Tennessee.
Skoch, E. R., S. F. Binder, C. W. Deyoe, G. L. Allee and K. C. Behnke. 1983. Effects of pelleting conditions on performance of pigs fed a corn-soybean meal diet. J. Anim. Sci. 57:922-928.
Smith, B. S., W. R. Jones, J. D. Hough, D. L. Huffman, W. B. Mikel, and D. R. Mulvaney. 1992. Prediction of carcass characteristics by real-time ultrasound in barrows and gilts slaughtered at three weights. J. Anim. Sci. 70:2304-2308.
.
Sorensen, D. A. 1988. Effect of selection index versus mixed model methods of prediction of breeding value on response to selection in a simulated pig population. Livest. Prod. Sci. 20:135-148.
Stahly, T. S., G. L. Cromwell and D. Terhune. 1988. Response of pigs from high and low lean growth genotypes to dietary lysine levels. J. Anim. Sci. 66(Suppl. 1):137 (Abstr.).
Stewart, T. S and A. P. Schinckel. 1989. Genetic parameters for swine growth and carcass traits. In: Young, L.D. (ed.) Genetics of Swine. USDA-ARS, Clay Center, NE, pp. 77-79.
Stouffer, J. R., M. V. Wallentine, G. H. Wellington and A. Diekmann. 1961. Development and application of ultrasonic methods of measuring fat thickness and rib-eye area in cattle and hogs. J. Anim. Sci. 20:759-767.
Sullivan, B. P. and R. Dean. 1994. National genetic evaluations for swine in Canada. Proc. 5th World Congress on Genetics Applied Livestock Production. 17:382-385.
Tokach, M., S. Dritz, B. Goodband and J. Nelssen. 1999. Phase feeding of finishing pigs. http://www.teagasc.ie/publications/pig1999/paper06.htm. Accessed 2/01/07.
USDA. 2001. Part 1: reference of swine health and management in the United States, 2000, National Animal Health and Monitoring System, Fort Collins, Co. #338.0801.
Vipperman, P. E. Jr., C. C. Brooks, R. F. Kelly, P. P. Graham and H. R. Thomas. 1963. Effect of dietary lysine levels on muscle size and composition in swine. J. Anim. Sci. 22:674-678.
Weber, T. E., A. P. Schinckel, K. L. Houseknecht, and B. T. Richert. 2001. Evaluation of conjugated linoleic acid and dietary antibiotics as growth promotants in weanling pigs. J. Anim. Sci. 79:2542-2549.
Witte, D. P., M. Ellis, F. K. McKeith, E. R. Wilson. 2000. Effect of dietary lysine level and environmental temperature during the finishing phase on the intramuscular fat content of pork. J. Anim. Sci. 78:1272-1276.
Whittemore, C. T. 2006a. Energy value of feed stuffs for pigs. In: I. Kyriazakis and C. T. Whittemore (ed.) Whittemore’s Science and Practice of Pig Production. 3rd ed. Blackwell Publishing Ltd, Oxford, UK.
Whittemore, C. T. 2006b. Pig meat and carcass quality. In: I. Kyriazakis and C. T. Whittemore (ed.) Whittemore’s Science and Practice of Pig Production. 3rd ed. Blackwell Publishing Ltd, Oxford, UK.
Williams, N. H., T. R. Cline, A. P. Schinckel and D. J. Jones. 1994. The impact of ractopamine, energy intake and dietary fat on finisher pig growth performance and carcass merit. J. Anim. Sci. 72:3152-3162.
Wondra, K. J., J. D. Hancock, K. C. Behnke, R. H. Hines, and C. R. Stark. 1995. Effects of particle size and pelleting on growth performance, nutrient digestibility and stomach morphology in finishing swine. J. Anim. Sci. 73:757-763.
CHAPTER 2
DIFFERENCES IN GROWTH PERFORMANCE, LEAN GROWTH
PERFORMANCE AND LEG STRUCTURE/MOBILITY OF COMMERCIAL PIGS REPRESENTATIVE OF 1980 AND 2005 GENETIC TYPES WHEN REARED ON
ABSTRACT
interactions were observed for ADG (NS) (P<0.05), ADG (OTS) (P<0.05), and LADG (OTS) (P<0.01) where 1980 vs. 2005 GS pigs showed increases of 7.0 vs. 12.6% in ADG (NS), 6.3 vs. 12.3% in ADG (OTS) and 7.0 vs. 17.0% in LADG (OTS) when fed 1980 vs. 2005 FP. Pigs from 2005 GS had greater (P < 0.01) ADG (NS and OTS), greater LADG (OTS and FSS), reduced (P < 0.01) ADFI (OTN), greater (P< 0.01) G:F (OTN, NS and OTS), and greater LG:F (OTS and FSS). Pigs fed 2005 FP had greater (P < 0.01) ADG (OTN, NS, and OTS), greater LADG (OTS), reduced (P < 0.01) ADFI (NS, OTS, and FSS), greater (P < 0.01) G:F (OTN, NS, and OTS), and greater LG:F (OTS and FSS). The 2005 GS pigs had larger (P < 0.01) LMA RTU at 40, 70, and 95 kg BW and less (P < 0.01) BF RTU at 70 and 95 kg BW than 1980 GS pigs. Pigs fed 2005 FP had larger (P < 0.01) LMA RTU at 45, 70, and 95 kg BW than pigs fed 1980 FP. Three evaluators scored structural correctness and mobility. Pigs from 2005 GS were more relaxed in their front leg and rear leg joints (P < 0.01) than 1980 GS pigs. A GS x FP interaction (P < 0.01) for mobility was observed where 2005 GS pigs fed 1980 FP were the most mobile while 1980 GS pigs did not differ between FP. Pigs from the 2005 GS and pigs fed the 1980 FP were more (P < 0.01) mobile than 1980 GS pigs and pigs fed 2005 feeding program, respectively. Changes in genetics over the past 25 yr have led to increased growth performance, lean growth performance, and improved leg structure/mobility. Feeding program changes over the same time period resulted in improved growth performance and lean growth performance with decreased mobility.
Introduction
1980 to 2005 in live weight at slaughter (109.8 to 122 kg), dressing percent (71 to 74.7%), and percent retail meat yield (55 to 58%).
Genetic trends from 1990 to 2000 in Swine Testing and Genetic Evaluation System (STAGES) records for the US swine breeds of Yorkshire, Duroc, Hampshire and Landrace show across breed improvements of -0.40 d/yr for days to 113.5 kg, 2.35g/d/yr for lean gain, -0.40 mm/yr for backfat, and 0.37 cm2/yr longissimus dorsi muscle area (Chen et al., 2002). Comparable improvements in growth, muscling and leanness were reported for the Canadian Swine industry during parts of the same time period (Hudson and Kennedy, 1985; Sullivan and Dean, 1994; Kennedy et al., 1996).
Studies conducted in the poultry industry evaluated contributions of genetic and nutritional changes to improvements observed in growth performance and carcass composition (Havenstein et al., 1994ab and 2003ab). They concluded that genetic, nutritional, and other management changes over the last 44 yr have reduced the time by two-thirds and feed intake by threefold required to produce a 1,815-g broiler. These authors concluded that 85 to 90% of the improvement in broiler growth rate and carcass composition over the past 45 yr was attributable to genetic improvements while 10 to 15% was due to changes in feeding programs. The authors also reported differences in leg problems observed in the 1991 study. A genetic strain x diet interaction was observed, where birds from the 1991 strain fed the 1991 diet had the greatest incidence of leg problems; these birds were also the fastest growing (Havenstein et al., 1994a).
The U.S. swine industry’s shift to confinement style slatted and hard-surfaced flooring has led to an increased need to emphasize feet and leg structure (Bereskin, 1979a). Selection for structural correctness is typically done in two ways, direct selection where animals that are deemed unsound are not selected and indirect selection where animals whose soundness reduces longevity will have less influence in the herd. Heritabilities and genetic correlations) indicate selection for ADG is favorable (Bereskin,1979b; NPPC, 1995) or does not affect structural correctness (Webb et al., 1983; Rothschild et al., 1988). Selection for BF, LMA or Days to 113 kg has no affect or reduces structural correctness.