Abstract
JOHNSON, JENNIFER LEE. Evaluation of Stormwater Wetland and Wet Pond Forebay Design and Stormwater Wetland Pollutant Removal Efficiency. (Under the direction of William F. Hunt, III.)
This thesis is the combination of two research studies involving stormwater wetlands and wet ponds. In the first study, forebays, designed to trap total suspended solids and dissipate inflow energy to stormwater wetlands and innovative wet ponds, were examined. Current forebay design standards in North Carolina arbitrarily size the surface area of wetland forebays to be 10% of the total surface area and the volume of wet pond forebays to be 30% of the total volume. Using this method to size forebays does not allow for variability in watershed characteristics, particularly projected sediment load. Between October 2004 and March 2006, 15 wetland and wet pond forebays in the North Carolina piedmont were surveyed. All sites are located in urban or suburban watersheds in either stable or unstable watersheds. The changes in the topography of the forebay bottom were digitized and analyzed for scouring and aggredation.
The surveys revealed that most forebays built in the last 10 years have not been sized according to the NCDENR standard; six of ten stormwater wetland forebays were oversized. The forebays did not adequately remove influent solids, as 11 forebays had a negative overall fill rate, indicating a net soil removal. Statistical analysis determined that the relative percent area of the forebay and stability of the watershed were the only factors affecting forebay fill rate. Watershed area, curve number and the number of runoff events between surveys did not impact the volume change of the forebays.
diameter. The sedimentation zone should include a long and shallow flow path to increase treatment time and reduce particle-settling distance. Engineers can use these new forebay-sizing guidelines to more accurately size forebays. These standards can also be used in scheduling maintenance for stormwater wetlands and wet ponds.
The second chapter of this thesis discusses two stormwater wetlands in North Carolina that were monitored for water quality. A wetland installed at the Bruns Avenue Elementary School in Charlotte, NC, was monitored from September 2004 – December 2005. The 6.4-ha watershed consists of a residential development and school property. Samples from 15 storms were analyzed for a variety of pollutants. Event mean concentrations (EMCs) and event mass loadings (EMLs) were determined for each storm.
The concentrations of all nutrient pollutants, including Total Nitrogen (TN), Total Kjeldahl Nitrogen (TKN) and total phosphorus (TP), fecal coliform (FC), total suspended solids (TSS), copper and zinc were significantly reduced during the monitoring period (p< 0.05). Growing season did not significantly (p<0.05) affect influent and effluent EMCs.
The Smithfield-Selma High School (SSHS) stormwater wetland captured runoff from the school’s 10.5-ha watershed. Monitoring of the wetland’s water quality treatment during base flow and storm flow events took place from December 2003, until February 2005. The SSHS wetland significantly (p<0.05) reduced the influent concentrations of NOB3PB
-P
-NOB2PB
-P
, NHB4PB
+
P
, TN, TKN, TP, POB4PB
3-P
the BES wetland, there was a significant (p<0.05) increase in the reduction of POB4PB
3-P
and TN during the dormant season. There was not a significant (p>0.05) seasonal difference for the other monitored parameters.
T
EVALUATION OF STORMWATER WETLAND
T
AND WET POND FOREBAY DESIGN
T
AND
T
STORMWATER WETLAND POLLUTANT
T
REMOVAL EFFICIENCY
T
by
T
JENNIFER LEE JOHNSONT
A thesis submitted to the Graduate Faculty of North Carolina State University
in partial fulfillment of the requirements for the Degree of
Master of Science
T
BIOLOGICAL AND AGRICULTURAL ENGINEERINGT
Raleigh, NC 2006
T
APPROVED BY:
T
__________________________________ _________________________________T
Dr. G. D. Jennings Dr. R. A. McLaughlin Department of Biological and Agricultural Engineering Department of Soil Science
To my family, for their constant love and support
To Matt, for making me laugh and not letting me give up
To my friends, for “not letting school get in the way of my education”
Engineering is a great profession. There is the satisfaction of watching a figment of the imagination emerge through the aid of science to a plan on paper. Then it moves to realization in stone or metal or energy. Then it brings homes to men or women. Then it elevates the standard of living and adds to the comforts of life. This is the engineer's high
privilege
-Herbert Hoover
I’m not an environmentalist. I’m an Earth warrior.
Biography
Jennifer Lee Johnson was born in Fort Huachuca, Arizona on July 21, 1982. Jenn is the oldest child of Brian and Cheryl Johnson and sister to Travis. Growing up, she lived in Arizona, Alabama and northern Virginia. At the age of 12, Jenn discovered her passion for environmental work while completing a science fair project on water filtration using sand and gravel filtration systems. Jenn graduated from high school in 2000 and then moved to Blacksburg, VA to become a Virginia Tech Hokie. During sophomore year, Jenn her changed major to Biological Systems Engineering and decided to focus on Land and Water Resources Engineering. After graduating from VT, she moved south to continue her education in the field of stormwater engineering at North Carolina State University.
Besides the environment, Jenn’s other interests include running, exploring the outdoors, spending time with friends and family, and taking care of animals.
Acknowledgements
The author would like to thank the many people who contributed to the success of this research project. First and foremost, the author would like to thank her advisor, Bill Hunt, for his unwavering support and direction through the entirety of this research project.
The author would like to thank the North Carolina State University Extension Agents Craven Hudson and Ken Bateman and the City of Charlotte Stormwater Services for their assistance in public relations and data collection. Also, thanks to Jonathan Smith and Jon Hathaway for coordinating with local government officials and voluntarily answering any question the author had.
The author would also like to thank those who helped with field research on the forebay chapter: Brandon Culberson, Mark Horseman, Mike Schaffer, Justin Spangler, Tiffany Bright and Dale Hyatt. This research could not have been completed without their willingness to get in the water and get dirty. In addition, the author thanks Eren Demirhan for guiding the author through the confusing world of statistical analysis.
Table of Contents
0HTU
LIST OF TABLESUT...252HIX
1HTU
LIST OF FIGURESUT...253HXIT
2HTU
EVALUATING FOREBAY DESIGN OF STORMWATER WETLANDS AND WET PONDSUT...254H1
3HTU
ABSTRACTUT...255H1
4HTU
1.UT TULITERATURE REVIEWUT...256H3
5HTU
1.1UT TUINTRODUCTION TO URBAN STORMWATERUT...257H3
6HTU
1.2UT TUSTORMWATER REGULATIONSUT...258H5
7HTU
1.3UT TUSTORMWATER WETLANDSUT...259H6
8HTU
1.3.1UT TUDesign of Stormwater WetlandsUT...260H6
9HTU
1.3.2UT TUWater Quality Benefits of Stormwater WetlandsUT...261H9
10HTU
1.4UT TUWET PONDSUT...262H10
11HTU
1.4.1 UT TUDesign of Wet PondsUT...263H11
12HTU
1.4.2UT TUWater Quality Benefits of Wet PondsUT...264H12
13HTU
1.5UT TUSEDIMENTATION IN BMPSUT...265H12
14HTU
1.6UT TUENERGY DISSIPATION IN BMPSUT...266H14
15HTU
1.7UT TUCURRENT FOREBAY SIZING GUIDELINES AND ISSUESUT...267H16
16HTU
2.UT TUOBJECTIVESUT...268H18
17HTU
3.UT TUMETHODS AND MATERIALSUT...269H19
18HTU
3.1UT TUDESCRIPTION OF FOREBAY SITESUT...270H19
19HTU
3.1.1UT TUHillandale Golf Course wetlandUT...271H21
20HTU
3.1.2UT TUWellington Forest wet pondUT...272H22
21HTU
3.1.3UT TUHuntington Ridge wet pondUT...273H23
22HTU
3.1.4UT TUAshbrook High School wetlandUT...274H24
23HTU
3.1.5UT TUGaston Day School wetlandUT...275H24
24HTU
3.1.6UT TUHunter Huss High School wetlandUT...276H25
25HTU
3.1.7UT TURankin Lake State Park wetlandUT...277H26
26HTU
3.1.8UT TUSmithfield-Selma High School wetlandUT...278H27
27HTU
3.1.9UT TUCentennial Middle School wetlandUT...279H27
28HTU
3.1.10UT TUCentennial Park and Ride wet pondUT...280H28
29HTU
3.1.11UT TUCollege of Veterinary Medicine wetlandUT...281H29
30HTU
3.1.12UT TUNorth Creek wetlandsUT...282H30
36HTU
4.UT TURESULTS AND DISCUSSIONUT...288H37
37HTU
4.1UT TUPHYSICAL PROPERTIES OF WETLAND AND WET POND FOREBAYSUT...289H37
38HTU
4.2UT TUFOREBAY VOLUME MONITORINGUT...290H39
39HTU
4.3UT TUFACTORS AFFECTING FOREBAY FILL RATEUT...291H41
40HTU
4.4UT TULOCATION OF SCOUR AND SEDIMENTATIONUT...292H45
41HTU
4.5UT TUFOREBAY MAINTENANCEUT...293H48
42HTU
5.UT TURECOMMENDATIONSUT...294H51
43HTU
5.1UT TUFOREBAY DESIGNUT...295H51
44HTU
5.1.1UT TUEnergy Dissipation ZoneUT...296H51
45HTU
5.1.2UT TUSedimentation ZoneUT...297H52
46HTU
5.1.3UT TUForebay Design Changes for Stable and Unstable WatershedsUT...298H53
47HTU
5.2UT TUFOREBAY MAINTENANCEUT...299H53
48HTU
5.3UT TURECOMMENDATIONS FOR FUTURE RESEARCHUT...300H54
49HTU
6.UT TUCONCLUSIONSUT...301H55
50HTU
REFERENCESUT...302H57T
51HTU
EVALUATION OF STORMWATER WETLAND POLLUTANT REMOVAL
EFFICIENCYUT...303H60
52HTU
ABSTRACTUT...304H60
53HTU
1.UT TUINTRODUCTIONUT...305H62
54HTU
2.UT TULITERATURE REVIEWUT...306H64
55HTU
2.1UT TUINTRODUCTION TO URBAN STORMWATERUT...307H64
56HTU
2.2UT TUSTORMWATER REGULATIONSUT...308H67
57HTU
2.3UT TUBEST MANAGEMENT PRACTICES (BMPS) IN NORTH CAROLINAUT...309H69
58HTU
2.4UT TUIN-DEPTH ANALYSIS OF STORMWATER WETLANDSUT...310H71
59HTU
2.5.1UT TUDesign and FunctionUT...311H71
60HTU
2.5.2UT TUConstructed Wetland ResearchUT...312H75
61HTU
3.UT TUOBJECTIVES AND HYPOTHESESUT...313H79
62HTU
4.UT TUMETHODS AND MATERIALSUT...314H81
63HTU
4.1UT TUSITE LOCATIONSUT...315H81
64HTU
4.2UT TUBRUNS AVENUE ELEMENTARY SCHOOL WETLAND,CHARLOTTE,NCUT...316H81
65HTU
4.2.1UT TUMonitoring SetupUT...317H83
66HTU
4.2.2UT TUEstimating pollutant concentrations for the local watershedUT...318H85
67HTU
4.3.1 UT TUMonitoring SetupUT...319H89
68HTU
4.4UT TUWATER QUALITY ANALYSISUT...320H90
69HTU
4.5UT TUSTATISTICAL ANALYSISUT...321H91
70HTU
5.UT TURESULTSUT...322H92
71HTU
5.1UT TUBRUNS AVENUE ELEMENTARY SCHOOL WETLANDUT...323H92
74HTU
5.2UT TUSMITHFIELD-SELMA HIGH SCHOOL WETLANDUT...326H105
75HTU
6.UT TUDISCUSSIONUT...327H111
76HTU
7.UT TURECOMMENDATIONS AND CONCLUSIONSUT...328H115
77HTU
8.UT TUREFERENCESUT...329H116T
78HTU
APPENDICESUT...330H119
79HTU
APPENDIX A. PRECIPITATION RECORDS WITH SURVEY DATESUT...331H120
80HTU
A.1UT TURALEIGH-DURHAM INTERNATIONAL AIRPORTUT...332H120
81HTU
A.2UT TUGASTONIA,NCUT...333H123
82HTU
A.3UT TUSMITHFIELD,NCUT...334H125
83HTU
APPENDIX B. SAS CODE TO DETERMINE FACTORS SIGNIFICANTLY
AFFECTING FOREBAY FILL RATEUT...335H127
84HTU
APPENDIX C: SAS OUTPUT TO DETERMINE FACTORS SIGNIFICANTLY AFFECTING FOREBAY FILL RATEUT...336H128
85HTU
APPENDIX D: 3-D SHADED MODEL AND PROFILE VIEW FOR EACH
FOREBAY SITEUT...337H130
86HTU
ASHBROOK HIGH SCHOOL WETLANDUT...338H130
87HTU
CENTENNIAL MIDDLE SCHOOL WETLANDUT...339H131
88HTU
CENTENNIAL PARK AND RIDEUT...340H132
89HTU
GASTON DAY SCHOOLUT...341H133
90HTU
HILLANDALE GOLF COURSEUT...342H134
91HTU
HUNTER HUSS HIGH SCHOOLUT...343H135
92HTU
NORTH CREEK LARGE WETLAND:PRIMARY FOREBAYUT...344H136
93HTU
NORTH CREEK LARGE WETLAND:SECONDARY FOREBAYUT...345H137
94HTU
NORTH CREEK SMALL WETLANDUT...346H138
95HTU
SMITHFIELD-SELMA HIGH SCHOOLUT...347H139
96HTU
FAUCETTE DRIVE (TENNIS CENTER)UT...348H140
97HTU
COLLEGE OF VETERINARY MEDICINEUT...349H141
98HTU
RANKIN LAKEUT...350H142
99HTU
HUNTINGTON SUBDIVISIONUT...351H143
100HTU
WELLINGTON SUBDIVISIONUT...352H144
101HTU
APPENDIX E. BES WETLAND WATER QUALITY ANALYSIS RESULTSUT...353H146
102HTU
APPENDIX F. BES STORMWATER WETLAND WATER QUALITY GRAPHSUT...354H150
103HTU
APPENDIX G. BES STANDARD PARALLEL PROBABILITY PLOTSUT...355H158
108HTU
I.1STORM EVENT DATAUT...360H166
109HTU
APPENDIX J. STANDARD PARALLEL PROBABILITY PLOTS FOR SSHS
WETLANDUT...361H171
110HTU
List of Tables
111HTU
TABLE 1.POLLUTANT EXPORT RATE FOR SEVERAL LAND USES WITH URBAN LAND USES
HIGHLIGHTED IN YELLOW (LINE ET AL.,2002)UT...363H4
112HTU
TABLE 2.CURVE NUMBERS FOR SELECTED LAND USES (USDA,1986)UT...364H9
113HTU
TABLE 3.STORMWATER WETLAND POLLUTANT REMOVAL PERCENTAGES (BROWN AND
SCHUELER,1997)UT...365H10
114HTU
TABLE 4.SURFACE AREA TO DRAINAGE AREA RATIO FOR PERMANENT POOL SIZING TO ACHIEVE
85%TSS POLLUTANT REMOVAL EFFICIENCY IN PIEDMONT,NC(NCDENR,2005)UT...366H12
115HTU
TABLE 5.EXAMPLE OF SCOUR HOLE DIMENSIONS PREDICTED BY EQUATION 3UT...367H16
116HTU
TABLE 6.FOREBAY SITE INFORMATIONUT...368H20
117HTU
TABLE 7.NUMBER OF MONTHS BETWEEN SURVEYS FOR EACH FOREBAYUT...369H34
118HTU
TABLE 8.SUMMARY OF WET POND AND STORMWATER WETLAND FOREBAY CHARACTERISTICSUT
...370H38
119HTU
TABLE 9.FILL RATES (MUPU
3
UPU
/YEAR) DURING EACH MONITORING PERIODUT...371H40
120HTU
TABLE 10.STATISTICAL SIGNIFICANCE OF FACTORS AFFECTING FOREBAY FILL RATEUT...372H42
121HTU
TABLE 11.MAXIMUM SCOUR HOLE DEPTH AS DETERMINED FROM SURVEY DATAUT...373H46
122HTU
TABLE 12.SCOUR DEPTH CALCULATED BY EQUATION 3UT...374H47
123HTU
TABLE 13.MINIMUM YEARS UNTIL FOREBAY MAINTENANCE IS REQUIREDUT...375H49
124HTU
TABLE 14.POLLUTANT EXPORT RATES FROM VARIOUS LAND USES IN NC(LINE ET AL.,2002)UT376H65
125HTU
TABLE 15.CURVE NUMBERS FOR SELECTED LAND USES (USDA,1986)UT...377H73
126HTU
TABLE 16.CONTRIBUTING WATERSHED CHARACTERISTICSUT...378H83
127HTU
TABLE 17.FLOW MONITORING EQUIPMENT INSTALLED AT THE BES WETLANDUT...379H84
128HTU
TABLE 18.AUTOMATIC SAMPLER SETTINGS FOR INLET AND OUTLET ISCO6712 SAMPLERSUT...380H85
129HTU
TABLE 19.POLLUTANT CONCENTRATIONS FOR VARIOUS LANDUSES USED TO ESTIMATE LOCAL WATERSHED POLLUTANT CONTRIBUTIONS AT BES STORMWATER WETLAND (NCDENR, 2005)UT...381H86
130HTU
TABLE 20.SUBWATERSHED AREAS FOR SSSH STORMWATER WETLANDUT...382H88
131HTU
TABLE 21.FLOW AND RAINFALL MEASUREMENT EQUIPMENT AT SSHS STORMWATER
WETLANDUT...383H90
132HTU
TABLE 22.WATER QUALITY PARAMETERS AT BOTH WETLAND SITESUT...384H91
133HTU
TABLE 23.STORM NUMBERS ASSIGNED TO EACH STORM EVENT AT THE BES WETLANDUT...385H94
134HTU
TABLE 24.EMCS AND STATISTICAL SIGNIFICANCE OF POLLUTANT CONCENTRATION
REDUCTIONS,NOT INCLUDING LOCAL WATERSHED CONTRIBUTIONSUT...386H95
135HTU
TABLE 25.EMCS AND STATISTICAL SIGNIFICANCE OF POLLUTANT MASS LOAD REDUCTIONSUT.387H97
136HTU
TABLE 26.CONCENTRATION EFFICIENCY RATIOS FOR GROWING AND DORMANT SEASONSUT...388H99
137HTU
TABLE 27.MASS EFFICIENCY RATIOS FOR GROWING AND DORMANT SEASONSUT...389H100
138HTU
TABLE 28.WATER QUALITY RESULTS INCLUDING THE MEAN POSSIBLE CONCENTRATION FOR THE LOCAL WATERSHEDUT...390H101
142HTU
TABLE 32.SUMMARY OF EFFICIENCY RATIOS FOR BES, HIGHLIGHTED VALUES ARE BEST
ESTIMATE OF BES REMOVAL EFFICIENCYUT...394H104
143HTU
TABLE 33.STORM FLOW EVENT DATES AND AMOUNTS AT SSHSUT...395H105
144HTU
TABLE 34.EMCS AND STATISTICAL SIGNIFICANCE OF POLLUTANT CONCENTRATION
REDUCTIONS AT SSHSUT...396H107
145HTU
TABLE 35.COMPARISON OF SSHS WETLAND REMOVAL EFFICIENCIES FOR BASE FLOW AND STORM FLOWUT...397H110
146HTU
TABLE 36.COMPARISON OF SSHS WETLAND REMOVAL EFFICIENCIES FOR DORMANT SEASON AND GROWING SEASONUT...398H110
147HTU
TABLE 37.COMPARISON OF BES AND SSHS WETLAND NUTRIENT REMOVAL TO PREVIOUS STUDIES AND NCDENR(2005) STANDARDUT...399H114
148HTU
TABLE 38.FLOW-WEIGHTED INFLUENT CONCENTRATIONS FOR THE FIRST EIGHT STORMS AT
BESUT...400H146
149HTU
TABLE 39.FLOW-WEIGHTED EFFLUENT CONCENTRATIONS FOR THE FIRST EIGHT STORMS AT
BESUT...401H146
150HTU
TABLE 40.FLOW-WEIGHTED INFLUENT CONCENTRATIONS FOR THE LAST SEVEN STORMS AT
BESUT...402H147
151HTU
TABLE 41.FLOW-WEIGHTED EFFLUENT CONCENTRATIONS FOR THE LAST SEVEN STORMS AT
BESUT...403H147
152HTU
TABLE 42.INFLUENT MASSES FOR THE FIRST EIGHT STORMS AT BESUT...404H148
153HTU
TABLE 43.EFFLUENT MASSES FOR THE FIRST EIGHT STORMS AT BESUT...405H148
154HTU
TABLE 44.INFLUENT MASSES FOR THE LAST SEVEN STORMS AT BESUT...406H149
155HTU
TABLE 45.EFFLUENT MASSES FOR THE LAST SEVEN STORMS AT BESUT...407H149
156HTU
TABLE 46.INFLUENT CONCENTRATIONS FOR THE FIRST NINE STORM EVENTSUT...408H161
157HTU
TABLE 47.EFFLUENT CONCENTRATIONS FOR THE FIRST NINE STORM EVENTSUT...409H161
158HTU
TABLE 48.INFLUENT CONCENTRATIONS FOR THE LAST ELEVEN STORM EVENTSUT...410H162
159HTU
TABLE 49.INFLUENT CONCENTRATIONS FOR THE LAST ELEVEN STORM EVENTSUT...411H162
160HTU
TABLE 50.INFLUENT CONCENTRATIONS FOR THE FIRST SEVEN BASE FLOW EVENTSUT...412H163
161HTU
TABLE 51.EFFLUENT CONCENTRATIONS FOR THE FIRST SEVEN BASE FLOW EVENTSUT...413H163
162HTU
TABLE 52. INFLUENT CONCENTRATIONS FOR BASE FLOW EVENTS 8-17UT...414H164
163HTU
TABLE 53.EFFLUENT CONCENTRATIONS FOR BASE FLOW EVENTS 8-17UT...415H164
164HTU
TABLE 54.INFLUENT CONCENTRATIONS FOR THE LAST EIGHT BASE FLOW EVENTSUT...416H165
165HTU
List of Figures
166HTU
FIGURE 1.LAYOUT OF STORMWATER WETLAND WATER ZONESUT...418H7
167HTU
FIGURE 2.FOREBAY DIAGRAM IDENTIFYING ENERGY DISSIPATION AND SEDIMENTATION ZONESUT419H8
168HTU
FIGURE 3. STORAGE DEPTHS IN A TYPICAL WET POND (NCDENR,2005)UT...420H10
169HTU
FIGURE 4.LARGER SOIL PARTICLES ARE DISTRIBUTED IN THE UPSTREAM AREA OF THIS
RALEIGH,NC, WET PONDUT...421H13
170HTU
FIGURE 5.FOREBAY DREDGING AT A RALEIGH,NC, WET PONDUT...422H17
171HTU
FIGURE 6.MAP OF FOREBAY SITESUT...423H19
172HTU
FIGURE 7.WETLAND FOREBAY AT HILLANDALE GOLF COURSEUT...424H22
173HTU
FIGURE 8.WELLINGTON FOREST SUBDIVISION WET POND INLETUT...425H22
174HTU
FIGURE 9.HUNTINGTON RIDGE SUBDIVISION WET POND, FOREBAY SHOWN AT TOP LEFTUT...426H23
175HTU
FIGURE 10.FOREBAY INLET CULVERT (INSTALLED AT TIME OF CONSTRUCTION)UT...427H23
176HTU
FIGURE 11.FOREBAY INLET (TOP) AT ASHBROOK HIGH SCHOOL WETLANDUT...428H24
177HTU
FIGURE 12.FOREBAY INLET AT GASTON DAY SCHOOL WETLANDUT...429H25
178HTU
FIGURE 13.FOREBAY INLET AT HUNTER HUSS HIGH SCHOOL WETLANDUT...430H25
179HTU
FIGURE 14.HUNTER HUSS HIGH SCHOOL WETLAND BEFORE PLANTING, OUTLET AT TOP LEFTUT431H26
180HTU
FIGURE 15.FOREBAY INLET (RIGHT) AND OUTLET (LEFT) AT KAGLOR BRANCH WETLANDUT...432H27
181HTU
FIGURE 16.FOREBAY INLET (RIGHT) AND POOL (LEFT) AT SMITHFIELD-SELMA HIGH SCHOOL WETLANDUT...433H27
182HTU
FIGURE 17.FOREBAY AT CENTENNIAL MIDDLE SCHOOL WETLANDUT...434H28
183HTU
FIGURE 18.WETLAND AT CENTENNIAL MIDDLE SCHOOL, FOREBAY IN FOREGROUNDUT...435H28
184HTU
FIGURE 19.FOREBAY AT CENTENNIAL PARK AND RIDE WET PONDUT...436H29
185HTU
FIGURE 20.FOREBAY AT VET MED WET POND, INLET AT TOPUT...437H30
186HTU
FIGURE 21.PRIMARY FOREBAY AT LARGE NORTH CREEK WETLANDUT...438H31
187HTU
FIGURE 22.SECONDARY INLET AND FOREBAY AT LARGE NORTH CREEK WETLANDUT...439H31
188HTU
FIGURE 23.FOREBAY AND POND AT FAUCETTE DRIVE WET POND, FOREBAY AT BOTTOMUT...440H32
189HTU
FIGURE 24.CULVERT INLET (CPR) AND RAISED CULVERT INLET (CMS)UT...441H39
190HTU
FIGURE 25.CHANNEL INLET (AHS)UT...442H39
191HTU
FIGURE 26.FOREBAY FILL RATES FOR EACH FOREBAYUT...443H41
192HTU
FIGURE 27.FOREBAY FILL RATE AS AFFECTED BY PERCENT AREA FOREBAYUT...444H45
193HTU
FIGURE 28.PROFILE VIEW (TOP) AND 3-D MODEL (BOTTOM) OF GASTON DAY SCHOOL
WETLANDUT...445H48
194HTU
FIGURE 29.OIL AND GREASE IN THE BES WETLANDUT...446H67
195HTU
FIGURE 30.LAYOUT OF STORMWATER WETLAND WATER ZONESUT...447H71
196HTU
FIGURE 31.STORMWATER WETLAND POLLUTANT REMOVAL MECHANISMS (NCDENR,2005)UT448H75
197HTU
FIGURE 32.MAP OF NORTH CAROLINA ILLUSTRATING STORMWATER WETLAND SITESUT...449H81
198HTU
FIGURE 33.BES WETLAND, DOWNSTREAM VIEW (PHOTO BY CITY OF CHARLOTTE
STORMWATER SERVICES)UT...450H82
203HTU
FIGURE 38.AERIAL PHOTOGRAPH OF SSSH WITH SUBWATERSHED DELINEATIONSUT...455H89
204HTU
FIGURE 39.TOTAL VOLUME AND RAINFALL AMOUNT FOR EACH MONITORED EVENT AT BESUT.456H93
205HTU
FIGURE 40.PERCENT REDUCTION OF FC AND E.COLI CONCENTRATIONS FOR THE SPECIFIED RAINFALL EVENTSUT...457H96
206HTU
FIGURE 41.PARALLEL PROBABILITY PLOT FOR NH4-N CONCENTRATIONSUT...458H98
207HTU
FIGURE 42.NHUBU4UPBU
+
UPU
PARALLEL PROBABILITY PLOTUT...459H108
208HTU
FIGURE 43.NOUBU3UPBU
-UPU
PARALLEL PROBABILITY PLOTUT...460H109
209HTU
FIGURE 44.INFLUENT AND EFFLUENT NHUBU4UPBU
+
UPU
-N CONCENTRATIONSUT...461H150
210HTU
FIGURE 45.INFLUENT AND EFFLUENT NHUBU4UPBU
+
UPU
-N MASSESUT...462H150
211HTU
FIGURE 46.INFLUENT AND EFFLUENT NO3+NO2 CONCENTRATIONSUT...463H151
212HTU
FIGURE 47.INFLUENT AND EFFLUENT NO3+NO2 MASSESUT...464H151
213HTU
FIGURE 48.INFLUENT AND EFFLUENT TKN CONCENTRATIONSUT...465H152
214HTU
FIGURE 49.INFLUENT AND EFFLUENT TKN MASSESUT...466H152
215HTU
FIGURE 50.INFLUENT AND EFFLUENT TN CONCENTRATIONSUT...467H153
216HTU
FIGURE 51.INFLUENT AND EFFLUENT TN MASSESUT...468H153
217HTU
FIGURE 52.INFLUENT AND EFFLUENT TP CONCENTRATIONSUT...469H154
218HTU
FIGURE 53.INFLUENT AND EFFLUENT TP MASSESUT...470H154
219HTU
FIGURE 54.INFLUENT AND EFFLUENT TSS CONCENTRATIONSUT...471H155
220HTU
FIGURE 55.INFLUENT AND EFFLUENT TSS MASSESUT...472H155
221HTU
FIGURE 56.INFLUENT AND EFFLUENT CU CONCENTRATIONSUT...473H156
222HTU
FIGURE 57.INFLUENT AND EFFLUENT CU MASSESUT...474H156
223HTU
FIGURE 58.INFLUENT AND EFFLUENT ZN CONCENTRATIONSUT...475H157
224HTU
FIGURE 59.NHUBU4UBU+ PARALLEL PROBABILITY PLOTUT...476H158
225HTU
FIGURE 60.NO3+NO2 PARALLEL PROBABILITY PLOTUT...477H158
226HTU
FIGURE 61.TKN PARALLEL PROBABILITY PLOTUT...478H159
227HTU
FIGURE 62.TN PARALLEL PROBABILITY PLOTUT...479H159
228HTU
FIGURE 63.TP PARALLEL PROBABILITY PLOTUT...480H160
229HTU
FIGURE 64.TSS PARALLEL PROBABILITY PLOTUT...481H160
230HTU
FIGURE 65. NHUBU4UPBU
+
UPU
CONCENTRATIONS AT SSHS WETLAND INLET AND OUTLET FOR ALL STORM EVENTSUT...482H166
231HTU
FIGURE 66.NOUPU
3-UPU
CONCENTRATIONS AT SSHS WETLAND INLET AND OUTLET FOR ALL STORM EVENTSUT...483H167
232HTU
FIGURE 67.TKN CONCENTRATIONS AT SSHS WETLAND INLET AND OUTLET FOR ALL STORM EVENTSUT...484H167
233HTU
FIGURE 68.TN CONCENTRATIONS AT SSHS WETLAND INLET AND OUTLET FOR ALL STORM EVENTSUT...485H168
234HTU
FIGURE 69.POUBU4UPBU
3-UPU
CONCENTRATIONS AT SSHS WETLAND INLET AND OUTLET FOR ALL STORM EVENTSUT...486H168
235HTU
FIGURE 70.TP CONCENTRATIONS AT SSHS WETLAND INLET AND OUTLET FOR ALL STORM EVENTSUT...487H169
236HTU
FIGURE 71.COPPER CONCENTRATIONS AT SSHS WETLAND INLET AND OUTLET FOR ALL STORM EVENTSUT...488H169
237HTU
FIGURE 72.ZINC CONCENTRATIONS AT SSHS WETLAND INLET AND OUTLET FOR ALL STORM EVENTSUT...489H170
238HTU
FIGURE 73.NHUBU4UPBU
+
UPU
PARALLEL PROBABILITY PLOT FOR SAMPLES TAKEN AT SSHSUT...490H171
240HTU
FIGURE 75.TKN PARALLEL PROBABILITY PLOT FOR SAMPLES TAKEN AT SSHSUT...492H172
241HTU
FIGURE 76.TN PARALLEL PROBABILITY PLOT FOR SAMPLES TAKEN AT SSHSUT...493H172
242HTU
FIGURE 77.POUBU4UPBU
3-UPU
PARALLEL PROBABILITY PLOT FOR SAMPLES TAKEN AT SSHSUT...494H173
243HTU
FIGURE 78.TP PARALLEL PROBABILITY PLOT FOR SAMPLES TAKEN AT SSHSUT...495H173
244HTU
FIGURE 79.COPPER PARALLEL PROBABILITY PLOT FOR SAMPLES TAKEN AT SSHSUT...496H174
245HTU
Evaluating Forebay Design of Stormwater Wetlands and Wet Ponds
U
Abstract
Wet ponds and stormwater wetlands have been shown to improve water quality of stormwater runoff. Stormwater wetlands and innovative wet ponds are designed with forebays to trap total suspended solids for subsequent removal and dissipate inflow energy. Current forebay design standards arbitrarily size the surface area of wetland forebays to be 10% of the total surface area and the volume of wet pond forebays to be 30% of the total volume. Using this method to size forebays does not allow for variability in watershed characteristics, particularly projected sediment load. Between October 2004 and March 2006, 15 wetland and wet pond forebays in the North Carolina piedmont were surveyed. All sites were located in urban or suburban watersheds in either stable or unstable watersheds. The changes in the topography of the forebay bottom were digitized and analyzed for scouring and aggredation.
Forebay design should include two zones for energy dissipation and sedimentation. The energy dissipation zone should consist of a preformed scour hole excavated next to the inlet; the hole should be between 50 mm and 400 mm deep, depending on culvert diameter, and have a diameter at least as large as the culvert diameter. The sedimentation zone should include a long and shallow flow path to increase treatment time and reduce particle-settling distance.
Literature Review Evaluating Forebay Design of Stormwater Wetlands
U
1. Literature
Review
1.1 Introduction to Urban Stormwater
The urbanization of natural watersheds negatively impacts water resources of the United States. Construction of roads, parking lots, and buildings decreases infiltration and evapotranspiration while increasing the volume and peak flow of stormwater runoff. Even vegetated areas in disturbed watersheds are less permeable because topsoil is often removed during construction revealing a compacted clay layer (Roesner, 1997).
A storm of greater than 2.5 mm (0.10 in.) is generally considered to produce runoff; however, storm intensity and duration, antecedent moisture conditions, and watershed characteristics all impact the amount of runoff generated by a precipitation event. The first flush phenomenon states that a majority of the pollutants in a watershed are washed away with the initial period of rainfall (Lee et al., 2002). Pollutants accumulating during dry periods are later washed away with initial runoff, creating a high concentration gradient of pollutants early in the precipitation event (Herricks, 1995). The first flush effect is often used as the justification for designing best management practices (BMPs) to capture and treat runoff from the first 25 to 38 mm (1.0 to 1.5 in.) of rainfall.
Line et al. (2002) attributed the high level of pollutant export to the increased development, higher runoff rates and decreased vegetation of urban areas.
Table 1. Pollutant export rate for several land uses with urban land uses highlighted in yellow (Line et al., 2002)
NO3-N TKN NH3-N TN TP TSS
Residential 2204 3.2 20.7 2.4 23.9 2.3 387 Golf course 1845 4.8 26.4 3.0 31.2 5.3 658
Pasture 2385 1.2 5.5 0.4 6.7 4.3 143
Construction - I 1251 1.4 6.9 0.6 8.3 3.0 22600 Construction - II 1031 7.3 29.0 4.1 36.3 1.3 6560
Wooded 1517 3.6 7.8 0.3 11.4 1.0 986
Multi-use urban N/A 5.1 25.4 3.2 30.5 3.0 2535
Pollutant Export Rate (kg/ha-a) Rain
(mm) Landuse
Research by Nelson and Booth (2002) identified that human activity in a watershed increases the annual sediment yield by nearly 50% due to soil surface erosion, channel-bank erosion and road-surface erosion in developing watersheds. Channel-bank erosion is caused by the increased frequency of peak flows associated with urbanization (Roesner, 1997). A study by Trimble (1997) in California determined stream channel erosion caused 2/3 of the total San Diego Creek watershed sediment yield between 1983 and 1993, a period of rapid urbanization. Additional sources of sediment in urban watersheds include car traffic, bare topsoil, and landscaping mulch (Nelson and Booth, 2002).
Literature Review Evaluating Forebay Design of Stormwater Wetlands
1.2 Stormwater Regulations
The federal government developed regulations in the early 1970s to address water quality issues. Originally known as the Federal Water Pollution Control Act Amendments, the Clean Water Act (CWA) of 1972 mandated the U. S. Environmental Protection Agency (EPA) to establish water quality guidelines for the waters of the United States. As part of the CWA, the National Pollutant Discharge Elimination System (NPDES) permit program targets pollutant removal from non-point sources including stormwater (U.S. EPA, 1996).
The NPDES program was implemented in two phases. Beginning in 1991, Phase I required NPDES permit coverage for municipalities with populations of 100,000 or more for municipal and industrial storm sewer discharges. This included the North Carolina metropolitan areas of Raleigh, Durham, Fayetteville/Cumberland County, Charlotte, Winston-Salem, and Greensboro. Phase II began in 1999 and expanded the permit program to include smaller communities and surface discharge of stormwater (U.S. EPA, 2000). As of 2006, 123 municipalities were targeted for Phase II permitting in North Carolina. These permits require the design and implementation of stormwater practices that reduce pollutants from post-construction runoff. Each designated community is required to have a stormwater best management plan that includes post-construction stormwater management in new developments and redevelopments.
requirement of BMPs is that 85% of total suspended solids (TSS) must be removed from post-construction runoff. To help developers meet this standard, the North Carolina Administrative Code (NCAC) states which BMPs have TSS removal efficiencies of 85% (NCDENR, 2005). Included among these BMPs are stormwater wetlands and wet ponds.
1.3 Stormwater Wetlands
Stormwater BMPs are designed to minimize flooding and improve water quality. Various BMPs use the following mechanisms to treat contaminents: sedimentation, filtration, adsorption, infiltration, microbial action, and nutrient uptake. Bioterention areas, green roofs, sand filters, stormwater wetlands, wet ponds, and grass swales are all urban stormwater BMPs used in North Carolina. Hunt (2000) and NCDENR (2005) recommended stormwater wetlands and wet ponds as cost-effective methods for treating stormwater pollutants such as total suspended solids (TSS) in watersheds exceeding 2.0 ha (5.0 acres).
U
1.3.1 Design of Stormwater Wetlands
Literature Review Evaluating Forebay Design of Stormwater Wetlands
Figure 1. Layout of stormwater wetland water zones
Exit to wetland / wet pond
Forebay
Inlet
Energy dissipation zone
TSS removal zone
Figure 2. Forebay diagram identifying energy dissipation and sedimentation zones
Stormwater wetlands can be sized based on the Natural Resources Conservation Service (NRCS) curve number equations, applicable for English units (Equations 1 and 2).
Runoff (in.) = (P – 0.2*S)P
2
P
/ (P + 0.8*S) (1)
Where : P = Precipitation (in.)
S = 1000 / CN – 10 (2)
CN = Curve Number
Literature Review Evaluating Forebay Design of Stormwater Wetlands
Table 2. Curve numbers for selected land uses (USDA, 1986)
A B C D
Open space (lawns, parks, golf courses, cemetaries)
Poor Condition (Grass Cover < 50%) 68 79 86 89 Fair Condition (Grass Cover 50% to 75%) 49 69 79 84 Good Condition (Grass Cover > 75%) 39 61 74 80 Paved Parking Lots, Rooftops, Driveways 98 98 98 98 Commercial and Business Districts 85 89 92 94 95
Industrial Districts 72 81 88 91 93
Residential Districts by average lot size
1/8 acre or less (town houses) 65 77 85 90 92 1/2 acre 25 54 70 80 85 1 acre 20 51 68 79 84
Cover Description
Average percent impervious
area
Curve Numbers for Hydrologic Soil Group
The storage volume of the wetland is calculated by multiplying the runoff (Eq. 1) by the watershed area (acres). Taking into account all of the wetland zones, the average water depth in a wetland is approximately 0.25 m (10.0 in.). Therefore, dividing the storage volume by 0.25 (SI units) or 10 (English units) determines the wetland surface area. The forebay area is sized as 10% of the wetland surface area.
U
1.3.2 Water Quality Benefits of Stormwater Wetlands
stormwater wetlands are credited with 40% nitrogen removal, the highest of any stormwater BMP (NCDENR, 2005). Because of this, stormwater wetland use in nutrient-sensitive watersheds, such as the Neuse and Tar-Pamlico River basins, is increasing.
Table 3. Stormwater wetland pollutant removal percentages (Brown and Schueler, 1997)
Pollutant Median pollutant removal percentage
TSS 78.0%
Total Phosphorus 51.0%
Ammonia-Nitrogen 43.0%
Nitrate-Nitrogen 67.0%
Total Khedjahl Nitrogen 14.5%
Total Nitrogen 21.0%
Copper 39.5%
Lead 63.0%
Zinc 53.5%
1.4 Wet Ponds
Literature Review Evaluating Forebay Design of Stormwater Wetlands
U
1.4.1 Design of Wet Ponds
Wet ponds are designed to capture the runoff volume expected from a watershed during a predetermined storm event (for example, the first 25 mm of a runoff event). The runoff volume from a storm enters the wet pond and replaces the old water; the “replacement volume” is detained in the wet pond until the next runoff event. Physical, biological, and chemical processes in the wet pond remove pollutants, including TSS, nitrogen and phosphorus. When the volume of a wet pond is larger and can hold a larger replacement volume, the removal rate of pollutants increases.
Table 4. Surface area to drainage area ratio for permanent pool sizing to achieve 85% TSS pollutant removal efficiency in piedmont, NC (NCDENR, 2005)
U
1.4.2 Water Quality Benefits of Wet Ponds
Wu and Holman (1996) determined the long-term pollutant removal efficiency of three Charlotte, North Carolina, wet ponds: TSS removal ranged between 41 and 93%, TP removal rates ranged between 36 and 45%, and TKN removal rates ranged between 21 and 32%. From this study, Wu and Holman (1996) determined that using 1-2% of a watershed as a wet pond significantly reduces pollutant loadings. NCDENR (2005) identified wet pond removal rates for TSS, N and P as 85%, 25% and 40%, respectively. The high sediment and nutrient pollutant removal efficiencies justify why wet ponds are the most frequently used BMP in NC.
Literature Review Evaluating Forebay Design of Stormwater Wetlands
capacity of the forebay. Excessive sedimentation can be problematic, particularly for BMPs designed for flood mitigation and water quality treatment.
Sedimentation basins are commonly used to capture sediment from construction sites. These basins, similar to forebays, are earthen embankments that capture and retain TSS and gross solids carried by stormwater runoff. The trapping efficiency of sediment basins has been extensively researched and can be applied to forebays. Rauch and Schreiber (1981) determined the trapping efficiency to be a function of the stormwater detention time, total storm runoff depth, and the mean discharge sediment concentration. Other research has found the trapping efficiency of a basin to be determined by particle size, mean velocity and basin geometry (Dendy, 1982, Braskerud, 2002). Field observations verify that larger particles settle closer to the inlet, while small particles are evenly distributed downstream (Figure 4) (Kao et al., 2001, Dendy 1982).
Figure 4. Larger soil particles are distributed in the upstream area of this Raleigh, NC, wet pond
and developed several recommendations to maximize TSS removal: (1) minimize the break-up of soil aggregates to increase the settling velocities of particles, (2) reduce runoff velocities as much as possible, (3) maximize wetland surface areas and utilize baffles, dams and stones when needed to increase to flow path, (4) ensure the water depth is shallow to reduce the settling distance and (5) maintain wetland vegetation to reduce resuspension of sediments. Jarrett (2001) conducted a study that compared the depth of the permanent pool with the sediment retention; by increasing the permanent pool from 0.15 m to 0.45 m, the sediment loss was cut in half. Another way to improve the sedimentation in a basin is to raise the outlet elevation high enough for the water to be free of settling solids (Hazman, et. al, 1989).
1.6 Energy Dissipation in BMPs
The forebay design goal of dissipating energy from influent water is equally as important as capturing sediment. High peak flows in urban watersheds increase the erosion potential at forebay inlets. Because the majority of TSS and gross solids is captured before the peak flow, any particles that have settled earlier may be resuspended. Several factors affect scour potential, including the culvert size, influent flow, time of concentration, and material particle size (Corry et al., 1983). Equation 3 is used to determine scour geometry in a cohesionless soil for a circular culvert flowing full:
Dimensionless Scour Geometry = Cs* Ch *(α / σ1/3P) * (Q / g
0.5
P
R2.5P)
β
P
Literature Review Evaluating Forebay Design of Stormwater Wetlands
WBsB = width of scour hole
LBsB = length of scour hole
CBsB = coefficient based on culvert slope
CBhB = coefficient based on culvert head above bottom surface α, β, θ = coefficients based on material size
σ = material size standard deviation Q = culvert discharge
g = acceleration due to gravity
R = hydraulic radius of culvert flowing full t = 30 min or the time of concentration, if longer
Examples of the scour hole dimensions predicted by this equation for several culvert diameters and a gravel material are presented in Table 5. This equation has not been tested in forebays or other basins lined with riprap. It is not recommended to apply this equation to BMP forebay design, unless the in-situ soil is sand or gravel.
Table 5. Example of scour hole dimensions predicted by Equation 3
Depth (m) Width (m) Length (m)
Volume (m)
0.00 0.05 0.19 0.17 0.05 0.07
0.15 0.05 0.28 0.13 0.06 0.05
0.30 0.05 0.29 0.13 0.07 0.05
0.61 0.05 0.31 0.13 0.07 0.05
0.00 0.10 0.38 0.35 0.09 0.14
0.30 0.10 0.57 0.25 0.12 0.10
0.61 0.10 0.58 0.25 0.14 0.10
1.22 0.10 0.62 0.25 0.14 0.10
0.00 0.21 0.75 0.69 0.19 0.28
0.61 0.21 1.13 0.51 0.24 0.20
1.22 0.21 1.16 0.51 0.27 0.20
2.44 0.21 1.25 0.51 0.29 0.20
0.00 0.31 1.13 1.04 0.28 0.42
0.91 0.31 1.70 0.76 0.36 0.30
1.83 0.31 1.73 0.76 0.41 0.30
0.00 0.42 1.50 1.39 0.37 0.56
1.22 0.42 2.27 1.01 0.48 0.41
2.44 0.42 2.31 1.01 0.55 0.41
1.22 0.15 0.30 0.61 0.91 Diameter
(m) Head (m)
Scour Hole Size Distance to
Max Depth (m)
1. Head = Distance from bottom edge of culvert to bottom surface of forebay
1.7 Current Forebay Sizing Guidelines and Issues
Literature Review Evaluating Forebay Design of Stormwater Wetlands
Maintenance is required in forebays that are filled with sediment to the point that its objectives are not being fulfilled. Removing the material is difficult and expensive; although, initially draining the forebay makes the process more feasible. Placement of dredged materials is problematic. They must be removed from the local area surrounding the wetland or wet pond, which can be expensive. For example, after being installed downstream of a construction site, a forebay in Raleigh, NC, completely filled with sediment requiring a contractor to remove the accumulated solids (Figure 5). Bids for the extensive sediment removal ranged between $26,000 and $50,000 (NCSU facilities, 2005).
U
2. Objectives
Methods and Materials Evaluating Forebay Design of Stormwater Wetlands
U
3.
Methods and Materials
3.1 Description of forebay sites
Nine wetland and six wet pond forebays were monitored between October 2004, and March 2006. The sites are located in urban areas in Gaston, Durham, Wake, and Johnston counties in North Carolina (Figure 6). Each site was constructed prior to the onset of this research.
Gaston County
Wake County Durham County
Johnston County Gaston County
Wake County Durham County
Johnston County
Figure 6. Map of forebay sites
Table 6. Forebay site information
Site Name Abbrev. BMP County Age (years)1
Watershed
Area (ha) CN Stability 2
Hillandale Golf
Course HILL Wetland Durham 5 90 88 Unstable Huntington
Subdivision HUNT Wet Pond Durham 2 19.2 83 Unstable Wellington
Subdivision WELL Wet Pond Durham 4 55 87 Stable Ashbrook High
School AHS Wetland Gaston 6 25 92 Stable Gaston Day School GDS Wetland Gaston 2 22 90 Stable Hunter Huss High
School HHHS Wetland Gaston < 1 24 89 Stable Rankin Lake State
Park RL Wetland Gaston 9 1700
3 87 Unstable
Smithfield-Selma
High School SSHS Wetland Johnston 5 29 87 Stable Centennial Middle
School CMS Wetland Wake 3 20 92 Stable
Centennial Park &
Ride CPR Wet Pond Wake 2 32 95 Unstable
College of Veterinary
Medicine VM Wet Pond Wake 3 28 91 Stable North Creek Large -
Forebay 1 NCL1 Wetland Wake 2 < 4.9 84 Stable North Creek Large -
Forebay 2 NCL2 Wetland Wake 2 < 4.9 84 Stable North Creek Small NCS Wetland Wake 2 1.2 79 Stable Tennis Center TC Wet Pond Wake 5 1.6 92 Unstable
1. Age = 2005 – [Year of Construction]
2. Stable watersheds have no active construction. Between 2 and 10% of unstable watersheds are under active construction.
3. Watershed sized for stream where wetland is located
Methods and Materials Evaluating Forebay Design of Stormwater Wetlands
as unstable, only a small percentage of land, between 2 and 10%, was undergoing active construction.
The forebays’ ages ranged from less than one to nine years old. For statistical analysis, the ages were divided into three categories: 0-2, 3-4 and 5 years or older. Since all sites were located in urban watersheds, the curve numbers ranged between 83 and 95. The sites with lower curve numbers had maintained at least a small percentage of vegetative cover, such as grass or woods, within the watershed. Details for each site are outlined in following sections.
U
3.1.1 Hillandale Golf Course wetland
Hillandale Golf Course is located in Durham, North Carolina. A wetland was constructed in 2001 to capture stormwater runoff from Interstate 85, residential neighborhoods, a parking lot and vegetated areas that leads to the property (Figure 7). The total watershed area is 36 ha (89 ac). During the study, Interstate 85 was under construction at the upstream end of the watershed.
There are three culverts that direct runoff into the 166-mP
2
P
(196 ydP
2
P
Figure 7. Wetland forebay at Hillandale Golf Course
U
3.1.2 Wellington Forest wet pond
A wet pond designed with a 545-mP
2
P
(652 ydP
2
P
) forebay was constructed in the Wellington Forest subdivision in Durham, NC, in 2001 (Figure 8). The contributing watershed is 22 ha (55 ac) of residential housing, roads, and lawns. There was no active construction. Two 0.9-m (3-ft) culverts and one riprap-lined swale carry stormwater into the forebay. The normal pool depth of this forebay approaches 1.2 m (4.0 ft).
Location of channel
Methods and Materials Evaluating Forebay Design of Stormwater Wetlands
U
3.1.3 Huntington Ridge wet pond
The Huntington Ridge subdivision, installed in 2004, is located in Durham, NC (Figure 9). The 7.8 ha (19.2 ac) drainage area is 27% impervious and includes houses, roads and areas of bare soil. The forebay is 484 mP
2
P
(588 ydP
2
P
) and has two inlets: a 0.61 m (2 ft) culvert installed with the wet pond and another 0.91m (3 ft) pipe installed post-construction. There is evidence of sedimentation in the smaller culvert (Figure10).
Figure 9. Huntington Ridge Subdivision wet pond, forebay shown at top left
U
3.1.4 Ashbrook High School wetland
Ashbrook High School is located in Gastonia, North Carolina. A wetland with a 70-mP
2
P
(84-ydP
2
P
) forebay was constructed in 2000 to capture the runoff from a 10-ha (25-ac) school property. The watershed is contains a multiple parking lots and rooftops (CN= 92), but there is no active construction. The forebay is circular in shape with an average normal pool depth of 0.53 m (Figure 11). There is a single inlet channel.
Figure 11. Forebay inlet (top) at Ashbrook High School wetland
U
3.1.5 Gaston Day School wetland
Gaston Day School is located in Gastonia, North Carolina. A wetland was constructed in July 2004 to capture the runoff from the stable 8.9-ha (22-ac) school watershed. Approximately 80% of the watershed area is parking lots, drive ways and rooftops while 20% remains vegetated. The forebay is 127 mP
2
P
(151 ydP
2
P
Methods and Materials Evaluating Forebay Design of Stormwater Wetlands
Figure 12. Forebay inlet at Gaston Day School wetland
U
3.1.6 Hunter Huss High School wetland
In May 2005, a wetland was constructed at Hunter Huss High School in Gastonia, North Carolina, to treat the runoff from the school’s 9.7-ha watershed. The watershed has several rooftops, parking lots and playing fields. One 1.1 m (3.5 ft) culvert, one (0.9) 3 ft culvert and one 0.45 m (1.5 ft) culvert carry runoff into the 179-mP
2
P
(214-ftP
2
P
) forebay (Figure 13). Both surveys were taken before vegetation was planted (Figure 14). The bare banks of the wetland were eroding near the inlet of the forebay.
Figure 14. Hunter Huss High School wetland before planting, outlet at top left
U
3.1.7 Rankin Lake State Park wetland
Rankin Lake State Park is located north of Gastonia, North Carolina, near Interstate 85. The wetland, constructed in April 1997, treats the out-of-bank storm events from nearby Kaglor Branch stream. The watershed is 688 ha (1700 ac), but only a portion of runoff during storm events flows is diverted from the stream through the wetland. Based on the watershed area, this wetland is grossly undersized. If this wetland were in in-line BMP, the watershed area would be closer to 75 acres, as opposed to 1700 acres (Hunt, 2000).
The watershed is 98% mixed urban land uses, including residential housing, roads and parks, and 2% active residential construction. The construction is located 400 m from the stormwater wetland. The 61-mP
2
P
(73-ydP
2
P
) forebay is rectangular in shape, with a sediment bar forming in the middle. The normal pool depth ranges from 0.91 m (3 ft) near the inlet to 0.15 m (6 in.) at the forebay outlet (Figure 15 left and right, respectively).
Location of channel
Methods and Materials Evaluating Forebay Design of Stormwater Wetlands
Figure 15. Forebay inlet (right) and outlet (left) at Kaglor Branch wetland
U
3.1.8 Smithfield-Selma High School wetland
Smithfield-Selma High School is located in Johnston County, NC. A wetland, built in 2001, captures the runoff from a large parking lot, rooftop, and grass fields. The total watershed (CN = 87) area is 11 ha (27 ac). There are two 0.46 m (18 in.) culverts that direct runoff into the 147-mP
2
P
- (176 ydP
2
P
) forebay inlet and a third inlet further downstream in the forebay that directs flow from the parking lot (Figure 16). The normal depth of the forebay is approximately 0.61 m (2.0 ft).
Figure 16. Forebay inlet (right) and pool (left) at Smithfield-Selma High School wetland
U
3.1.9 Centennial Middle School wetland
(60 in.) pipe directs the stormwater from the watershed to the 200-mP
2
P
(239 ydP
2
P
) forebay. There is no vegetation in the forebay, but the bottom is lined with riprap to prevent erosion. The forebay is separated from the wetland by a large riprap berm and two 0.46 m (1.5 ft) culverts. The normal pool depth is 0.83 m (2.8 ft).
Figure 17. Forebay at Centennial Middle School wetland
Figure 18. Wetland at Centennial Middle School, forebay in foreground
U
3.1.10 Centennial Park and Ride wet pond
Methods and Materials Evaluating Forebay Design of Stormwater Wetlands
implemented to prevent sediment transfer downstream; these include three bioretention areas in the parking lots and silt fences lining the construction site. The rectangular forebay has a single 0.91 m (3 ft) inlet culvert and has a nominal depth of 0.76 m (2.5 ft) (Figure 19).
Figure 19. Forebay at Centennial Park and Ride wet pond
U
3.1.11 College of Veterinary Medicine wetland
The College of Veterinary Medicine is located in southwest Raleigh, North Carolina. To capture the runoff from a 12-ha (30-ac) stable watershed containing several parking lots, rooftops, and a large pasture, a series of wet ponds with an upstream forebay was constructed in 2003. A 212-mP
2
P
(254 ydP
2
P
Figure 20. Forebay at Vet Med wet pond, inlet at top
U
3.1.12 North Creek wetlands
North Creek runs through the Centennial Campus of NCSU in Raleigh, NC. Constructed in 2004, two wetlands with forebays capture the runoff from several building sites and parking lots. The larger wetland treats stormwater from a 2.0-ha (4.9-ac) watershed, including the College of Textiles roof and lawn and the area surrounding the Engineering Graduate Research Center. It has two 0.61 m (2.0 ft) culverts directing flow into two individual forebays; the primary forebay is 207 mP
2
P
and has a contributing watershed of approximately 1.5 ha, while the secondary forebay is 62 mP
2
P
Methods and Materials Evaluating Forebay Design of Stormwater Wetlands
Figure 21. Primary forebay at large North Creek wetland
Figure 22. Secondary inlet and forebay at large North Creek wetland
U
3.1.13 Tennis Center wet pond
Figure 23. Forebay and pond at Faucette Drive wet pond, forebay at bottom
3.2 Precipitation Records
Daily precipitation amounts for the entire monitoring period were compiled from Weather Underground historical records at Raleigh-Durham International Airport, Gastonia, NC, and Smithfield, NC (H246HTUAppendix AUTH). Any precipitation event with rainfall greater than
Methods and Materials Evaluating Forebay Design of Stormwater Wetlands
3.3 Field measurements
This study was an assessment of forebay energy dissipation and sedimentation. Three comprehensive surveys topographically mapped the bottom surface of each forebay. A Sokkia Set 530RP
TM
P
total station and Carlson Explorer data collector with SurvCE version 1.50.006.10P
TM
P
were used to survey each site. Seven individuals initially assisted the survey process by holding the survey rod; however, two rod holders took the second and third surveys. Limiting the number of rod holders in the last two survey rounds minimized errors caused by different survey techniques.
Depending on the size and shape of each forebay between 50 and 150 points were surveyed during each site visit. Points were taken at every break in slope or approximately every 1.5 m (5 ft), whichever came first. After the initial survey, cross sections and benchmarks were flagged to ensure consistency during subsequent surveys. The number of cross sections per forebay varied depending on the size and shape of the forebay being surveyed. For example, CVM is a long and narrow forebay and required nine short cross sections, while CPR was wide and flat so it only required five cross sections. More detail was taken closer to the inlets because previous research indicated a majority of forebay function, including energy dissipation, occurs there.
The TC and WELL wet ponds had areas in the center of the forebay that were too deep (greater than 1.23 m) to be accurately surveyed. For these sites, as many points as possible were taken around the deepest area. Only regions of these two forebays with sufficient data points were used in further analyses.
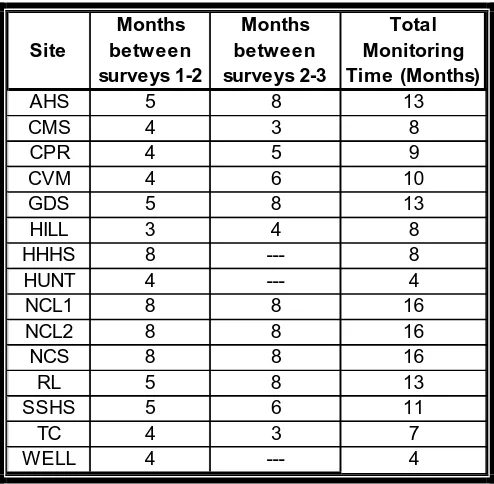
With the exception three forebays, three surveys were taken at each site; only two surveys were taken at HUNT, WELL and HHHS due to time constraints. It was the initial goal to have at least six months between each survey, but weather and scheduling during the monitoring period made this time variable. Table 7 outlines the time between surveys at each forebay site.
Table 7. Number of months between surveys for each forebay
Site
Months between surveys 1-2
Months between surveys 2-3
Total Monitoring Time (Months)
AHS 5 8 13
CMS 4 3 8
CPR 4 5 9
CVM 4 6 10
GDS 5 8 13
HILL 3 4 8
HHHS 8 --- 8
HUNT 4 --- 4
NCL1 8 8 16
NCL2 8 8 16
NCS 8 8 16
RL 5 8 13
SSHS 5 6 11
TC 4 3 7
Methods and Materials Evaluating Forebay Design of Stormwater Wetlands
3.4 AutoCADP ®
P
Analysis
Survey data were exported from the data collector and imported into AutoCADP
®
P
Land Desktop 3. To define each forebay, the surveys were converted to point groups and outer borders; a point group is a collection of the points taken in a single survey and the outer border is a line that connects the points around the forebay perimeter. AutoCADP
®
P
Land Desktop’s Terrain Model Explorer was used to create a forebay soil surface by interpolating the elevations between each survey point.
Data from the first survey was used to characterize the geometry of each forebay. The forebay surface area, wetland surface area, hydraulic length to width ratio and flow path length were measured using AutoCADP
®
P
. The hydraulic length is the flow path length between the forebay inlet and outlet. A line perpendicular to the hydraulic length was drawn at the length’s mid-point to determine the hydraulic width. If the hydraulic length to width ratio is less than one, the flow through the forebay is being “short-circuited.”
The volumetric difference between consecutive surveys was computed using the composite method in Terrain Model Explorer. The following is the definition of this tool as stated by AutodeskP
®
P
(2002):
When you calculate the volumes using this method, the Composite method
re-triangulates a new surface based on points from both surfaces. It uses the
points from both surfaces, as well as any location where the triangle edges
between the two surfaces cross. The command then calculates the new
composite surface elevations based on the difference between the elevations of
The composite method is identified as being the most accurate method to define the volume between two surfaces (AutodeskP
®
P
, 2002). To capture small elevation changes, the composite volume tool was programmed to observe 3 mm (0.01 ft) elevation differences.
The surfaces created by AutoCADP
®
P
were used in plotting longitudinal profiles of each forebay, from inlet to outlet. Areas of cut and fill within the forebay indicate locations of scour and accumulation.
3.5 Statistical Methods
The SAS System for Windows version 8.2P
®
P
was used to complete all statistical analyses in this chapter (2003). To account for variations in time between surveys, the fill rate between surveys was calculated by dividing the volume change by the number of days between surveys. The overall fill rate was the yearly average volume change over the monitoring period.
A general linearized model (GLM) was used to determine statistical significance (p < 0.05) of seven explanatory variables on the overall fill rate: (1) watershed size, (2) curve number, (3) watershed stability, (4) forebay size as a percentage of total wetland area, (5) flowpath length, (6) hydraulic length to width ratio and (7) number of runoff events between surveys.
Results and Discussion Evaluating Forebay Design of Stormwater Wetlands
U
4.
Results and Discussion
4.1 Physical Properties of Wetland and Wet Pond Forebays
Four measurements characterized the size and shape of each forebay (Table 8). Only two wetland forebays were sized as approximately 10% ± 1% of the wetland surface area, as recommended by NCDENR (2005). The mean forebay was sized as 17% of the wetland surface area with a standard deviation of 10%. Six of ten forebays were oversized compared to the 10% design guideline. The hydraulic length to width ratio ranged between 0.5 and 2.1, with a mean of 1.6. Most forebays had a ratio greater than 1, indicating longer flow paths and more opportunity for sedimentation. The recommended depth for a forebay is 0.6-0.9 m (2-3 ft), but the average depths in this study ranged between 0.2 and 0.9 m (NCDENR, 2005).
Table 8. Summary of wet pond and stormwater wetland forebay characteristics
Site BMP Hydraulic Length to Width Ratio
Flowpath Length
(m)
% Area Forebay
Avg Depth (m)
CPR 1.2 23 25% 0.7
CVM 3.1 32 22% 0.2
HUNT 1.5 22 38% 0.6
TC 0.8 15 20% 0.9
WELL 2.5 33 30% 1.1
AHS 1.5 11 6% 0.5
CMS 0.5 10 14% 0.8
GDS 2.8 23 18% 0.7
HHHS 0.6 10 11% 0.6
HILL 1.8 16 21% 0.2
NCL1 0.7 12 24% 0.8
NCL2 0.8 9 7% 0.8
NCS 1.4 11 41% 0.5
RL 3.3 27 9% 0.2
SSHS 1.3 15 17% 0.6
Mean 1.8 25 27% 0.6
Std. Dev. 0.9 8 7% 0.3
Median 1.5 23 25% 0.7
Mean 1.5 15 17% 0.6
Std. Dev. 1.0 6 10% 0.3
Median 1.4 12 15% 0.6
Wet Pond
Wet Pond
Wetland Wetland
Results and Discussion Evaluating Forebay Design of Stormwater Wetlands
Figure 24. Culvert inlet (CPR) and raised culvert inlet (CMS)
Figure 25. Channel inlet (AHS)
4.2 Forebay Volume Monitoring
Twelve forebay sites were surveyed three times, while the remaining three forebays were surveyed twice. AutoCAD Land Desktop was used to determine the volumetric difference between each survey. The volume change represents the net volume increase (positive change) or decrease (negative change); a volume change of 0 mP
3
P
(ydsP
3
P
For forebays with two surveys, the overall volume change will be equal to the volume change between the first and second survey. For forebays with three surveys, the overall volume change was not equal to the sum of the two volume changes between surveys due to small differences among the amount significant digits used by Terrain Model Explorer®.
The fill rates between surveys and overall fill rates were calculated by dividing the change in volume by the number of days between surveys (Table 9). Using the fill rate (mP
3
P
/day) instead of the volume change (mP
3
P
) accounts for the differences in the time between surveys.
Table 9. Fill rates (mP 3
P
/year) during each monitoring period
Site BMP Fill Rate 1-2 (m3/day)
Fill Rate 2-3 (m3/day)
Overall Fill Rate (m3/day)
CPR (0.069) (0.023) (0.031)
HUNT 0.011 --- 0.011
TC (0.033) 0.132 0.035
VM (0.070) 0.022 (0.037)
WELL (0.028) --- (0.028)
AHS 0.000 0.000 (0.002)
CMS (0.009) (0.019) (0.010)
GDS (0.029) 0.025 (0.002)
HHHS (0.010) --- (0.010)
HILL 0.000 0.018 0.018
NCL1 (0.058) 0.019 (0.034)
NCL2 (0.010) 0.006 (0.001)
NCS (0.032) (0.054) (0.037)
RL (0.007) 0.024 0.006
SSHS (0.081) 0.025 (0.019)
Wet Pond
Wetland
Results and Discussion Evaluating Forebay Design of Stormwater Wetlands
accumulated sediment and five forebays consistently lost sediment; the remaining eight sites lost soil in the first monitoring period and accumulated soil in the second monitoring period.
-0.10 -0.05 0.00 0.05 0.10 0.15
HILL HUNT WELL AHS GDS HHHS RL SSHS CMS CPR NCL1 NCL2 NCS TC VM
Site
F
ill
R
a
te
(
m
3 /d
a
y)
Fill Rate 1-2 (m3/day)
Fill Rate 2-3 (m3/day)
Overall Fill Rate (m3/day)
Figure 26. Forebay fill rates for each forebay
4.3 Factors affecting forebay fill rate
Multiple GLM analyses were required to determine which, if any, watershed or forebay characteristics affected the overall forebay fill rate (mP
3
P
The first GLM included seven factors: (1) watershed size, (2) curve number, (3) watershed stability, (4) forebay size as a percentage of total wetland/wet pond area (subsequently referred to as “percent area forebay”), (5) flow path length, (6) hydraulic length to width ratio, and (7) number of runoff events between surveys. From initial results it was determined that there was a correlation between flow path length and hydraulic length to width ratio; to minimize interaction, hydraulic length to width ratio was removed from future statistical analyses.
The second GLM included watershed size, curve number, watershed stability, percent area forebay, and flow path length as potential factors affecting forebay fill rate. The high p-value of flow path length (p = 0.92) determined that it did not significantly affect the fill rate, so it was removed from the model in subsequent analyses. Watershed size, curve number, watershed stability, percent area forebay, and number of runoff events between surveys were the variables included in the final GLM test.
Table 10. Statistical significance of factors affecting forebay fill rate
Factor P-value Significant? (P < 0.05)
Watershed area 0.2245 No
CN 0.1362 No
Percent Area Forebay 0.0195 Yes
Stability 0.0111 Yes
Number of Runoff Events 0.4636 No
Results and Discussion Evaluating Forebay Design of Stormwater Wetlands
Watershed area and land use (CN) are used in the sizing of wetland and wet pond surface areas. This may account for the lack of significant effect these factors have on the soil volume change within forebays. Additionally, a CN accounts for the decreased infiltration in a particular land use, but not the potential for sediment release from that land use. This emphasizes the need to consider the stability of a watershed when designing a forebay.
The GLM analyses reported that flow path length and hydraulic length to width ratio did not have a significant affect on forebay fill rate. Ten of the 15 forebays were hydraulically longer than wide, which makes finding a significant result difficult. Having more evenly distributed ratios would have made it easier to see if having hydraulically shorter forebays negatively impacted forebay fill rate. The most important finding from this result was that a majority of forebays are currently being designed with maximized flow paths, with do not negatively impact forebay fill rate.
Watershed stability had a significant affect on the daily forebay fill rate (p<0.02). Four out of five forebays in unstable watersheds had positive sediment accumulation. Because of the construction in the watershed, forebays in unstable watersheds can be assumed to have a higher influent concentration of TSS (Line et al., 2002). The single forebay located in an unstable watershed with a negative fill rate was CPR wet pond. This site had influent stormwater pretreated by bioretention areas, which are assumed to reduce TSS levels by 85% (NCDENR, 2005). This pretreatment was expected to decrease the CPR wet pond influent TSS concentration, reducing the potential for considerable sedimentation.