Development and evaluation of an automated streaming potential measurement device
30
0
0
Full text
(2) poly-(diallyldimethylammonium chloride) yielded curves that had shapes similar to those of parallel tests by micro-electrophoresis; however, the amount of titrant needed to reach the endpoints was about three times higher in the case of the streaming potential tests. The disagreement between the endpoints determined by the two types of test is attributed to a diffusion process of the titrant into the porous fibers.. Keywords: Streaming potential, zeta potential, cellulose fibers, titration, paper Contents of Paper Abstract Keywords Contents of Paper 1. Introduction 2. Experimental 2.1 Assembly and procedures for automated streaming potential measurement 2.2 Materials 2.3 Test procedures 3. Results 3.1 Output and reproducibility of signals 3.2 Effect of varying the applied pressure 3.3 Effect of varying the slurry solids and fiber type 3.4 Effects of cationic polymer at various pH levels 3.5 Effects of varying the electrical conductivity 4. Conclusions Acknowledgements References Figure Captions Figures. Colloids and Surfaces A, 194: 221-232 (2001). Page 2.
(3) 1. Introduction The electrokinetic condition of paper furnish, or more popularly, the zeta potential, has been postulated in recent years to be an important determinant in the papermaking process. Electrical properties of fiber surfaces have been reported to be controlling factors in the retention of pigments, dyes, internal sizing agents, and wet strength resins, in drainage, and in flocculation [1-8]. Various experimental techniques have been developed, based on four types of electrokinetic phenomena, electrophoretic mobility [6-9], electro-osmosis [10], streaming potential [11-12], and sedimentation potential [13]. The common feature is that all these methods involve relative motion between charged surfaces and a fluid medium, usually water [5,13]. Related methods include the electrophoretic mass transport analyzer [14-15], electrokinetic sonic amplitude [16], and polyelectrolyte titration with a colorimetric [17-18] or streaming current [19-20] endpoint. Compared to various other electrokinetic tests that have been used by papermakers, fiber-pad streaming potential tests offer some potential advantages. For one thing, the tests can be carried out with undiluted fiber slurry samples taken directly from a papermaking process [21-29]. Also, it is a potential advantage that the streaming potential signals originate at the surfaces of solids in the sample itself, not at a secondary surface as in the case of streaming current tests [19]. Because the measurements don’t involve light, there is no concern about focusing or the contamination of windows. Briefly stated, streaming potential tests involve forming a pad or plug, pumping aqueous solution (e.g. water from the process) through the pad or plug. The flow causes movement of counter-ions adjacent to the charged surfaces. The flow of ions yields an. Colloids and Surfaces A, 194: 221-232 (2001). Page 3.
(4) electrical potential that can be measured between electrodes on either side of the pad or plug. When reporting streaming potential data it is customary to also report the values of applied pressure and the conductivity of the solution. In an effort to relate their results to a more fundamental quantity, many authors have reported use of the Helmholtz-Smoluchowski equation [30-31] to convert streaming potential data into zeta potentials [21-29]. This approach is sometimes justified by correlations between zeta potentials calculated from streaming potential data vs. results of micro-electrophoretic mobility methods [12,32]. At its best, a fiber-pad streaming potential approach can provide an easy-to-use, simple, and practical way to monitor and control the paper machine wet-end [22-29]. Several computer-based online measurement devices have been investigated [26-28,33-35]. Some authors have objected that such use of the Helmholtz-Smoluchowski equation is unjustified [36-37]. The equation was derived for the case of cylindrical capillaries, a physical situation that is grossly different from the case of fiber pads. Not only is the flow pattern much more complex, but it is subject to change as the structure and density of a fiber pad respond to the applied pressure. If the flow is controlled by application of vacuum, then there is a further possibility that bubbles will form on the electrode probes and affect the signal [37]. Questions have been raised also about the influence of surface conductance and its effect on zeta potential determinations [38]. The effects of surface conductance on streaming potential data might be expected to change unpredictably with changes in fiber pad structure or density. Assuming that the density of the pad increases as a result of the pressure application, one also can expect a corresponding decrease in the average or characteristic pore size within the pad structure.. Colloids and Surfaces A, 194: 221-232 (2001). Page 4.
(5) It has shown that such effects can affect streaming potential measurements due to the differing degree of overlap of ionic double layers on the facing surfaces [39]. As a further complication, plots of measured streaming potential versus applied pressure usually fail to pass through the origin [40]. This tendency has been attributed to an asymmetry potential or “rest potential” between the sensing electrodes. To minimize the errors associated with asymmetry potentials it has been recommended to calculate zeta potentials from the slopes of a linear regression between streaming potential and differential pressure [41]. In light of these considerations it is perhaps not surprising that results from streaming potential tests sometimes correlate poorly with microelectrophoresis, regardless of how things are calculated [9,42]. A classic study by Bull [43] showed that zeta potentials calculated from streaming potential data agreed quantitatively with the results of microelectrophoresis only when (a) both tests were conducted in the same capillary cell, and (b) the surfaces of the suspended particles and the capillary walls were both well covered with a uniform layer of protein, eliminating the likelihood of chemical differences between the surfaces. The purpose of the present work was to develop and evaluate a new laboratory approach to the monitoring and control of electrokinetic properties of paper furnish. The result of this work is called the Streaming Potential Jar, or SPJ. The working hypothesis is that an especially stable and reliable measure of the colloidal charge state of aqueous slurries at increased electrical conductivity can be achieved with a system comprising the following elements:. Colloids and Surfaces A, 194: 221-232 (2001). Page 5.
(6) 1.. A system based on streaming potential measurements of the type in which events. at the surface of pulp fibers in the aqueous sample themselves give rise to the detected signals; 2.. Operation under pressure, rather than vacuum, to avoid generation of bubbles that. tend to interfere with electrokinetic measurements; 3.. Operation under conditions of pressure that amplify the original electrical signal. so that the device can be used at higher electrical conductivity levels where such signals tends to be weak; 4.. Automated subtraction of the potential measured at zero pressure in order to. minimize effects of asymmetry between the electrodes or their environments; 5.. Reliance on titration endpoints, rather than non-zero streaming potential values to. minimize problems associated with variable fiber pad structure and density, and chemical interferences; 6.. Semi-continuous mixing of a titrant with the slurry sample, together with. selection of titrant properties, to favor a uniform distribution of titrant onto the surfaces of the suspended solids.. Additional goals included automated measurement of a drainage rate, filtrate turbidity, and conductivity, all within the context of a user-friendly computer system for operations and data acquisition. The microelectrophoresis method was used for reference data. Microelectrophoresis has a more extensive and proven theoretical basis, compared to streaming potential tests [13,36-37]. Micro-electrophoresis also has been used by previous authors for. Colloids and Surfaces A, 194: 221-232 (2001). Page 6.
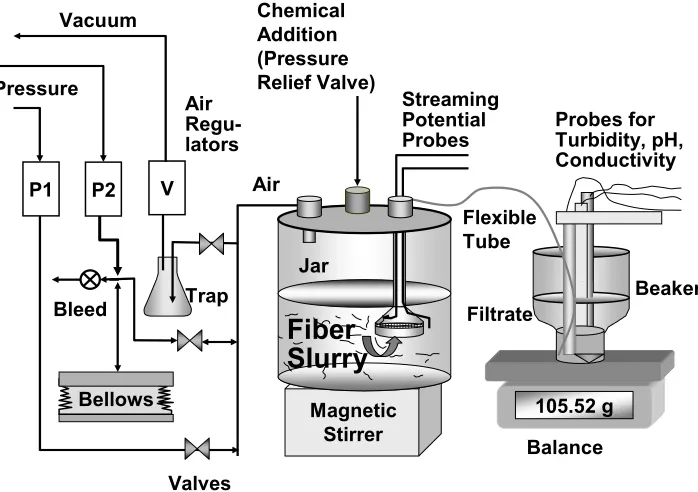
(7) determination of titration endpoints [6,44-45]. Despite its use here as a reference method, microelectrophoresis is not necessarily an ideal method for charge measurement of papermaking furnish. Factors tending to make microelectrophoresis less suitable for routine use in papermaking operations include its restrictions of particle size, a need for high dilution, and a high requirements for user skill and maintenance time.. 2. Experimental. 2.1 Assembly and procedures for automated streaming potential measurement. Figure 1 shows a schematic diagram of electronic components of the experimental system. The four main parts of the SPJ system are: (1) a computer equipped with a plugin data acquisition (DAQ) board, a general purpose interface bus (GPIB), and an AT serial card; (2) such commercial devices as a digital millivolt meter, a conductivity meter, a turbidity meter, and a pH meter, each with a probe or transducer to connect it to the wetted parts of the equipment; (3) the wet-end process itself, i.e. the streaming potential jar; and (4) signal conditioning. The system was controlled by LabVIEW (Laboratory Virtual Instrument Engineering Workbench). Like C or Basic, this is a general-purpose programming system with extensive libraries of functions. Measurements included streaming potential, filtrate mass (for drainage), turbidity (related to retention), conductivity, and pH. Data were collected and then output to the computer display. As shown in Fig. 2, 500 ml of the fiber slurry to be evaluated were placed in an 800 ml cylindrical jar. The contents were stirred continuously with a magnetic stirbar. Colloids and Surfaces A, 194: 221-232 (2001). Page 7.
(8) during each test. A 70 mesh stainless steel screen, having a circular opening with a diameter of 40 mm was attached to an inverted Büchner funnel within the jar. The jar was sealed except for the screen opening (connected through the lid), a pressure relief valve, and the air pressure control system. Experiments were set up so as to allow addition of titrants and other additives during times when the jar interior was at ambient pressure. Pressure and vacuum sequences were actuated by the DAQ system, using the valve arrangement illustrated in Fig. 2. A “high” level of pressure P1 was achieved with a conventional air pressure regulator. Rapid adjustment to a steady “low” pressure P2 was achieved with the combination of pressure regulator, air bleed, and bellows. The continued application of low pressure could be used when needed to maintain the integrity of the fiber pad during a critical part of the experiment. A value of P2=0 was selected for the work reported here. The function of vacuum system shown in Fig. 2 is to return filtrate to the test vessel for the next measurement. For a measurement cycle, a high pressure P1 was applied at first, then a low pressure P2, and then the vacuum valve was opened. The duration of pressure and vacuum applications were pre-set up to suit the drainage properties of various pulp samples. Changes in the relative electrical potential on the two sides of the screen were detected with 1.58 mm (1/16 “) diameter silver alloy wires (45% Ag, 30% Cu, 25% Zn). Voltage information was obtained with a GDM-8055 digital multi-meter, which had an electrical impedance rating of 1 GΩ over the range of use. In comparison, radiofrequency conductance values of the sample cell, with fibers included, were in the range. Colloids and Surfaces A, 194: 221-232 (2001). Page 8.
(9) of 50 to 2000 Ω over the course of the work. Output from the digital meter was transferred to data acquisition system and computer display. As shown at the right of Fig. 2, the amount of filtrate flowing through the mat was evaluated with an analytical balance. The collection system was set up so that filtrate properties such as turbidity, conductivity, and pH could be measured as soon as a relatively small amount of filtrate had passed through the fiber pad collected on the screen. These data, together with the electrical signals for evaluation of streaming potential, were evaluated with the data acquisition system. The HelmholtzSmoluchowski equation for zeta potential [30-31] was incorporated into the instrument’s software system, for optional use in future research. Electrical conductivity, pH, and turbidity tests were carried out during the period of time form T1 to T2 when low pressure P2 was applied. 2.2 Materials Pulps used in the study were southern U.S. bleached hardwood kraft pulp (HKP) and bleached softwood kraft pulp (SKP). The pulp was refined in deionized water at 1.56% consistency using a Valley type beater to a freeness value 270 ml in the case of HKP and 260 ml in the case of SKP. Each pulp was disintegrated in deionized water at 0.3% consistency just before the start of an experiment. For studies on the effects of salts and solution conductivity, sodium sulfate or sodium chloride solutions were added. Poly-(diallyldimethylammonium chloride) with an average molecular mass of 250,000 Daltons (poly-DADMAC, Aldrich Chemical Co., U.S.A) was used as the titrant.. Colloids and Surfaces A, 194: 221-232 (2001). Page 9.
(10) 2.3 Test procedures. Streaming potential tests were carried out with 500 ml samples of 0.3% solids fiber slurry. The applied pressure was 207 kPa (30 psi.) except where indicated otherwise. The durations of high pressure P1, low pressure P2, and vacuum applied periods were set at 30, 15, and 10 seconds, respectively. The rest time between successive measurements was set at various values, depending on the type of experiment. Data were collected for 10 seconds and averaged before and after the pressure was changed from its high to zero setting. The streaming potential value was taken as the millivolt reading at 207 kPa minus the reading at zero applied pressure. In the case of titration with poly-DADMAC, the polymer was added from the pressure relief valve port during the rest time, and the streaming potential before and after polymer addition was measured and recorded respectively. The pH of the furnish for measurements was in a range of 5.5 to 5.8, except where indicated otherwise. Zeta potential data were obtained with a Charge Analyzer 2 microelectrophoresis meter from SKS Associates. Tests were carried out with fresh filtrate obtained during the course of the corresponding SPJ tests.. 3. Results. 3.1 Output and reproducibility of signals. Colloids and Surfaces A, 194: 221-232 (2001). Page 10.
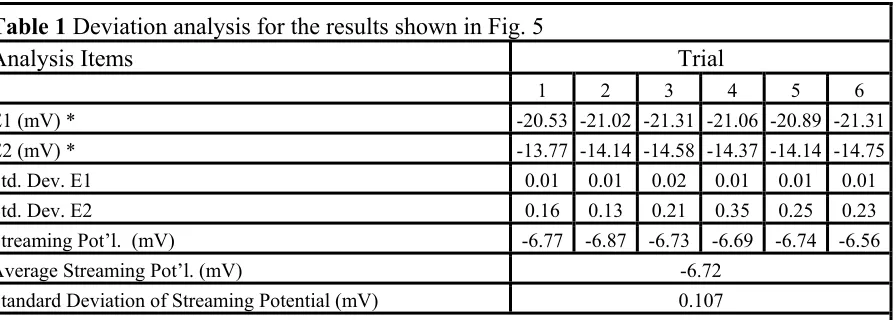
(11) Figure 3 illustrates typical data from measurements of streaming potential and drainage. As shown, when high pressure P1 was applied, the potential signal E1 was obtained and recorded, and the balance shown in Fig. 2 started to record the collected filtrate mass. When the pressure was lowered to P2 (set to zero), the reference potential signal E2 was obtained, and the filtrate mass remained at its maximum value. Drainage was defined as the difference of filtrate mass at T1 minus the corresponding value at T0, divided by the time from T0 to T1 (g/min). As shown in Fig. 3, the drainage rate decreased during each period of steady application of pressure. This is consistent with the build-up and densification of fiber pads. It is to be understood that drainage measurements are affected by the pressure applied and the filtering area of the screen, so the results reported here are unlikely to agree quantitatively with data from other methods. However, the simultaneous measurement of drainage, together with the other data, may be useful for judging the relative effects of chemical treatments. Figure 4 illustrates the reproducibility of the streaming potential signals. These data were obtained from six cycles of measurements with the same HKP fiber sample in a 0.01 M sodium sulfate solution. As shown, successive values of E1 and E2 gave highly repeatable results. Table 1 shows an analysis of these data. Within an individual test the standard deviation (SD) was no larger than 0.02 mV for the potential signal at high pressure (E1) and 0.35 mV at low pressure (E2), respectively. However, when comparing results of successive tests, the standard deviation of streaming potential was 0.10 mV and the average was –6.72 mV. The calculated relative deviation of streaming potential in the case considered was 1.5%, a typical value for tests reported in this article.. Colloids and Surfaces A, 194: 221-232 (2001). Page 11.
(12) 3.2 Effect of varying the applied pressure. Figure 5 shows an approximately linear relationship between streaming potential values and the applied pressure P1 – P2. The two sets of results shown correspond to experiments in 0.1N NaCl or Na2SO4 solutions, respectively. The pressure differential was adjusted within the range 65 to 275 kPa. Although the Helmholtz-Smoluchowski equation strictly applies to the case of simple capillaries [13,30,31], it is reasonable to expect that the same physical phenomena also govern streaming potential observations in packed beds or pads of fibers. The excellent linear regression fits are consistent with this supposition. However, the fact that the regression lines failed to pass through the origin suggests that the analogy between cylindrical capillaries and the present experiments is only approximate. As noted by Jayaweera and Hettiarachchi [41], a non-zero intercept is likely to result from asymmetry between the pair of electrode surfaces. In the present work one such asymmetry may result from the fact that only one of the metal probes is in contact with fibers. A further reason to expect some deviations from ideality is the fact that cellulosic fibers are compressing, causing a change in effective sizes of pores as a mat of fibers is subjected to varying levels of pressure. As noted by Ricq et al. [39] deviations from ideality increase with decreasing pore size due to increased overlap of ionic double layers on the facing surfaces and an increasing relative importance of surface conductivity. The practical implication of the relatively linear results in Fig. 5 is that it supports the use of data obtained at moderately high values of applied pressure, e.g. 207 kPa used in most of the work reported here. As will be shown, streaming potential values tend to. Colloids and Surfaces A, 194: 221-232 (2001). Page 12.
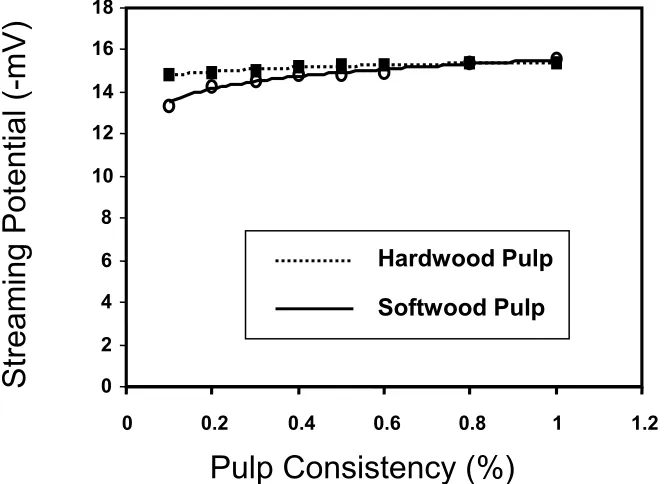
(13) decrease with increasing electrical conductivity of solutions, making the measurements more difficult. Fortunately, the random deviations of streaming potential signals also decreased with increasing electrical conductivity. Since the streaming potential signal is proportional to the pressure applied, a higher applied pressure tends to amplify the signal. It follows that the SPJ method may be advantageous for papermaking processes with relatively “closed” white water systems with correspondingly high electrical conductivities [46].. 3.3 Effect of varying the slurry solids and fiber type. A change in pulp consistency can be expected to have some effect on the density of fiber pads formed during a streaming potential test. Consequently, one might expect pulp consistency to affect the results of fiber-pad streaming potential tests [21,39,47]. To evaluate the suitability of the SPJ in various concentration of fiber slurry, both bleached hardwood kraft pulp (HKP) and softwood kraft pulp (SKP) with consistencies from 0.1% to 1.0% were compared. The effect of pulp consistency on streaming potential is shown in Fig. 6. It is interesting that the streaming potential of HKP was almost unchanged, while that of SKP was changed by less than 10% with changing pulp consistency in the given range. These results suggest that streaming potential was only weakly dependent on the structure of the fiber pads under the conditions of testing. Based on the results of Chang and Robinson [21] the lower absolute values of streaming potential measured at the lowest consistency conditions could be attributed to a lower density of the resulting fiber. Colloids and Surfaces A, 194: 221-232 (2001). Page 13.
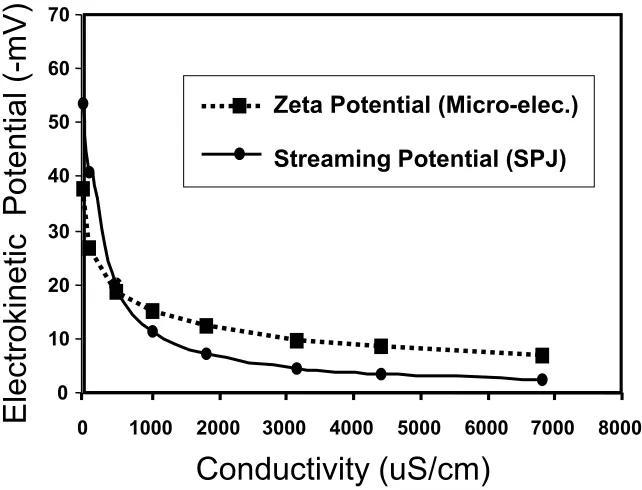
(14) pads. In summary, the SPJ appears to be well suited for typical headbox pulp consistencies or more dilute samples.. 3.4 Effects of cationic polymer at various pH levels. Figure 7 shows the changes in streaming potentials and titration endpoints as a function of pH. From Fig. 7 it is clear that the streaming potential titration endpoints changed greatly when pH increased from 3 to 4.6 but changed only slightly with increasing pH above 4.6. This phenomenon is only in rough agreement with the dissociation of carboxyl groups of hemicellulose in the fiber [48]. At pH values lower than 3, most of the carboxyl groups take on a proton and the charge on the fibers and fines becomes essentially zero. When the pH reaches 5, more than 65% of these carboxyl groups will become dissociated. Almost all the carboxyl groups will be ionized and contribute to the charge of fibers when pH is 7 or higher. Further work may be required to find out why the apparent charge of the fiber surfaces did not increase significantly in the intermediate range of pH. One possibility is that the fiber surfaces were already sufficiently anionic at pH 4.6 to be able to interact with all of the cationic titrant capable of fitting into the available space.. 3.5 Effects of varying the electrical conductivity. Figure 8 compares streaming potential data with zeta potentials obtained by the reference method, micro-electrophoresis. It is worth noting that the values obtained by. Colloids and Surfaces A, 194: 221-232 (2001). Page 14.
(15) the two methods are expected to have a linear relationship only when certain other variables are held constant [13]. One such variable is conductivity. As shown in Fig. 8, the streaming potential values obtained with the SPJ were affected to a greater relative extent by increasing electrical conductivity, compared to the zeta potential data. This trend is again consistent with common practices of evaluating streaming potential data [22-29,32-34]. The standard deviation among replicate determinations of migration time of individual particles was typically about 0.5 seconds, which corresponds to relative standard deviations of streaming potential in the range 0.5 to 20%. This source of deviation of the micro-electrophoresis data becomes more important at high absolute values of zeta potential and low conductivity, whereas convection currents are expected to affect measurements at the high end of the conductivity range [4]. Figures 9 and 10 show results of titrations of bleached hardwood kraft pulp measured with streaming potential and microelectrophoresis methods in different concentrations of sodium sulfate solution. First let us consider a relatively low salt concentration of 0.001N Na2SO4. As shown in Fig. 9, approximately three times as much titrant was required to achieve a zero signal in the case of the streaming potential tests, compared to parallel tests with micro-electrophoresis. This type of result also has been reported by Penniman [32], who attributed it to more rapid mutual diffusion of titrant to the fine materials, compared to the case of fibers having slower Brownian motion [see 49]. However, in the present case the pulp samples were well washed and relatively free of fine colloidal materials. Therefore, the rate of adsorption of polyelectrolytes is expected to be dominated by (a) flow phenomena, and (b) diffusion rates of just the titrant molecules [49]. By comparison to those rates it is assumed that Brownian. Colloids and Surfaces A, 194: 221-232 (2001). Page 15.
(16) diffusion of fibers and relatively large fiber fines can be neglected. It follows that transport of cationic titrant will occur at a nearly equal rate toward all of the solid surfaces, and the results in Fig. 9 must have some other explanation. Another way to account for the greater amount of cationic titrant to reach a zero value of streaming potential, compared to the microelectrophoresis test, involves the known surface areas [50] and porous nature of kraft fibers and fines [51-52]. Fiber fines have larger specific surface area than fibers [50]. Assuming a uniform rate of diffusion of titrant to all of the surfaces, more of the positively charged materials will be adsorbed onto the fines, per unit mass, when a titrant is added to a mixture of fines and fibers. The expected result is that the fines will most likely become saturated with titrant and neutralized much earlier than the fibers, after polymer addition. By contrast, the fiber surfaces offer a deeper, porous sink into which the titrant molecules may continue to diffuse [51-53]. Since the streaming potential method measures the whole pulp fibers, but the microelectrophoresis method measures only the fines that passed through the screen, the results in Fig. 9 are consistent with this explanation. As shown in Fig. 10, a ten-fold increase in salt concentration resulted in titration curves with a different characteristic shape. Results of both types of electrokinetic tests showed “plateau” features, as described earlier by Penniman [32] and Onabe [54]. In other words, the measured electrical potential values changed rapidly with the first small aliquots of titrant, but the output became much less sensitive to titrant addition in an intermediate range. Beyond the plateau, the electrokinetic potential values again responded to titrant addition more rapidly and passed through zero. Tentatively, these. Colloids and Surfaces A, 194: 221-232 (2001). Page 16.
(17) results are attributed to a process of penetration of titrant into pores of the cellulosic materials, after the sites of highest anionic charge on the surface have been satisfied. Comparing Figs. 9 and 10, the titration endpoint of hardwood pulp with polyDADMAC were significantly affected by the concentration of sodium sulfate. To neutralize the charge of the whole pulp and to reach at endpoint, the amount of polyDADMAC titrant required increased with increasing salt concentration. The dosage of poly-DADMAC required for neutralization was 30, 70, and 96 µeq/g pulp in 0.001, 0.005, and 0.01 M Na2SO4, respectively. This greater demand for titrant at the higher salt concentration is consistent with the expected lower radius of gyration of the polyelectrolytes, making them able to penetrate into a much higher fraction of the available pores [51-52]. Alternatively, the effect also is consistent with an expected three-dimensional conformation of adsorbed polyelectrolytes at intermediate ranges of electrical conductivity [55-57]. The present results do not yet provide a way to discriminate between these two explanations. It is interesting to compare the amounts of adsorbed polyDADMAC in the present work with previous estimates of cellulose fiber charge. For example, Öhman et al. [58] estimated a charge density of about 4 µeq/g of charge at the surface of bleached softwood kraft fibers, based on poly-DADMAC adsorption tests in distilled water. This relatively low number, compared to the present work, is consistent with a highly extended conformation at very low ionic strength and a tendency to adsorb with 1:1 stoichiometry on the outer surface of fibers under those conditions [59]. The higher numbers obtained in the present case are also consistent with (a) a lower mass of poly-DADMAC, (b) a somewhat higher carboxyl content in bleached hardwood kraft pulp, compared to. Colloids and Surfaces A, 194: 221-232 (2001). Page 17.
(18) softwood, and (c) the fact that the fibers were refined [60]. By contrast Herrington et al. [61] measured between 40 and 100 µeq/g of carboxyl groups associated with bleached hardwood kraft samples. These relatively higher numbers are consistent with the potentiometric titration procedures used and the ability of small ions to penetrate into pores that are not easily accessible by polyelectrolytes.. 4. Conclusions. A pressurized and automated streaming potential measurement device was developed and tested for laboratory research, and the device showed good reproducibility for electrokinetic measurements. Within a range of solution conductivities between 0.5 and 10 mS/cm, the relative standard deviation among repeated measurements with the SPJ was consistently below 3%. The magnitude of streaming potential values varied linearly with applied pressure, and it was a weak function of the solids content of the fiber slurries. These facts are consistent with some practical uses of the Helmholtz-Smoluchowski equation. Further work is needed to determine the extent to which values calculated from the HelmholtzSmoluchowski equation are proportional to zeta potentials determined by microelectrophoresis over a range of conditions, including changes in electrical conductivity. Though the Helmholtz-Smoluchowski equation was derived for the case of cylindrical capillaries, the same equations have become widely used in practical fiber-pad streaming potential devices. The results also help to justify the use of the SPJ within the range of applied pressures used in this work.. Colloids and Surfaces A, 194: 221-232 (2001). Page 18.
(19) Streaming potential results responded in qualitatively reasonable ways to changes in pH, electrical conductivity, and the addition of a cationic titrant. The fact that the apparent surface charge increased greatly in the pH range between 3 and 4.6, but only slightly at higher pH values suggests that surface charge density was not the only factor governing adsorption of the oppositely charged polymer. Rather, the degree of dissociation of carboxyl groups at the fiber surfaces probably was sufficient at pH 4.6 and above to provide anchoring sites for the maximum amount of poly-DADMAC able to fit within the available space. This phenomenon deserves further study. The titration endpoints determined by the SPJ streaming potential method differed by a factor of three or four, compared to endpoints determined by micro-electrophoresis of filtrate obtained during the same SPJ tests. These results are in qualitative agreement with earlier studies [9,32]. The phenomenon is attributed to a much higher surface area per unit mass of fine material, allowing the fines to more quickly become saturated with titrant that is diffusing at a given rate from the bulk solution to all of the surfaces. It is proposed that the longer fibers, which mainly are sensed by the fiber-pad streaming potential tests, maintain a net negative electrokinetic charge at higher titrant addition levels to mixed furnish because of continual diffusion of the polyelectrolytes into the fine pores in the cell walls. Acknowledgements Financial support for this project was received from the TAPPI Foundation. Katya Prince provided the computer programming.. Colloids and Surfaces A, 194: 221-232 (2001). Page 19.
(20) References [1] R. A. Stratton, J. W. Swanson, Electrokinetics in papermaking-a position paper, Proc. TAPPI Annual Meeting, Tappi Press, Atlanta, 1980, pp. 93-100. [2] T. Lindström, Electrokinetics in the Paper Industry, in Paper Chemistry, J. C. Roberts, Ed., Blackie, London, 1991, 25-43. [3] H. Tanaka, Paper, in Electrical Phenomena at Interfaces, Dekker, New York (1998), Ch. 19, 389-404. [4] M. A. Hubbe, Selecting and Interpreting Colloidal Charge Measurements, in Proc. Scientific & Technical Advances in Wet End Chemistry, Barcelona, Spain, PIRA Intl., Leatherhead, 2000. [5] R. W. Davison, Electrokinetic effects in papermaking processes, Tappi 57 (12) (1974) 85-89. [6] E. Strazdins, Factors affecting the electrokinetic properties of cellulose fibers, Tappi 55 (12) (1972) 1691-1695. [7] E. Strazdins, Surface chemical aspects of polymer retention, Tappi 57 (12) (1974) 76-80. [8] M. J. Jaycock, J. L. Pearson, Colloidal aspects of paper formation, Svensk Papperstidning 78 (5) (1975) 167-171; 78 (8) (1975) 289-294. [9] N. D. Sanders, J. H. Schaefer, A comparison of zeta potential distribution and colloid titration of papermaking materials: Particle surface charge vs. polyelectrolyte adsorption, Proc. TAPPI 1992 Papermakers Conf., TAPPI Press, Atlanta, 1992, 463-472. [10] A. J. Hinton, M. Quinn, Fiber surface characteristics as they affect two-sided dyeing of paper, Paper Technol. 5 (1) (1964) 60-64. [11] M. Y. Chang, A. A. Robertson, Flocculation studies of the suspensions: Influence of zeta potential, Pulp Paper Mag. Can. 66 (9) (1967) 438-444. [12] M. J. Jaycock, J. L. Pearson, J.L., A study of the retention of pigment during paper formation, J. Colloid Interface Sci. 55 (1) (1976) 181-190. [13] R. Hidalgo-Alvarez, On the conversion of experimental electrokinetic data into double layer characteristics in solid-liquid interfaces,” Adv. Colloid Interface Sci. 34 (1991) 217-341. [14] P. Sennett, J. P. Olivier, H. H. Morris, Electrokinetic effects in paper coating colors, Tappi 52 (6) (1969) 1153-1156. [15] K. W. Britt, J. E. Unbehend, Electrophoresis in paper stock suspensions as measured by mass transport analysis, Tappi 57 (12) (1974) 81-84. [16] A. M. Springer, T. E. Taggart, Quantitative evaluation of alternative methods of determining total charge, Tappi J. 69 (5) (1986) 116-121. [17] M. A. Hubbe, A modified reporting procedure for polyelectrolyte titrations, Tappi 62 (8) (1979) 120-121. [18] H. Tanaka, Y. Sakamoto, Polyelectrolyte titration using fluorescent indicator І. Direct titration of anionic and cationic polyelectrolytes with 10-4 N standard solution, J. Polym. Sci. Part A: Polymer Chemistry 31 (1993) 2687-2691. [19] D. L. Kenaga, W. A. Kindler, F. J. Meyer, Studies of adsorption of cationic polyelectrolytes on pulp using streaming current detector, Tappi 50 (7) (1967) 381387.. Colloids and Surfaces A, 194: 221-232 (2001). Page 20.
(21) [20] L. Bley, Measuring the concentration of anionic trash-the PCD, Paper Technol. 33 (4) (1992) 32-37. [21] M. Y. Chang, A. A. Robertson, Zeta potential measurements of fibers. DC streaming current method, Can. J. Chem. Eng. 45 (2)(1967) 66-71. [22] G. Mugler, P. Mugler, First practical applications of a laboratory apparatus for determination of zeta potential by the streaming potential principles with papermaking fiber furnishes, Zellstoff Papier 25 (5) (1976) 137-143. [23] J. Schurz, V. Ribitsch, H.-J. Jacobasch, Zeta potential as a means of characterizing surfaces, Wochenbl. Papierfabr. 117 (11/12) (1989) 525-529. [24] E. Poppel, Zeta potential in the basic processes of papermaking, Zellstoff Papier 23 (2) (1974) 55-58. [25] J. G. Penniman, A new on-line zeta potential instrument, the Zeta Data®, Proc. TAPPI 1988 Papermakers Conf., TAPPI Press, Atlanta, 1988, 21-25. [26] R. Richter, E. Rohloff, H. Tretter, F. Müller, J. G. Penniman, A new apparatus for automatic streaming potential measurement on the paper machine, Wochenbl. Papierfabr. 117 (15) (1989) 682-686. [27] B. A. Nazir, An on-line streaming potential meter (SPM)—wet-end applications, Paper Technol. 35 (3) (1994) 28-35. [28] T. Miyanishi, On-line zeta potential analyses of a fine paper machine and a newsprint paper machine, Tappi J. 78 (3) (1995) 85-91. [29] B. Thiele, J. W. Kopp, Charge balances of paper machine systems – a method of process optimization, Wochenbl. Papierfabr. 125 (11/12) (1997) 542-556. [30] H. Helmholtz, Studies of the electrical surface layers, Wied. Ann. Physik Chemie Ser. 3, 7 (1879) 337-382. [31] M. Smoluchowski, Contribution to the theory of electro-osmosis and related phenomena, Bull Intern. Acad. Sci. Cracovie (1903) 184-199. [32] J. G. Penniman, Comparison of pulp pad streaming potential measurement and mobility measurement, Tappi J. 75 (8) (1992) 111-115. [33] V. Hand, J. Koethe, An evaluation of two pad-forming paper stock charge analyzers, Proc. TAPPI 1993 Papermakers Conf., TAPPI Press, 1993, 591-598. [34] J. Penniman, The benefits of automatic zeta potential and drainage measurement, Paper Technol. 34 (11) (1993) 18-19. [35] M. A. Hubbe, Method and apparatus for measuring an electrical property of papermaking furnish, US Patent 5,936,151, 1999. [36] E. Strazdins, Critical issues in applying electrokinetics to papermaking, Tappi J. 78 (8) (1995) 115-119. [37] M. J. Jaycock, Assumptions made in the measurement of zeta-potential by streaming current/potential detectors, Paper Technol. 36 (7/8) (1995) 35-38. [38] T. G. M. Van de Ven, Effect of fiber conductivity on zeta potential measurements of pulp fibers, J. Pulp Paper Sci. 25 (7) (1999) 243-245. [39] L. Ricq, A. Pierre, J.-C. Reggiani, J. Pagetti, A. Foissy, Use of electrophoretic mobility and streaming potential measurements to characterize electrokinetic properties of ultrafiltration and microfiltration membranes, Colloids Surf. A. 138 (1998) 301-308. [40] B. Ball, D. W. Fuerstenau, A Review of the Measurement of Streaming Potentials, Miner. Sci. Engin. 5 (4) (1973) 267.. Colloids and Surfaces A, 194: 221-232 (2001). Page 21.
(22) [41] P. Jayaweera, S. Hettiarachchi, Determination of zeta potential and pH of zero charge of oxides at high temperatures, Rev. Sci. Instrum. 64 (1993) 524-528. [42] M. Crill, Fiber charge analyzers monitor furnish to optimize production, Pulp Paper 65 (11) (1991) 92-95. [43] Bull, Electrokinetics. XIV. A critical comparison of electrophoresis, streaming potential, and electrosmosis, J. Phys. Chem. 39 (5) (1934) 577-583. [44] F. Carrasco, P. Mutjé, M. A. Pelach, Control of retention in paper-making by colloid titration and zeta potential techniques, Wood Sci. Technol. 32 (2) (1998) 145-155. [45] P. H. Brouwer, The relationship between zeta potential and ionic demand and how it affects wet-end retention, Tappi J. 74 (1) (1991) 170-179. [46] D. A. Pietschker, The 100% Closed Water System – What to Expect, Proc. TAPPI Papermakers Conf., TAPPI Press, Atlanta (1996), 521-528. [47] J. A. Ciriacks, D. G. Williams, A Happel flow model – streaming current relationship for determining the zeta potential of cylindrical fibers, J. Colloid Interface Sci. 26 (1968) 446-456. [48] T. M. Herrington, B. R. Midmore, Adsorption of ions at the cellulose/aqueous electrolyte interface, J. Chem. Soc., Faraday Trans. 1 80 (6) (1984) 1553-1566. [49] A. Swerin, L. Ödberg, Some aspects of retention aids, in The fundamentals of papermaking materials, C. F. Baker, Ed., Trans 11th Fundam. Res. Symp. at Cambridge, PIRA Intl., Leatherhead, England (1997), Vol. 1, 265-351. [50] J. Marton, T. Marton, Some new principles to optimize rosin sizing, Tappi J. 65 (11) (1982) 105-109. [51] J. E. Stone, A. M. Scallan, A structural model for the cell wall of water-swollen wood pulp fibers based on their accessibility to macromolecules, Cellulose Chem. Technol. 2 (3) (1968) 343-358. [52] J. Berthold, L. Salmén, Effects of mechanical and chemical treatments on the pore size distribution in wood pulps examined by inverse size-exclusion chromatography, J. Pulp Paper Sci. 23 (6) (1997) J245-253. [53] J. L. Koethe, W. E. Scott, Polyelectrolyte interactions with papermaking fibers: the mechanism of surface-charge decay, Tappi J. 76 (12) (1993) 123-133. [54] F. Onabe, Studies of interfacial properties of polyelectrolyte-cellulose systems. I. Formation and structure of adsorbed layers of cationic polyelectrolyte on cellulose fibers, J. Appl. Polymer Sci. 22 (1978) 3495-3510. [55] T. Lindström, L. Wågberg, Effects of pH and electrolyte concentration on the adsorption of cationic polyacrylamides on cellulose, Tappi J. 66 (6) (1983) 83-85. [56] H. G. M. Van de Steeg, M. A. Cohen Stuart, A. de Keiser, B. H. Bijsterbosch, Polyelectrolyte adsorption: a subtle balance of forces, Langmuir 8 (1992) 25382546. [57] O. J. Rojas, P. M. Claesson, D. Muller, R. D. Muller, The effect of salt concentration on adsorption of low-charge-density polyelectrolytes and interactions between polyelectrolyte-coated surfaces, J. Colloid Interface Sci. 205 (1998) 77-88. [58] L. Öhman, L. Wågberg, K. Malmgren, Å. Tjernström, Adsorption of aluminum (III) on cellulosic fibers in neutral to alkaline solutions – influence of charge and size of the particles formed, J. Pulp Paper Sci. 23 (1997) J467-J474. [59] L. Winter, L. Wågberg, L. Ödberg, T. Lindström, Polyelectrolytes adsorbed on the surface of cellulosic materials, J. Colloid Interface Sci. 111 (1986) 537-543.. Colloids and Surfaces A, 194: 221-232 (2001). Page 22.
(23) [60] J. Rouger, P. Mutje Pujol, Correlation between cellulose fiber beating and fixation of a soluble cationic polymer, Brit. Polymer J. 16 (1984) 83-86. [61] T. M. Herrington, J. C. Petzold, An investigation into the nature of charge on the surface of papermaking woodpulps. 2. Analysis of Potentiometric data, Colloids Surf. 64 (1992) 109-118.. TABLES Table 1 Deviation analysis for the results shown in Fig. 5 Analysis Items. Trial. 1 2 3 4 5 6 E1 (mV) * -20.53 -21.02 -21.31 -21.06 -20.89 -21.31 E2 (mV) * -13.77 -14.14 -14.58 -14.37 -14.14 -14.75 Std. Dev. E1 0.01 0.01 0.02 0.01 0.01 0.01 Std. Dev. E2 0.16 0.13 0.21 0.35 0.25 0.23 Streaming Pot’l. (mV) -6.77 -6.87 -6.73 -6.69 -6.74 -6.56 Average Streaming Pot’l. (mV) -6.72 Standard Deviation of Streaming Potential (mV) 0.107 * Each individual measurement involved averaging of signals over ten seconds; this averaging also made it possible to obtain standard deviation data for each individual E1 and E2 data point.. Colloids and Surfaces A, 194: 221-232 (2001). Page 23.
(24) FIGURE CAPTIONS Fig. 1. Illustration of electronic components of the Streaming Potential Jar (SPJ) and their arrangement. Fig. 2. Illustration of SPJ sample jar, pressure control system, and filtrate evaluation system. Fig. 3. Filtrate mass (relative) and electrical potential data collected during a single cycle of high pressure (P1), low pressure (P2) and low vacuum. Fig. 4. Six replicate tests of streaming potential of bleached hardwood kraft pulp (BHKP). Fig. 5. Streaming potential (E2 – E1) values versus applied pressure difference for BHKP suspended in 0.01 M salt solutions. Fig. 6. Influence of pulp slurry percent solids on the streaming potential of bleached hardwood and softwood pulps. Fig. 7. Effect of pH on the titration of BHKP slurries with Poly-DADMAC at a conductivity of 1050 µS/cm. Fig. 8. Comparison of streaming potential data with results of micro-electrophoresis (ME) for BHKP in the presence of different amounts of Na2SO4. Fig. 9. Comparison of poly-DADMAC titration data by ME vs. the SPJ test in the presence of 0.001 M Na2SO4. Fig. 10. Comparison of poly-DADMAC titration data by ME vs. the SPJ test in the presence of 0.01 M Na2SO4.. Colloids and Surfaces A, 194: 221-232 (2001). Page 24.
(25) FIGURES Digital Multi-meter GPIB Cable. -15.555 mV DC. to Pressure Control. Signal Conditioning. DAQ Boards Plug-in GPIB. Turbidity Meter pH 5.8. Transducers. pH Meter. Process. AT Card Potential (mV). P1 P2 Vac -10 -15. 105.52 g. -20 -25 0. 100. 200. 300. Balance 8550 µS/cm. Computer. Conductivity Meter. Fig. 1. Illustration of electronic components of the Streaming Potential Jar (SPJ) and their arrangement.. Vacuum Pressure. P1. Air Regulators P2. Chemical Addition (Pressure Relief Valve). Streaming Potential Probes. Probes for Turbidity, pH, Conductivity. Air. V. Flexible Tube Jar Bleed. Beaker. Trap. Fiber Slurry. Bellows. Magnetic Stirrer. Filtrate. 105.52 g Balance. Valves. Fig. 2. Illustration of SPJ sample jar, pressure control system, and filtrate evaluation system.. Colloids and Surfaces A, 194: 221-232 (2001). Page 25.
(26) Potential (mV) and Filtrate Mass (g). 100. Pressure P2 Pressure P1. Vacuum. 80 60. Filtrate Mass. 40. Potential 20 0 -20 -40. E1 (average). T0. 0. E2 (average) T1. 20. Time (seconds). T2. 40. 60. Pressure. Fig. 3. Filtrate mass (relative) and electrical potential data collected during a single cycle of high pressure (P1), low pressure (P2) and low vacuum.. P1 P2 Vac. Potential (mV). -10 -15 -20 -25. 0. 100. 200. 300. 400. Elapsed Time (s) Fig. 4. Six replicate tests of streaming potential of bleached hardwood kraft pulp (BHKP).. Colloids and Surfaces A, 194: 221-232 (2001). Page 26.
(27) Streaming Potential (-mV). 8 R2 = 0.998 (in 0.01 M NaCl). 6. R2 = 0.996 (in 0.01 M Na2SO4). 4 2 0 0. 100. 200. 300. Pressure Difference (kPa) Fig. 5. Streaming potential (E2 – E1) values versus applied pressure difference for BHKP suspended in 0.01 M salt solutions.. Streaming Potential (-mV). 18 16 14 12 10 8 6. Hardwood Pulp. 4. Softwood Pulp. 2 0 0. 0.2. 0.4. 0.6. 0.8. 1. 1.2. Pulp Consistency (%) Fig. 6. Influence of pulp slurry percent solids on the streaming potential of bleached hardwood and softwood pulps.. Colloids and Surfaces A, 194: 221-232 (2001). Page 27.
(28) Streaming Potential (mV). 4 2 0 -2 -4 pH 3.0. -6. pH 4.6 pH 7.6. -8. pH 10.3. -10 -12 0. 10. 20. 30. 40. 50. 60. Poly-DADMAC Dosage (µeq/g pulp). Electrokinetic Potential (-mV). Fig. 7. Effect of pH on the titration of BHKP slurries with Poly-DADMAC at a conductivity of 1050 µS/cm.. 70 60. Zeta Potential (Micro-elec.). 50. Streaming Potential (SPJ). 40 30 20 10 0 0. 1000. 2000. 3000. 4000. 5000. 6000. 7000. 8000. Conductivity (uS/cm) Fig. 8. Comparison of streaming potential data with results of micro-electrophoresis (ME) for BHKP in the presence of different amounts of Na2SO4.. Colloids and Surfaces A, 194: 221-232 (2001). Page 28.
(29) 10 5. Potential (mV). 0 -5. 0.001 N Na2SO4. -10 -15. Zeta Potential (M.-E.). -20. Streaming Pot’l. (SPJ). -25 0. 10. 20. 30. 40. 50. 60. Poly-DADMAC Dosage (µeq/g pulp) Fig. 9. Comparison of poly-DADMAC titration data by ME vs. the SPJ test in the presence of 0.001 M Na2SO4.. 4 2. Potential (mV). 0 -2 -4 -6. 0.01 N Na2SO4. -8 -10. Zeta Potential (M.-E.). -12. Streaming Pot’l. (SPJ). -14 0. 20. 40. 60. 80. 100. 120. Poly-DADMAC Dosage (µeq/g pulp) Fig. 10. Comparison of poly-DADMAC titration data by ME vs. the SPJ test in the presence of 0.01 M Na2SO4.. Colloids and Surfaces A, 194: 221-232 (2001). Page 29.
(30) Colloids and Surfaces A, 194: 221-232 (2001). Page 30.
(31)
Figure

+3

Related documents
