ABSTRACT
HATHORN, CHELLANI S. Development of a Peanut-Sweetpotato Ready to Use
Therapeutic Food and Evaluation of Peanut Skins in Peanut Products. (Under the direction of Dr. Timothy H. Sanders).
Severe acute malnutrition (SAM) affects 20 million children under the age of five. Vitamin A deficiency (VAD) is the leading cause of childhood blindness in the world and an estimated 250,000 to 500,000 children become blind every year. Ready to use therapeutic foods (RUTF) are soft enriched foods containing mostly peanuts, milk powder, and vitamin/minerals. RUTFs were developed to eliminate SAM and incorporating β-carotene rich sweetpotatoes in RUTFs may be a viable way of addressing VAD. The main objective of this work was to develop a peanut-sweetpotato RUTF and evaluate nutritional
composition, descriptive sensory analysis and consumer acceptance of formulations
containing peanuts/sweetpotato flakes (SPF)/milk powder, and other standard ingredients. A secondary objective was to evaluate the potential of peanut skins to improve nutritional properties and enhance the shelf life of peanut products.
Eleven formulations of peanut paste fortified with SPF and milk powder were evaluated for nutritional composition and sensory characteristics. A lexicon incorporating roasted peanut and sweetpotato flavor descriptors was developed. Increased β-carotene and
increased concentration of some specific amino acids. From the eleven formulations, two were selected for the evaluation of nutritional composition, flavor using descriptive sensory analysis and consumer acceptance. A commercial RUTF (MANA), and one peanut only formulation were evaluated. The three formulations contained 49/15/20, 28/20/30 and 56/0/30 percentages of peanuts/SPF/milk powder, respectively, and other standard ingredients. β-carotene in 49/15/20 and 28/20/30 was 2040 µg/100g and 3070 µg/100g, respectively. MANA and the 56/0/30 formulation contained 350 µg/100g and 420 µg/100g, respectively. The combination of milk powder with other ingredients used in this study resulted in a more complete amino acid profile than peanuts alone. Formulations containing SPF were characterized by roast peanutty, sweet aromatic, baked sweetpotato/dried
apricot/floral aromatics. The formulation containing 15% SPF was one of the two most overall liked by consumers and overall flavor liking was highest in this formulation.
Development of a Peanut-Sweetpotato Ready to Use Therapeutic Food and Evaluation of Peanut Skins in Peanut Products
by
Chellani S. Hathorn
A dissertation submitted to the Graduate Faculty of North Carolina State University
in partial fulfillment of the requirements for the degree of
Doctor of Philosophy
Food Science
Raleigh, North Carolina 2013
APPROVED BY:
________________________________ ________________________________ Dr. Timothy H. Sanders, Dr. Lisa O. Dean
Committee Chair
BIOGRAPHY
ACKNOWLEDGMENTS
First and foremost, I would like to thank my Lord and Savior, Jesus Christ, for this amazing opportunity. I have grown to become a much stronger individual on this jouney, but I know there is much more to come.
I would like to acknowledge my advisor, Dr. Timothy H. Sanders for giving me the opportunity to work in your lab. Every time I visited your office, you always took time to talk to me and see what I wanted or needed. Thank you for encouraging me both
academically and personally. I truly appreciate everything you have done for me. Also I would like to acknowledge my committee members, Dr. Lisa Dean, Dr. MaryAnne Drake and Dr. Den Truong. Dr. Dean, thank you for taking time to answer my questions and helping me solve problems. Dr. Drake, thank you for your suggestions and help with the sensory portion of my work. Dr. Truong, thank you for encouraging me throughout my time in school.
I am forever grateful to the USDA/ARS Market Quality and Handling Research Unit (MQHRU). Keith, you have such a giving spirit! I truly appreciate all of your help. If I started to list all the ways you have helped, the list would go on. Jim, my fellow
mates in room 221 (both past and present), thank you for all the laughs and fun times that we had. I would like to thank Judy Cooper for her kind words of encourgaement. Dr. Leon Boyd, thanks for encouraging me to apply to NCSU and I appreciate you stopping by the office to check and see how things were progressing even after you had retired.
I would like to acknowledge my parents, Louis Blake and Claranett Hathorn for their prayers, support, sacrifices and always believing in me. Thanks for always being there! To Shintri and Blake, thanks for being the best sister and brother ever! We always have such a great time laughing and talking whenever we are together, as well as when we are on the phone. Adrian, thank you for always being there, pushing me, praying with me and constantly speaking the word of God. You have truly supported me through this process. You are awesome! Danielle, Erica, Dee, and Jessica, thank you for encouraging me and always showing the love of God. You all are such wonderful and supportive friends. I would like to thank the Carter family for their continuous support and love.
TABLE OF CONTENTS
LIST OF TABLES ………...xi
LIST OF FIGURES ……….xiv
CHAPTER 1. LITERATURE REVIEW………...1
Peanuts………..2
Introduction ………...2
Peanut maturity ………..5
Peanut skins ………6
Peanut flavor ………...13
Storage stability and peanut flavor ………..18
Bitter taste ………20
Transduction of bitter taste ………..21
Bitter - phenolic compounds and tannins ………22
Astringency ………..23
Astringent compounds ……….24
Texture ……….25
Texture of peanut products ………..28
Sweetpotato……….30
Composition ……….30
Harvest, curing and processing ………33
Sweetpotato Flakes ………..34
Descriptive sensory and consumer acceptance ………37
Flavor constituents ………...41
Milk powder ………..44
Introduction ………...44
Composition ……….45
Oxidation ………..47
Flavor ………...47
Flavor as affected by storage ………...48
Ready to Use Therapeutic Foods/Ready to Use Supplementary Foods ...………....49
Introduction ………...50
RUTF/RUSF ………54
Plumpy’nut ………..56
MANA ……….56
Clinical evidence of using RUTF ………57
References ……….……….58
Abstract ………76
Introduction ………...78
Materials and Methods ……….81
Color ……….81
Sample Extraction ………81
Total Phenolics ……….82
Hydrophilic – ORAC ………83
Lipophilic – ORAC ………...83
Descriptive Sensory Analysis ………...84
Statistical Analysis ………85
Results and Discussion ………...86
Conclusions ………...91
References …….………...92
CHAPTER 3. EVALUATION OF PEANUT SKINS: POTENTIAL TO ENHANCE SHELF-LIFE AND OIL CHARACTERIZATION ……….103
Abstract ………105
Introduction ………..107
Materials and Methods ……….109
Oxygen Radical Absorbance Capacity (ORAC) ……….109
Peroxide Value ………...110
Fatty Acid Profile ………...111
Tocopherol Analysis ………...111
Heavy Metal Analysis by ICP ………..112
Statistical Analysis ………..112
Results and Discussion ………....113
Conclusion ………....119
References …….………120
CHAPTER 4. SENSORY AND NUTRITIONAL OPTIMIZATION OF A PEANUT SWEETPOTATO READY TO USE THERAPEUTIC TYPE FOOD (RUTF) ...……135
Abstract ………...137
Introduction ……….139
Materials and Methods ………....141
Color, Moisture, Fat ………....141
β-carotene analysis ………..141
ORAC Sample Extraction ………...142
Hydrophilic – ORAC ………...143
Amino Acids ………...143
Development of a Descriptive Sensory Peanut-Sweetpotato Lexicon ………144
Statistical Analysis ………..145
Results and Discussion ………...146
Conclusion ………..150
References .……….151
CHAPTER 5. NUTRITIONAL COMPOSITION, DESCRIPTIVE SENSORY ANALYSIS, AND CONSUMER ACCEPTANCE OF AN OPTIMIZED THERAPEUTIC READY-TO-USE PEANUT-SWEETPOTATO BASED FOOD………162
Abstract ………...164
Introduction ………...166
Materials and Methods ………....170
Color, Moisture, Fat ………...170
Viscosity ………..171
β-Carotene Analysis ………....171
Amino Acid Content ………...172
Descriptive Sensory Analysis (DSA) ………..172
Consumer Acceptance Testing ………....173
Statistical Analysis ………..174
Results and Discussion ………...175
Conclusion ………...182
LIST OF TABLES
CHAPTER 1.
Table 1. Peanut types and primary growing region ………...2
Table 2. Tocopherol contents in normal, mid and high-oleic cultivar ………...4
Table 3. Fatty acid content of different peanut genotypes ……….4
Table 4. Lexicon of peanut flavors ………..15
Table 5. Peanut aroma model system ………..18
Table 6. Terms used in the texture profile analysis ...……….……….26
Table 7. Proximate composition of sweetpotato …..………...31
Table 8. Concentration of amino acids in sweetpotato flour …..……….32
Table 9. Nutritional facts label for instant sweetpotato flakes ....………...36
Table 10. β-carotene content of sweetpotato flakes after storage under various packaging conditions ………..……..37
Table 11. Descriptive sensory lexicon for sweetpotatoes ………...……….38
Table 12. Sensory attributes of sweetpotato cultivars ………..40
Table 13. Volatile compounds identified in cooked sweetpotatoes ……….43
Table 14. Amino acid composition of milk powder ……….…....46
CHAPTER 2.
Table 1. Intensity of attributes of peanut paste reference containing
2% tannic acid ……….100
Table 2. L and a value of peanut paste containing peanut skins ………...100
Table 3. Total phenolics (TP) and oxygen radical absorbance capacity (ORAC) of peanut paste containing peanut skins ………101
Table 4. Oxygen radical absorbance capacity (ORAC) of peanut skins ………...101
Table 5. Descriptive sensory analysis of peanut paste containing peanut skins …………...102
Table 6. Descriptive sensory analysis of peanut butter containing peanut skins ………...102
CHAPTER 3. Table 1. Peanut skins and corresponding peanut designation ………...124
Table 2. Fatty acid composition of oil from peanut skins and peanuts ………...125
Table 3. OSI (110 C) of oil from peanuts ………....126
Table 4. Total tocopherol content of oil from peanut skins and peanuts ………..127
Table 5. Copper and iron content in peanut skins and peanuts ………...128
CHAPTER 4. Table 1. Peanut-sweetpotato paste formulations ………..155
Table 2. Color, moisture and fat content of peanut-sweetpotato formulations ………156
Table 3. β-carotene and ORAC of peanut-sweetpotato formulations ………..157 a b b
Table 4. Total amino acid content (g/100g) of peanut-sweetpotato formulations ………...159
Table 5. Descriptors and definition of peanut-sweetpotato lexicon ………...161
Table 6. Descriptive sensory analysis of peanut-sweetpotato formulations ………...161
CHAPTER 5. Table 1. Percentages of ingredients used in optimized peanut-sweetpotato formulations ………188
Table 2. Color, moisture, fat, viscosity and β-carotene of commercial and formulated RUTFs ...………...189
Table 3. Amino acid content (g/100) in RUTF ………...190
Table 4. Descriptors and definition of peanut-sweetpotato lexicon ………...191
Table 5. Descriptive sensory analysis of MANA and RUTF formulations ………..192
Table 6. Demographic information and consumer characteristics for RUTF consumer studies ………...193
Table 7. Consumer consumption interest for RUTF ………...194
Table 8. Liking attribute means from consumer acceptance testing of RUTF …………...195
Table 9. Consumer just about right (JAR) scores for RUTF ……….……...196
LIST OF FIGURES
CHAPTER 1.
Figure 1. Steps of autoxidation: initiation, propagation, and termination ………...9 Figure 2. General structure of flavonoid ………...….11 Figure 3. Comparative aroma profile of roasted peanut paste (black and yellow
maturity class) and optimized aroma model …………...………...17 Figure 4. Proposed mechanism for PRP-polyphenol binding and subsequent
protein aggregation and complex formation ………..…25 Figure 5. Generalized instrumental texture profile curve obtained with the
General Foods Texturometer ……….27
Figure 6. Structure of β-carotene ..……….33 Figure 7. Causes of death among child under 5 years of age, 2000-2003,
worldwide ………..51 Figure 8. Direct and indirect causes of malnutrition …..………..………53 Figure 9. F-75 and F-100 therapeutic milk in dehydrated form ………...55
CHAPTER 3.
Figure 1. Hydrophilic ORAC of peanut paste containing peanut skins stored at 30° C ..…131 Figure 2. Hydrophilic ORAC of peanut butter containing peanut skins stored at 30° C...132 Figure 3. Oxidative stability index (110°C) of peanut paste containing peanut skins stored at 30°C ………133 Figure 4. Oxidative stability index (110 °C) of peanut butter containing peanut skins
Figure 5. Peroxide value (meq/kg) of peanut paste containing peanut skins stored at 30°C ………..135 Figure 6. Peroxide value (meq/kg) of peanut butter containing peanut skins stored at 30°C ………..136
CHAPTER 5.
APPENDICES
CHAPTER 1
PEANUT Introduction
Peanuts [Arachis hypogea L.] are an important agricultural commodity that originated in South America. They are grown in many different regions including Asia, Africa, North and South America, and are commonly referred to as groundnuts or groundpeas in many parts of the world. The majority of peanuts grown in the United States (USA) are produced in the southern region. Georgia is the leading peanut producing state, followed by Texas, Alabama, North Carolina, Florida, Virginia and Oklahoma. Peanuts are categorized into four market types and they are further separated by growing region and seed size (Table 1). The shell, skin (testa or seedcoat), and seed together makes up the peanut (Woodroof 1983).
Table 1. Peanut types and primary growing region
Types sp. ssp. Growing region Size
runner Arachis hypogaea L. hypogaea Georgia, Alabama, Florida Medium virginia A. hypogaea L. hypogaea Virginia, North Carolina Large spanish A. hypogaea L. fastigiata Texas, Oklahoma Small valencia A. hypogaea L. Fastigiata New Mexico Intermediate
butter, by standard of identity, contains a minimum of 90% peanuts (CFR 2008a). Products which do not meet the standard of identity for peanut butter are labeled as peanut spread or imitation peanut butter (McWatters and Young 1978). Due to advanced processing and packaging, peanut butter and similar products can be stored up to 5 years under optimum storage conditions (Shewfelt and Young 1977). Peanuts are also processed for snack nuts and confectionary products. About 15% of all peanuts grown in the U.S. are crushed for oil (American Peanut Council 2008). Lipids in peanuts account for 40-50% of the dry weight and 80% of the fatty acids in peanuts are unsaturated (Hoffpauir 1953; Eheart et al. 1955; Özcan and Seven 2003). The fatty acid composition of peanuts is about 48% oleic and 31% linoleic acid (Cobb and Johnson 1973) except for high oleic varieties which may contain up to 80% oleic acid (Norden et al. 1987). Genotype as well as production environment affect fatty acid composition (Table 3). Peanuts contain , β, , and δ tocopherols, a class of compounds with vitamin E activity (Table 2). The protein content of peanuts ranges between 21-36% (Hoffpauir 1953). Peanuts contain all essential amino acids, but lack adequate amounts of lysine, methionine and threonine (Pominski et al. 1991).
Table 2. Tocopherol contents in normal, mid and high-oleic cultivar (mg per
100g) Shin et al. (2009)
Type -T β-T -T δ-T Total
Normal-oleic 10.9±1.4 b 0.33±0.14 a 10.4±2.4 b 0.85±0.40 a 22.4±3.3 a Mid-oleic 11.7±1.0 a 0.35±0.07 a 11.2±0.8 ab 0.68±0.10 ab 2.39±1.4 a High-oleic 9.8±1.3 c 0.26±0.07 b 11.7±1.4 a 0.66±0.08 b 22.4±1.7 a
Data represent the mean±SD of each sample assayed in triplicate. Means with different letter indicate significant differences.
Table 3. Fatty acid content of different peanut genotypes (Andersen et al. 1998; Isleib et al. 2006)
Genotype 16:0 18:0 18:1 18:2 20:0 20:1 22:0 24:0 Florunner 10.40 2.33 52.80 27.10 1.35 1.28 3.10 1.68 SunOleic 95R 6.55 2.63 79.00 4.70 1.33 1.58 2.60 1.63 GA 2844 9.42 2.94 54.20 26.40 1.42 1.08 2.92 1.62 TX 896100 10.30 2.98 55.40 24.50 1.55 1.05 2.78 1.50 UF 91108 9.10 2.98 60.40 19.30 1.62 1.18 3.90 1.52 NC 12C 10.10 3.58 56.70 24.20 1.50 0.75 2.23 1.08 F 1334 5.63 2.18 81.20 3.46 1.20 1.94 2.77 1.86 N00090ol 5.53 4.05 80.46 2.48 1.79 1.35 2.76 1.37 NC 7 8.97 3.47 58.09 22.85 1.57 1.02 2.67 1.27 16:0 – Palmitic acid; 18:0 –Stearic acid; 18:1 – Oleic acid; 18:2 – Linoleic acid; 20:0 – Arachidic acid; 20:1 –Eicosenoic acid; 22:0 –Behenic acid; 24:0 –Lignoceric acid Peanut Maturity
progressively range from white (immature) to black (mature) and have been divided into maturity classes corresponding to the colors: white, yellow, orange A, orange B, brown and black (Williams and Drexler 1981; Sanders et al. 1982).
Environmental conditions such as weather, disease, soil type, and crop rotation may affect the maturation of peanuts and thus the optimum harvest time (Sanders and Bett 1995). Peanut maturity affects grade, yield, size, composition, quality and flavor (Sanders et al. 1989a; Sanders et al. 1989b; McNeil and Sanders 1998). The peanut plant has an
indeterminate flowering pattern that results in a wide range of maturities on a plant at the time of harvest. The harvest of this range of maturity classes with inherent variability in seed sizes results in a maturity distribution within each shelled seed size lot which affects quality and flavor of peanut and peanut products (McNeil and Sanders 1998). Young et al. (1973) found that amino acid variations observed in peanuts were related to maturity and
Pattee and Purcell (1967) reported that β-carotene and lutein were highest in
immature peanuts; therefore, the oil from immature peanuts is normally lighter in color and highly correlated with peanut maturity (Holley and Young 1963). Pattee et al. (1969) suggested that a decrease in peanut oil color is due to a decrease in carotenoids as peanuts mature and this result in less yellow color in the oil. Some research suggest that oil color differences among peanuts may be a result of curing (Holley and Young 1963).
Peanut Skins
The skin (seed coat or testae) from peanuts is the thin paper-like layer that surrounds the seed. The epidermis or sclerenchyma, the middle parenchyma and the inner parenchyma make up the three unicellular layers of peanut skins (Rao and Murty 1994). Large quantities of peanut skins are produced from blanching and roasting, and are considered as waste products. Removal of the skin is done in preparation for the production of products such as peanut butter. Peanut skins are often dumped as waste but some are utilized as feed additives because they are inexpensive and are a source of fat and protein (Hill 2002). Use of peanut skins for animal feed is limited by the high tannin content (Sanders 1979), because tannins react with protein and form protein-tannin complexes. Tannins inhibit digestion by binding with protein and interfering with the absorption of nutrients. Approximately 60,000 tons of peanut skins are accumulated annually in the U.S. as a result of peanut processing.
interest in natural and synthetic antioxidants possibly being added to food products or extracts used for nutraceutical supplements. Antioxidants when added to lipid based foods may aid in reducing the formation of various off-flavors and other compounds that result from the oxidation of lipids. Butylated hydroxyanisole (BHA) and butylated hydroxytoluene (BHT) are synthetic antioxidants which have been used widely as natural preservatives in foods (Velioglu et al. 1998). Currently, natural antioxidants are of interest to researchers interested in protecting and maintaining food quality. Houlihan et al. (1985) described the criteria of natural antioxidants for use in food. Antioxidants:
(a) should develop no flavor or colors when added at the prescribed concentration in the product
(b) should have the desired solubility in the fat substrate to assure effectiveness (c) must have no toxicological effects
(d) should have carry-through properties (e) must be cost effective
According to Boskou and Elmada (1999) antioxidants should: (a) compete effectively with the substrate for reactive intermediates
(b) be readily repaired by the biological system. If the antioxidant is destroyed irreparably at every encounter with the oxidizing species then the system will rapidly reach a state where it is no longer protected.
(d) be relatively unreactive to the substrate. The products should not be toxic to the system and must not take part in the reaction.
(e) be catalytic in its quenching mechanism.
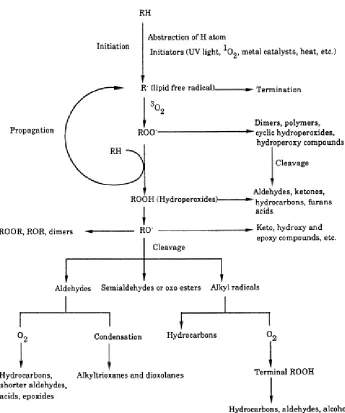
Lipids are components of many foods and peanuts are susceptible to oxidation, since the majority of the lipids are unsaturated. Oxidation is catalyzed by light, heat, enzymes and metals leading to autoxidation, photooxidation, thermal or enzymatic oxidation (Shahidi and Zhong 2010). Autoxidation is the reaction that occurs in the presence of atmospheric oxygen through a chain reaction of free radicals forming peroxides and hydroperoxides.
Figure 1. Steps of autoxidation: initiation, propagation, and termination (Shahidi 2000)
products such as aldehydes, ketones, alcohols, hydrocarbons, volatile organic acids and epoxy compounds are formed from the hydroperoxides (Shahidi and Zhong 2010). Lipid oxidation generally results in secondary products are associated with undesirable odors and flavors (Shahidi and Zhong 2010). Termination, the last stage of oxidation, occurs when free radicals start to react with one another, which completes the cycle.
Phenolic compounds are effective antioxidants and possess biological properties such as anti-carcinogenic, anti-mutagenic, anti-inflammatory and anti-microbial properties (Huang and Ferraro 1992, Puupponen-Pimiä et al. 2001, Rimando et al. 2002, Castilla et al. 2006, Wang et al. 2006). Phenolic compounds are divided into two categories: flavonoids and nonflavonoids. Flavonoids have a 15 carbon backbone with two benzene rings (A and B) joined by a three carbon chain (Figure 2). Flavonoids make up the largest class of
Figure 2. General structure of flavonoid
Nepote et al. (2005) used a solvent extraction method to obtain antioxidant
compounds from peanut skins. The researchers found that 70% ethanol in water was the best solvent ratio for extracting the antioxidant compounds from peanut skins. In another study, 80% ethanol was used to extract phenolics from the skin of peanuts (Yu et al. 2006) and compounds with antioxidant activity included epigallocatechin, epicatechin, chlorogenic acids, caffeic acids and stilbenes. Seung et al. (2006) reported that the use of methanol to extract phenolic compounds from peanuts resulted in higher total phenolics than other solvents used.
The oxygen radical absorbance capacity (ORAC) assay is a method to determine the inhibition of peroxyl radical induced oxidation in foods and biological materials (Prior et al. 2003; Prior et al. 2005; Karadag et al. 2009). One of the advantages of the ORAC assay is that it can be used to determine both hydrophilic and lipophilic activity (Wu et al. 2004). ORAC specifically measures peroxyl radical quenching of the fluorescence of fluorescein. The antioxidant activity is quantified using the area under the fluorescence decay curve. The standard curve is generated from Trolox, a water-soluble analogue of vitamin E and ORAC is reported as micromoles of Trolox equivalents (TE) per gram or 100 g of sample. Ballard et al. (2009) reported that antioxidant activity using ORAC was 214,900 µMol TE /100g for peanut skins. Davis et al. (2010) reported that ORAC ranged from 154,440 to 216,030 µMol TE / 100 g for peanut skins that were subjected to increased roasting.
and without peanut skin extracts. At 42 days of storage, HRP without peanut skin extract had higher peroxide values than HRP with peanut skin. Natural antioxidant extracts from peanut skins provided protection against lipid oxidation during storage, while HRP-butylated hydroxytolene (BHT) provided more. Sobolev and Cole (1999) demonstrated potential uses of peanut skins that included extracted oil, alcoholic and non-alcoholic beverages. O’Keefe and Wang (2006) examined phenolic compounds extracted from peanut skins as natural antioxidants in beef products and concluded that 200-400 ppm was the optimal concentration of extract to significantly reduce lipid oxidation and extend storage stability.
Peanut Flavor
Descriptive sensory analysis (DSA) is a comprehensive sensory tool used to generate quantitative and qualitative data. DSA utilizes a panel that is selected through screening and extensive training to develop panel abilities to identify and quantify attributes of foods (Drake 2007). Some DSA methods include Spectrum™, Flavor Profile®,
Amino acids and sugars have been considered as flavor precursors in roasted peanuts (Newell et al. 1967; Mason et al. 1969). Newell et al. (1967) observed the changes in amino acid content during roasting of mature and immature peanuts, and suggested that aspartic acid, asparagine, glutamine, glutamic acid, phenylaline and histidine were precursors to roasted peanut flavor. Amino acids threonine, tyrosine and lysine are not major flavor precursor (Newell et al. 1967). Chung et al. (1994) used peptide modeling to distinguish between mature and immature peanut proteins. The authors reported that the proteins in mature and immature peanuts are structurally different. Oupadissakoon and Young (1984) used maximum R2 (MAXR) stepwise mathematical modeling using amino acid and sugar data as dependent variables to predict critical laboratory evaluation roast (CLER) score and roast peanut flavor intensity. A 10-variable model using raw peanut data had the best fit (R2=0.762).
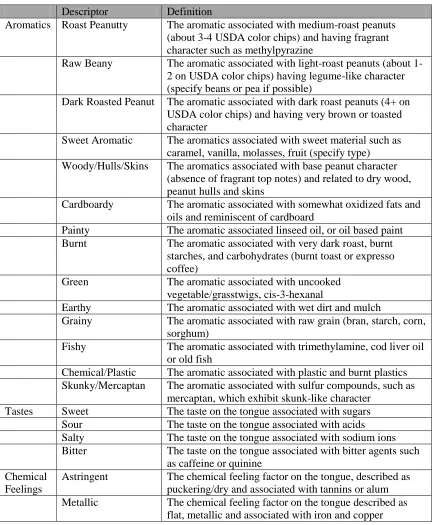
Table 4. Lexicon of peanut flavors developed by Johnsen et al. (1988) Descriptor Definition
Aromatics Roast Peanutty The aromatic associated with medium-roast peanuts (about 3-4 USDA color chips) and having fragrant character such as methylpyrazine
Raw Beany The aromatic associated with light-roast peanuts (about 1-2 on USDA color chips) having legume-like character (specify beans or pea if possible)
Dark Roasted Peanut The aromatic associated with dark roast peanuts (4+ on USDA color chips) and having very brown or toasted character
Sweet Aromatic The aromatics associated with sweet material such as caramel, vanilla, molasses, fruit (specify type) Woody/Hulls/Skins The aromatics associated with base peanut character
(absence of fragrant top notes) and related to dry wood, peanut hulls and skins
Cardboardy The aromatic associated with somewhat oxidized fats and oils and reminiscent of cardboard
Painty The aromatic associated linseed oil, or oil based paint Burnt The aromatic associated with very dark roast, burnt
starches, and carbohydrates (burnt toast or expresso coffee)
Green The aromatic associated with uncooked vegetable/grasstwigs, cis-3-hexanal
Earthy The aromatic associated with wet dirt and mulch
Grainy The aromatic associated with raw grain (bran, starch, corn, sorghum)
Fishy The aromatic associated with trimethylamine, cod liver oil or old fish
Chemical/Plastic The aromatic associated with plastic and burnt plastics Skunky/Mercaptan The aromatic associated with sulfur compounds, such as
mercaptan, which exhibit skunk-like character Tastes Sweet The taste on the tongue associated with sugars Sour The taste on the tongue associated with acids Salty The taste on the tongue associated with sodium ions Bitter The taste on the tongue associated with bitter agents such
as caffeine or quinine Chemical
Feelings
Astringent The chemical feeling factor on the tongue, described as puckering/dry and associated with tannins or alum Metallic The chemical feeling factor on the tongue described as
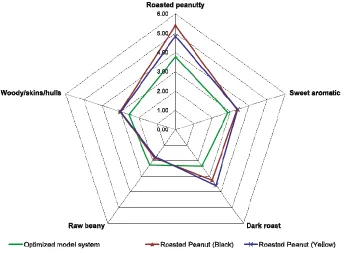
Peanut flavor results from a complex mixture of volatile compounds. Literature has long ascribed peanut flavor to pyrazines; however, recent studies by Chetschik et al. (2010) and Neta (2010) show that pyrazines are not a component of peanut flavor although they do increase during roasting. Chetschik et al. (2010) quantified odorants in raw and pan roasted peanut meal. Stable isotope dilution assay (SIDA), high-resolution gas chromatography-mass spectrometry (HRGC-MS), two-dimensional gas chromatography-chromatography-mass spectrometry (2D-HRGC-MS), odor activity values (OAVs) and aroma recombination experiments were used to characterize peanut flavor. Peanut flavor models without pyrazines and with pyrazines (2,5-dimethylpyrazine, methylpyrazine, trimethylpyrazine,
2-ethyl-6-methylpyrazine, 2,6-di2-ethyl-6-methylpyrazine, 2-ethyl-5-2-ethyl-6-methylpyrazine, 2,3-di2-ethyl-6-methylpyrazine, and 2-ethyl-3-methylpyrazine) evaluated by a sensory panel concluded that there were no
differences between the models. These results indicate that pyrazines do not contribute to the overall roasted peanut aroma. Neta (2010) identified methional, 1-octen-3-one, nonanal, hexanal, octanal, 2-acetyl-1-pyrroline, carbon disulfide, and phenylacetaldehyde as major contributors of roasted peanut aroma. Similarly, Chetschik et al. (2010) reported hexanal, 2-acetyl-1-pyrroline and phenylacetaldehyde as key aroma compounds in roasted peanuts.
compared an optimized peanut aroma model system to normal roasted peanut and found a similarity rating of 8 on a 10 point scale (Figure 3 and Table 5).
Table 5. Optimized peanut aroma model system (Neta 2010)
Compounds Concentration (ppb)
2,3-pentanedione 200
2-acetyl-1-pyrroline 3,000
2-methyoxy-4-vinylphenol 0
Phenylacetaldehyde 25,000
2-methylbutanal 800
carbon disulfide 100
dimethyl trisulfide 100
Hexanal 1,200
Maltol 24,500
Nonanal 1,000
Octanal 1,000
2,5-dimethylpyrazine 6,000
2-ethyl-3-methylpyrazine 100 2-ethyl-3,5-dimethylpyrazine 1,000
acetic acid 0
1-octen-3-one 100
pentanoic acid 0
Methional 100
2,3-diethyl-5-methylpyrazine 100
Storage Stability and Peanut Flavor
Off-flavors and flavor-fade in peanuts have been associated with storage of roasted peanuts (Bett et al. 1994; Braddock et al. 1995; Warner et al. 1996; Lee 2001). Flavor fade is known as a loss of flavor attributes associated with fresh-roasted peanuts, usually occurring during storage (Warner et al. 1996; Abegaz et al. 2004).
peanuts with aw 0.60, followed by high oleic peanuts with aw 0.19, followed by normal oleic peanuts with aw 0.60 and normal oleic peanuts with aw 0.19. Normal oleic peanuts were higher in painty intensity than high oleic peanuts. Increased moisture systems have been studied in peanut butter products (Felland and Koehler 1997) and results indicated that peanut butter with increased moisture had decreased roasted peanut flavor. Abegaz et al. (2004) reported the role of moisture on flavor changes in peanut butter.
Baker et al. (2002) measured peroxide values, moisture content and sensory attributes during 14 weeks of storage in peanuts stored with different aw. Peroxide values (PV)
increased over time for all treatments, while the highest PVs were observed in peanuts held at aw 0.67. Lipid oxidation is influenced by water activity, and controlling this factor can reduce the extent of oxidation occurring in peanuts and peanut products. Roasted peanut flavor decreased with time and the decrease was greater at higher aw.
High oleic acid peanuts have improved oil stability due to lower concentration of polyunsaturated fatty acids. According to Braddock et al. (1995), high oleic peanuts stored at 25°C for 74 days had lower painty and cardboardy intensities than normal oleic peanuts. After 74 days of storage, hexanal, a secondary oxidation product was twice as high in normal oleic peanuts as in high oleic peanuts. Pattee et al. (1999) studied low temperature (-23°C) effects on peanut paste over long term storage and concluded lipid oxidation can occur even at low temperature.
were decreases in sweet taste and significant increases in bitter, and cardboardy intensity and hexanal. After 14 and 21 days, peroxide values were 5.0 and 6.0 meq/kg, respectively.
BITTER TASTE
There are five basic tastes: salty, sour, sweet, bitter and umami. Bitter taste is
stimulated by quinine, caffeine and hops and is elicited at the back of the tongue (Robichaud and Noble 1990; Meilgaard et al. 1999). Phenolic compounds such as catechins, gallic acid, and tannins have been described as having a bitter taste. Other bitter-tasting compounds include amino acids, peptides, sulfimides, ureas, thioureas (6-n-propyl-thiouracil),
phenylthiocarbamide (PTC), esters, lactones, and terpenoids. However, the mechanism of bitter perception is complex and poorly understood. The chemical compounds that are perceived as bitter are diverse and many of the chemical structures are not similar (Drewnowski et al. 2001).
Stimuli for a single taste may come from several different types of chemicals. In the case of bitterness, for example, caffeine, morphine, and potassium chloride are all bitter. The first step in taste recognition takes place in the taste pore, where molecules that are perceived enter the taste pore and interact with receptor molecules and channels within the microvillar membrane of the TRCs (McLaughlin and Margolskee 1994). The neurons make contact with taste cells at the synapse, a specialized region between the receiving end of the neuron, and the sending end of the taste cell. Information is then passed from the TRC to the neuron via chemical transmitters called neuro-transmitters secreted by the taste cell into the synapse. When the neurons detect these transmitters they react to them with a nerve impulse that is transmitted to the brain (McLaughlin and Margolskee 1994). This process of receiving sensory information that is translated into a useful signal to the nervous system is called sensory transduction (McLaughlin and Margolskee 1994).
Transduction of Bitter Taste
(Spielman 1998). G protein α subunit, α-gusducin is associated with the gustatory system and with the cell-surface receptors (McLaughlin et al. 1992).
Both ion-channel events and receptor-mediated transduction mechanisms are
involved in bitter taste chemoreception in species other than man (Kinnamon and Cummings 1992). Ionic taste stimuli such as salts, acids and some bitter compounds interact directly with apically located ion channels to depolarize taste cells. Amino acids, sweet stimuli and other bitter compounds bind to specific membrane receptors usually coupled to G-proteins and secondary messenger systems. Many people find bitter taste to be unpleasant.
Evolutionary biologists suggest that a dislike for bitter foods may have evolved because it enabled people to avoid toxic chemicals. For this, it may be appropriate to suggest that bitter receptors are encoded by a large family of genes that have evolved to provide recognition of a wide and diverse range of chemicals (Maehashi and Huang 2009).
Bitter – Phenolic Compounds and Tannins
Astringency
Astringency is an oral sensation resulting in the binding and precipitation of salivary proteins by polyphenols (Gawel 1998). Astringent compounds precipitate proteins, and are perceived as a dry, rough sensation or shrinking, drawing or puckering of the epithelium (ASTM 1995). Lee and Lawless (1991) generated terms that describe astringent
characteristics as ‘drying’, ‘puckering’, and ‘rough’. The mechanism behind astringency is not fully understood. However, astringency is produced by a variety of stimuli, including tannins and other polyphenols (Gawel 1998), tannin substituents such as catechins
(Thorngate and Noble 1995), acids (Rubico and McDaniel 1992; Hartwig and McDaniel 1995; Lawless et al. 1996) and aluminum salts (Lee and Lawless 1991).
Guinard et al. (1986) investigated the time-intensity of astringency in wines
Astringent Compounds
astringency. It was demonstrated that subjects with high salivary flow had a less intense perception of astringency than low-flow subjects (Fischer and Noble 1994).
Figure 4. Proposed mechanism for PRP-polyphenol binding and subsequent protein aggregation and complex formation (Jöbstl et al. 2004)
Texture
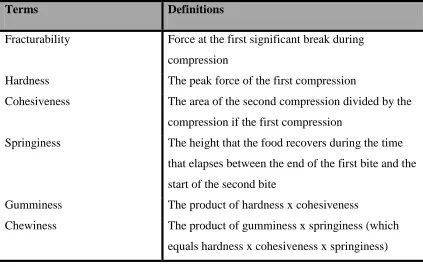
guideline for training a texture profile panel. Bourne (1978) developed the texture profile analysis, which has been widely used to measure the texture of many foods (Table 6 and Figure 5). Texture Profile Analysis (TPA) is a two-cycle uniaxial compression test for characterization of texture features including hardness, cohesiveness, brittleness, gumminess, adhesiveness, chewiness and elasticity (Table 6 and Figure 5).
Table 6. Selected terms used in texture profile analysis (Breene 1975;Bourne 2002)
Terms Definitions
Fracturability Force at the first significant break during compression
Hardness The peak force of the first compression
Cohesiveness The area of the second compression divided by the compression if the first compression
Springiness The height that the food recovers during the time that elapses between the end of the first bite and the start of the second bite
Gumminess The product of hardness x cohesiveness
Figure 5. Instrumental texture profile curve (Breene 1975)
Texture of Peanut Products
Spreadablility of foods that are elastoplastic or viscoplastic have been studied (Sun and Gunasekaran 2009). Bingham model and Casson model yield stress of stabilized and unstabilized peanut butters were determined (Citerne et al. 2001). The stabilized peanut butter had a yield stress of 374 Pa (Bingham) and 363 Pa (Casson), while the unstabilized was 27 Pa (Bingham) and 22 Pa (Casson). The larger yield stresses of the stabilized suspension could be attributed to the stabilizing agent used. Peanut oil is liquid at room temperature thus separates out of unstabilized peanut butter (peanut paste). Stabilizers, used to prevent oil separation, are hydrogenated oils such as cottonseed, rapeseed, soybean and palm oil. In peanut butter, stabilizers form crystal matrices entrapping and preventing the oil from rising to the surface of the product (Woodroof 1983; Totlani and Chinnan 2007).
Muego et al. (1990) used textural profile analysis to measure the textural
characteristics of peanut butter and peanut paste. Results indicated that peanut paste was harder than commercial and laboratory produced peanut butter. The firmness and
SWEETPOTATO
Introduction
Sweetpotato (Ipomoea batatas) is a dicotyledonus plant belonging to the morning glory family. In the United States (U.S.), sweetpotatoes are commercially grown in New Jersey, Texas, Iowa, Illinois, Indiana, Kentucky, Mississippi and North Carolina. North Carolina leads the U.S. in the production of the sweetpotato (North Carolina Sweetpotato Commission 2010). Sweetpotato ranks as the seventh most important crop in the world (FAO 2004a; Loebenstein 2009) and third most important starchy food crop (Padda and Picha 2008). Sweetpotatoes are grown in many developing countries, while over 80% of the crop is grown in developed countries (Woolfe 1992). The sweetpotato grows well in warm climates and is thought to be a tropical plant, which naturally thrives best in the South Atlantic and Gulf Coast States (Grubb and Guilford 2008).
Composition
Table 7. Proximate Composition of Sweetpotato (Wolfe 1992)
In developing countries, sweetpotatoes are an important source of protein where meat (i.e. animal protein) consumption is typically low. However, plant proteins have a relatively low biological value, a measure of the proportion of absorbed protein from a food. Walter et al. (1983) reported the essential (indispensable) amino acid content of oven-dried sweet potato flour made from “Jewel” and “Centennial” sweetpotatoes (Table 8).
Component (%)
Starch 70
Total Sugars 10
Total Fiber 10
Total Protein 5
Lipid 1
Ash 3
Table 8. Concentration of amino acids in sweetpotato flour (Walter et al. 1983) Essential Amino Acids Jewel (g/100g) Centennial (g/100g)
Threonine 5.32 5.57
Valine 6.67 7.55
Methionine 0.97 1.19
Half-cystine 1.22 1.37
Isoleucine 3.94 4.38
Tyrosine 5.85 6.51
Phenylalaline 5.94 6.33
Lysine 3.82 4.47
Sweetpotatoes are one of the major food sources of carotenoids, and orange varieties of sweetpotatoes are richest in β-carotene. The basic structure of β-carotene is made up of eight isoprene units, which are cyclized at each end (Figure 6). These isoprene units are joined together to make up a conjugated chain which is common to all carotenoids. β-carotene, a precursor of vitamin-A, is absorbed in the intestines and stored in the liver where two molecules of vitamin A are formed from one molecule of β-carotene. β-carotene exists as several different isomers including β-carotene and cis-β-carotene, with all-trans-β-carotene being the most common and stable form (Hornung et al. 2005; Cerezo 2012).
occurred in boiled sweetpotatoes. Bengtsson et al. (2008) reported degradation of β-carotene using three processing methods (boiling, steaming and deep-frying). Loss of β-carotene is due to degradation or isomerization when exposed to varying processes or environmental conditions (Bengtsson et al. 2008). Becoff et al. (2009) reported 16-34% loss of all-trans-β-carotene in flour made from dried sweetpotato chips.
Figure 6. Structure of β-carotene
Harvesting, Curing and Processing
Sweetpotatoes are generally harvested 100 to 140 days after planting. After harvesting, sweet potatoes are cured in a storage facility at 85ºF with a relative humidity ranging from 85 to 90% (Kemble 2004). Curing promotes the healing of wounds and reducing losses due to shrinkage and disease and enhances the organoleptic properties (such as texture and flavor) (Edmunds et al. 2008). Improper curing is associated with shorted shelf life, increased sprouting during storage and weight loss (Edmunds et al. 2008).
drying is a widely used industrial process involving the conversion of a liquid into a dried powder (Walstra et al. 1999; Verdurmen and de Jong 2003). Spray drying involves feeding a concentrated liquid product through an atomizer to form small droplets which are dried in the drying chamber and deposited into a collection vessel. The atomizer controls the rate at which the material is fed into the drying chamber (Patel et al. 2009).
Sweetpotato Flakes (SPF)
Drum drying is a processing technology which dries food using a large rotary metal cylinder that is steam heated internally (Walstra et al. 1999). A puree is applied to the hot drum and forms a thin film, and the dried film is scraped from the drum by a steel blade, collected and ground. Film formation is composed of two layers, where the first layer adheres to the drums and is referred to as the burn-on layer (Wadsworth et al. 1967). As the moisture content of the puree is reduced, the puree sticks to the surface forming a thin layer. The second layer called the friction layer, differs in thickness and adheres by surface tension (Wadsworth et al. 1967). This process is used for dried sweetpotato products, such as SPF.
hay-like odor that develops after 6 months of storage at 23ºC (Alexandridia and Lopez 1979). Other reports have indicated the development of hay-like off-flavor after 29 days (Buttery et al. 1961; Walter et al. 1972).
Table 10. β-carotene content of sweetpotato flakes after storage under various packaging conditions (Emenhiser et al. 1999)
Descriptive sensory and consumer acceptance
Leighton et al. (2010) developed a sensory lexicon which included terms to describe texture, aroma, flavor and aftertaste of orange flesh sweetpotato (OFSP) (Table 11).
Leighton et al. (2010) reported that OFSP differed from white flesh sweetpotato (WFSP) in that WFSP had a damp soil, slightly undercooked potato, earthy aroma and a less intense sweetpotato aroma. OFSP were reported to be sweeter, with flavor characteristics of yellow vegetables.
Packaging Conditions
Days Stored
Polypropylene Film, Air Headspace
Nylon Film, Air Headspace
Nylon Film, Under Vacuum
Nylon Film, Oxygen Absorber
β-carotene Content µg/g (% β-carotene retained)
0 39.8 39.8 39.8 39.8
30 34.2 (86.0) 35.1 (88.4) ---- ----
60 27.1 (68.2) 32.3 (81.3) ---- 45.0 (>100.0)
120 20.9 (52.5) 27.8 (69.9) 33.3 (83.7) 45.0 (>100.0)
Table 11. Descriptive sensory lexicon for sweetpotatoes (Leighton et al. 2010)
Attribute Description
Aroma
Earthy Aromatic notes associated with damp soil, wet foliage or slightly undercooked potatoes
Sweetpotato Aromatic associated with cooked sweetpotato, typical of WFSP.
Burn An aromatic associated with vegetables that were burnt while cooking.
Texture – initial impression: squeeze sweetpotato
lightly between fingers, holding it on the skin side
Moistness Hold sample between forefingers and evaluate the amount of wetness/juiciness released by the sample, which is visible when squeezing sample lightly.
Firm Degree to which the sample retains its shape after lightly squeezing it.
First bite
Denseness The solidness/compactness of the sample.
Moistness The amount of moistness/wetness of the sample in the mouth.
Mastication
Fiber Using a fork, gently break piece off sweet potato to observe fibers and then evaluate the amount of stringy fibers perceived in the mouth.
Adhesive (Stickness/pasty) The amount to which the sample sticks to any of the mouth surfaces such as teeth, gums or palate and is perceived as pasty. Grainy Use the tongue to press the sweetpotato on to the palate.
Degree to which surface is uneven, amount of graininess or roughness of particles on chewing.
Flavor
Vegetable sweet Taste characteristics of sweet vegetable varieties, such as sweet corn, sweetpotato, butternut or sweet carrots.
Sweetpotato Flavor notes associated with the taste of cooked WFSP. Yellow vegetables (Butternut, carrots, pumpkin) Taste associated with yellow starchy vegetables such as
butternut, pumpkin, carrots, and, to a lesser degree, squash.
Aftertaste
Sweet An aftertaste that leaves a sweetness on the tongue and in the mouth that is pleasant.
Leksrisompong et al. (2012) published a flavor and texture lexicon for sweetpotatoes (Table 12). The researchers also evaluated consumer acceptance of 12 sweetpotato cultivars. The sensory lexicon included terms on appearance, aroma, flavor, and texture of
Table 12. Sensory attributes of sweetpotato cultivars (Leksrisompong et al. 2012)
Term Definition
Visual
Color homogeneity Degree of evenness of color Moisture Degree of surface moisture Fibrousness Amount of stringy fibers present Texture in mouth
Firmness Amount of force necessary to compress the sample fully between the tongue and the palate
Denseness Degree to which the sample is solid; compactness of the cross section Moistness Degree to which the sample is moist
Smoothness Smoothness of chewed mass
Cohesiveness Degree to which sample holds together after chewing Fibrousness Amount of stringy fibers received
Residual fiber Amount of stringy fibers perceived after swallowing
Chalkiness Degree to which the mouth feels chalky, like raw potato, very fine particles, often perceived on the roof of the mouth
Aromatics
Overall The overall orthonasal aroma impact Brown sugar Aromatic associated with brown sugar Potato Aromatic associated with white baked potato Earthy/canned carrot Earthy aromatic associated with canned carrot Dried apricot/floral Floral aromatics associated with dried apricot Vanilla Aromatics associated with vanilla and vanillin Flavor in mouth
Brown sugar In-mouth aromatic associated with brown sugar Earthy/canned carrot In-mouth earthy aromatic associated with canned carrot Dried apricot/floral In-mouth floral aromatics associated with dried apricot White baked potato In-mouth aromatic associated with white baked potato Vanilla In-mouth aromatic associated with vanilla and vanillin Sour taste Basic taste stimulated by acid
Sweet taste Basic taste stimulated by sugar Bitter taste Basic taste associated with caffeine
Umami Basic taste associated with monosodium glutamate
Astringent Sensation of drying, drawing and/or puckering of any of the mouth surfaces
Resisto (OFSP). Principle component analysis (PCA) illustrated relationships among descriptive terms and sweetpotato cultivars. Resisto was characterized by watery texture, pumpkin flavor and orange color. Sinia B was characterized by creamy color, coarse texture, yellow color and sweet taste. Karote DSM was characterized by orange color. Polista was characterized by starchiness, hard texture and fibrous texture. Consumer acceptability testing revealed that OFSP were preferred over PFSP.
Dansby and Bovell-Benjamin (2003a) used descriptive sensory analysis to describe the appearance, flavor and texture of an extruded sweetpotato cereal. Two different
formulations were used, one containing 100% sweetpotato flour (SPF) and the second containing 75% SPF/ 25% whole wheat bran (WWB). A 100% WWB cereal and a
commercial cereal were compared. Color intensity was highest in the 75% SPF / 25% WWB and 100% WWB formulation. Sweet taste was most apparent in the 100% WWB followed by the 100% SPF formulation. The degree of liking among sweetpotato cereals (100% SPF and 75% SPF / 25% WWB) were not different and were liked slightly among the test population of school age children (Dansby and Bovell-Benjamin 2003b).
Flavor Constituents
constituents among baked, boiled and microwaved Jewel sweetpotato and identified the compounds that were related to specific cooked product aromas. A wide variety of baked sweetpotato volatiles, including hydrocarbons, acids, alcohols, aldehydes, esters, furans, ketones, and nitrogen containing compounds have been identified (Kays 1992). Volatiles released from cooked sweetpotatoes are derived from two primary sources: (1) the increased volatility of compounds already present; and (2) chemical reactions occurring during cooking that result in de novo synthesis of products (Kays 1992). Cooking methods influence heat penetration and internal temperature of sweetpotatoes. Each of these factors influences the synthesis of new compounds (Wang and Kays 2000). Out of 36 compounds identified from the sweetpotato, 54.3 and 6.4% compounds were from boiled and microwaved
sweetpotatoes, respectively (Wang and Kays 2000). Baked sweetpotatoes contained all of the odor active compounds and had higher concentrations than other cooking methods.
Kays et al. (2005) used sucrose equivalents (SE) to measure relative sweetness among sweetpotato varieties. The majority of sweetpotatoes were high in sucrose which ranged between 29 to 37 g/100g (dry mass). The carbohydrate content of six varieties of
Table 13. Volatile compounds identified in cooked sweetpotatoes (Horvat et al. 1991) Compounda Jewel (area %) Tainung 57 (area %) 99 (area %)
Toluene tr tr Tr
Pyridine + xylene tr tr Tr
Furfural 1.1 1.3 1.0
2-acettylfuran tr tr tr
Benzaldehyde 2.7 1.0 1.5
5-methyl-2-furfual 10.1 2.1 5.9
Limonene tr tr tr
Cineole tr tr --
Phenylacetaldehyde 2.6 tr 2.2
Linalool + nonanal 4.3 1.2 tr
-terpineol 4.4 tr tr
β-cyclocitral tr tr tr
Bornyl acetate 10.5 1.1 4.3
-copaene 5.8 2.3 13.8
Caryophyllene 1.7 tr 2.7
Sesquiterpene hydrocarbon I
tr tr tr
Sesquiterpene hydrocarbon II
tr tr tr
(E)-β-farnesene 2.5 tr 1.9
-cadinene 1.3 -- 1.0
β-ionone 4.6 1.8 7.4
Sesquiterpene hydrocarbon III
1.2 tr --
Sesquiterpene hydrocarbon IV
tr 1.3 tr
Palmitic acid 2.5 1.1 1.5
a
MILK POWDER
Introduction
Milk and dairy products are major components of the human diet in Western countries. Bovine milk is consumed more than any other type. Fluid milk, cheese, butter, whole milk powder, skimmed milk powder, yogurt, fermented milk products, casein and infant formula make up total world milk utilization (Fox 2003).
The United States (US) is the largest dairy processor in the world, producing 800,000 mt of dry milk powder (DMP) each year (USDEC 2011). DMP is easily instantized,
convenient, and economical source of dairy solids. DMP is classified as either non-fat dry milk powder or whole milk powder (WMP). Using DMP instead of fluid milk reduces transport costs, storage space and eliminates refrigerated shipping and warehousing of the product (Verdurmen and Jong 2003). In addition, milk powders exist in roller-dried and spray-dried form, the latter being the most common.
Composition
Whole milk contains, about 87% water and skim milk contains about 91% water. Milk powders are highly nutritious containing fat, protein, minerals, vitamins, lactose and water. WMP has a composition of 2.0-4.5% moisture, 26.0-29% fat, 24.5-27.0% protein, 36.0-38.5% lactose and 5.5-6.5% ash (DMI 2005; Kim et al. 2009; USDEC 2011).
26-40%, while the moisture should be no more than 5% based on milk solids (CFR 2008c). Non-fat milk powder (NFMP) is obtained by the removal of water from pasteurized skim milk (CFR, 2008c). The final product should be no more than 1.5% milk fat and the moisture content should be less than 5% (CFR 2008c). NFMP is composed of 3.0-4.0% moisture, 0.6-1.25% fat, 34.0-37.0% protein, 49.5-52.0% lactose, and 8.2-8.6% ash (USDEC 2011). Carbohydrates are a major component in milk powder, and accounts for 54% of the total solids, non-fat portion of milk (USDEC 2011). Whey proteins and caseins are two types of proteins in milk. Casein makes up 80% of bovine milk proteins. Milk proteins contain all 9 essential amino acids required by humans and the amino acid composition is presented in Table 14. DMP can also be fortified with vitamins and minerals.
Final quality is an important consideration in the preservation of milk powders
Table 14. Amino Acid Composition of Milk Powder (USDEC 2011)
Amino Acids Whole Milk Powder (g/100g) Skim Milk Powder (g/100g)
Tryptophan 0.37 0.51
Threonine 1.19 1.63
Isoleucine 1.59 2.19
Leucine 2.58 3.54
Lysine 2.09 2.87
Methionine 0.66 0.91
Cystine 0.24 0.33
Phenylalanine 1.27 1.75
Tyrosine 1.27 1.75
Valine 1.76 2.42
Arginine 0.95 1.31
Histidine 0.71 0.98
Alanine 0.91 1.25
Aspartic acid 2.00 2.74
Glutamic acid 5.51 7.57
Glycine 0.56 0.77
Proline 2.55 3.50
Serine 1.43 1.97
Oxidation
Liang (2000) used fluorescence and oxidation parameters to investigate the changes in (WMP) stored at 37, 50, 60 and 70ºC. Whole milk powder extracted with chloroform-methanol and assayed by transmission spectrofluorometry suggested that lipids are critical components contributing to the formation of intrinsic fluorescence. Fresh WMP had an excitation peak with a maximum wavelength of around 270 nm and oxidized samples had two peaks with wavelength maximum at 270 and 350 nm. The emission spectra for the oxidized sample showed an intensive and broad peak at 440 nm. The fluorescence intensity at 350 nm excitation and 440 nm emission increased significantly during oxidation.
However, the spectra of skim milk powder did not change in wavelength during storage, suggesting that skim milk powder had little to no oxidation during storage. The author also suggests that fluorescence intensity is a better index of milk powder oxidation than peroxide value.
Flavor
and aroma models to identify compounds characteristic of high-heat skim milk powder. Key odorants in high heat skim milk powder have been described as animal, brothy,
metallic/mushroom-like and vitamin-like (Kobayashi et al., 2008). Karagül-Yücee et al. (2002) reported the volatile flavor compounds of stored nonfat milk using
gas-chromatography-olfactometry and descriptive sensory. Aldehydes, ketones, and free fatty acids were responsible for generation of flavors in NFMP. (E,E)-2,4-decadienal (fried/fatty), o-aminoacetophenone (corn tortilla), acetic acid and hexanoic acids (sour/vinegar), butanoic acid (cheesy), pentanoic acid (sweaty), 2,5-dimethyl-4-hydroxy 3(2H)-furanone and 2-methyl-3-hydroxy-4H-pyran-4-one (burnt sugar), 3-(methylthio)propanal (boiled potato), octanoic, decanoic and dodecanoic acids (waxy), p-cresol (cowy/barny), 3-methylindole (fecal), dimethyl trisulfide (cabbage) and phenylacetic acid (rose-like) and 1-octen-3-one (mushroom) exhibited high aroma impact using AEDA (Karagül-Yücee et al. 2002).
Flavor as affected by storage
cooked caramelized and milk fat/lactone in WMP decreased in flavor intensity during storage.
READY-TO-USE THERAPEUTIC FOODS (RUTF)
Introduction
Malnutrition, a major public health problem, is a primary contributor to child mortality and total global disease burden (WHO 1999; Müller and Krawinkel 2005; WHO 2007). Individuals are considered to be malnourished or suffer from under nutrition if their diet does not provide adequate calories and protein for maintenance and growth, or they cannot fully utilize the food they eat due to illness (Müller and Krawinkel 2005). Several different nutrition disorders may develop depending on which nutrients are lacking.
In 2000, 189 nations made an agreement to relieve people from extreme poverty and multiple deprivations, and these goals became known as the Millennium Development Goals (MDG). MDG are eight international development goals agreed to by world leaders to achieve by the year 2015. Those goals are: (1) eradicating extreme poverty and hunger, (2) achieving universal primary education, (3) promoting gender equality and empowering women, (4) reducing child mortality rates, (5) improving material health, (6) combating HIV/AIDS, malaria, and other diseases, (7) ensuring environmental sustainability and (8) developing a global partnership for development. These goals have not been fully achieved and efforts are still being made to combat these issues.
SAM is defined by a very low weight for height, by severe wasting or by the presence of nutritional oedema. Protein-energy malnutrition in children is defined by measurements that fall below the normal weight for age (underweight), height for age (stunting), and weight for height (wasting) (Pinstrup-Anderson et al.1993; WHO 2007). A child between the ages 6-59 months with an arm circumference of less than 110 mm is also a sign of SAM (WHO 2007). Children under the age of 5 are particularly at risk from malnutrition because of demanding dietary requirements (Figure 7). In addition, children living in rural areas are almost twice as likely to be underweight than children in urban households. In particular, children in Africa and Asia have higher incidence of stunting, being underweight and wasting (Table 16).
Table 15. Prevalences of protein-energy malnutrition among children under 5 years of age in developing countries, 1995 (Müller and Krawinkel 2005)
RUTF
The burden of child mortality due to SAM primarily remains absent from the
international health agenda and there are few national policies aimed at addressing the issue comprehensively. Community based approaches are one way of combating issues such as SAM. The standard treatment for SAM was originally with therapeutic milk (Formula-75 and Formula-100), which was developed in the 1980s by Nutriset, a French private company specializing in therapeutic foods, which had to be administered in a hospital setting (Guimón and Guimón 2012). Formula-75 (F-75) and Formula-100 (F-100) was designed as phase 1 and phase 2 treatments. F-75, phase 1, is given as a stabilization treatment for SAM. A malnourished child admitted to a hospital will likely have infections or diseases of some sort, and also the organs are incapable of metabolizing normal quantities of proteins, fat or
Figure 9. F-75 and F-100 therapeutic milk in dehydrated form
Plumpy’nut
Plumpy’nut® is peanut-base RUTF used to treat SAM and is manufactured by Nutriset. Nutriset has a patent (US 6,346,284) for a complete food or nutritional supplement (Briend and Lescanne 2002), which would cover products such as Plumpy’nut®.
Plumpy’nut® has a two year shelf life and requires no water, preparation, or refrigeration, and does not support the growth of bacteria because of low-moisture and high fat content (Linneman et al. 2007). Unlike therapeutic milk, Plumpy'nut® can be administered at home and without medical supervision. The ingredients in Plumpy'nut® include peanut-paste, sucrose, vegetable fat and skimmed milk powder, enriched with vitamins and minerals. The fat suspension of Plumpy’nut® makes the addition of vitamins and minerals very stable (Guimón and Guimón 2012).
MANA
Clinical evidence of using RUTF
In Malawi, a food insecure country, a large feeding trial study using locally produced RUTF was conducted with severely and moderately malnourished children (Linneman et al.
2007). The RUTF consisted of 25% peanut butter, 28% sucrose, 30% full-cream, 15% vegetable oil, and 1.4% imported vitamin and mineral supplement. The study included 2,131
and 806 severely malnourished and moderately malnourished children, respectively. Of the original 2,131 and 806 participants, 89 and 85% recovered with weight gain. In another study where standard therapy (F-100 and hospitalization) and home-based therapy (RUTF) was used, the outcome of the study revealed that home-based therapy with RUTF resulted in higher rates of recovery (Ciliberto et al. 2005). Patel et al. (2005) evaluated the effectiveness
REFERENCES
Abegaz EG, Kerr WL, Koehler PE. 2004. The role of moisture in flavor changes of model peanut confections during storage. Lebensm Wiss Technol 37:215-25.
Alexandridia N, Lopez A. 1979. Lipid changes during processing and storage of sweetpotato flakes. J Food Sci 44:1186-90.
American Peanut Council. 2008. Peanuts: A Brief History. Available at:
http://www.peanutsusa.org.uk/Europe/index.cfm?fuseaction=home.page&pid=72.
Andersen PC, Hill K, Gorbet DW, Brodbeck BV. 1998. Fatty acid and amino acid profiles of selected peanut cultivars and breeding lines. J Food Comp Anal 11:100-11.
ASTM. 1995. Standard definition of terms relating to sensory evaluation of materials and products. In Annual Book of ASTM Standards. Vol. 15.07 American Society for Testing and Materials, Philadelphia, Pennsylvania.
Ballard, T. S., Mallikarjunan, P., Zhou, K. and O’Keefe, S.F. 2009. Optimizing the Extraction of Phenolic Antioxidants from Peanuts Skins Using Response Surface Methodology. J. Agric. Food Chem. 57: 3064-3072.
Baker, G.L, Cornell, J.A., Gorbet, D.W., O’Keefe, S.F., Sims, C.A., and Talcott, S.T. 2002. Storage water activity affects oxidation and sensory properties of high oleic peanuts. J. Food Sci. 67:1600-1603.
Basha SMM, Cherry JP, Young CT. 1980. Free and total amino acid composition of maturing seed from six peanut (Arachis hypogeal L) cultivars. Peanut Sci 7:32–7.
Bate-Smith EC, Swain T. 1962. Flavonoid compounds. In Comparative Biochemistry. Mason, H.S., Florkin, A.M., Eds.: Academic Press: New York. pp. 755-809.
Bechoff A, Dufour D, Dhuique-Mayer C, Marouzé C, Reynes M, Westby A. 2009. Effect of hot air, solar and sun drying treatments on provitamins A retention in orange flesh
sweetpotato. J Food Eng 92:164-71.
Beecher JW, Drake MA, Luck PJ, Foegeding EA. 2008. Factors regulating astringency of whey protein beverages. J Dairy Sci 91:2553-60.
Bengtsson A, Namutebi A, Alminger ML, Svanberg U. 2008. Effects of various traditional processing methods on the all-trans-β-carotene content of orange-fleshed sweetpotato. J Food Comp Anal 21:134-43.
Bett KL, Vercellotti JR, Lovegren NV, Sanders TH, Stinsch RT, Rasmussen GK. 1994. A comparison of flavor and compositional quality of peanuts from several origins. Food Chem 51: 21-7.
BFC. Bruce Foods Corporation. 2008. Product specification and nutritional facts. Instant sweetpotato flakes.
Biolatto A, Grigioni G, Irurueta M, Sancho AM, Taverna M, Pensel N. 2006. Seasonal variation in the odour characteristics of whole milk powder. Food Chem 103:960-67. Boskou D, Elmadfa I. 1999. Frying of food: oxidation, nutrient, and non-nutrient
antioxidants, biologically active compounds and high temperatures. CRC press: Boca Raton, FL. pp. 1-277.
Bourne MC. 1978. Texture profile analysis. Food Technol 32:62-6.
Bourne MC. 2002. Food Texture and Viscosity: Concept and Measurement. 2nd Ed. Acdemic Press. pp. 1-400.
Bovell-Benjamin AC. 2007. Sweetpotato: A review of its past, present and future role in human nutrition. Advances in Food Nutr Res 52: 1-59.
Braddock JC, Sims CA, O’Keefe SF. 1995. Flavor and Oxidative Stability of Roasted High Oleic Acid Peanuts J Food Sci 60:489-93.
Brandt MA, Skinner EZ, Coleman JA. 1963. Texture profile method. J Food Sci 28:404-9. Breene WM.1975. Application of texture profile analysis to instrumental food texture evaluation. J Texture Stud 6:53-82.
Breslin PAS. 2001. Human gestation and flavour. J Flav Fragr 16:439-56.