FE SIMULATION OF PRACTICAL ULTRASONIC NDE INSPECTIONS –
UTILIZING CUSTOM CLOUD ARCHITECTURE FOR A 1000X
REDUCTION IN SIMULATION TIME
Andrew Tweedie1, Gerry Harvey2 and Robbie Banks3
1 European R&D Manager, PZFlex, Weidlinger Associates, Glasgow, UK 2 European Manager, PZFlex, Weidlinger Associates, Glasgow, UK 3 Director, PZFlex Weidlinger Associates, Mountain View, CA
ABSTRACT
As new manufacturing techniques and materials begin to penetrate through to large scale industrial use at an increasing pace, so too does the demand for reliable and robust inspection techniques to maintain safety critical features. The use of simulation methods to develop new inspection protocols is becoming an essential tool for the NDE industry in particular. Current analytical and ray-tracing methods are proving inadequate with many of the exotic materials/components now commonplace in a wide variety of industries, but primarily in nuclear power. The realization that new simulation tools are required, along with an increase in cheap computing power, have led to Finite Element (FE) approaches becoming a much more viable tool in prototyping new inspection techniques. However, the large, complex simulations demanded of these applications are often too computationally expensive to yield the desired cost-to-benefit ratio.
This paper demonstrates a combination of the highly-efficient FE code, PZFlex, leveraged with bespoke cloud computing architecture that offers a substantial reduction in required simulation times. By customizing PZFlex for cloud implementation, users can now instantiate many virtual machines simultaneously to facilitate parameter sweeps in parallel runs, rather than sequential ones. Examples that feature a wedge-coupled phased array with a full set of delay laws to replicate beam forming and beam-sweeping techniques, in addition to Full Matrix Capture methods, are presented as test cases.
INTRODUCTION
Finite Element Analysis has found a vast array of applications over the last 40 years, particularly in Virtual Prototyping of new products and analyzing the complex physics associated with large-scale, non-linear and dynamic problems. The PZFlex code was developed from a family of codes designed specifically for blast and impact analysis in the 1980s. Since then it has proven to be the premier package for ultrasonic applications, offering practical solution times several orders of magnitude faster than existing codes.
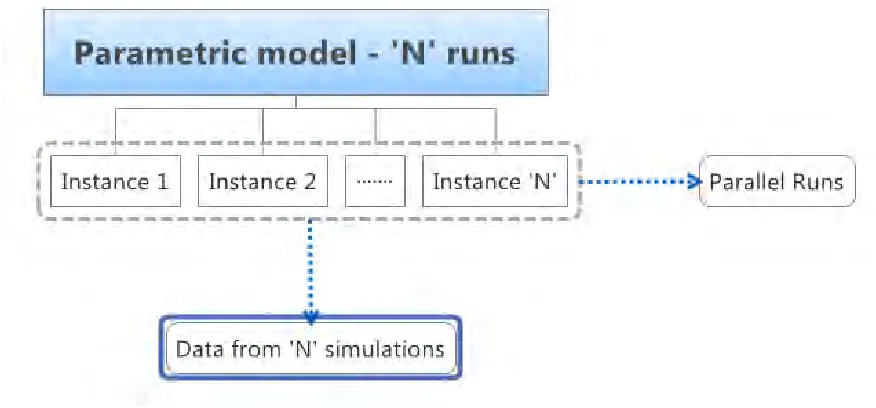
Nevertheless, implementing entire Ultrasonic NDE Inspections requires hundreds, if not thousands, of unique models to replicate the data-set gathered from a snap-shot of a practical inspection. To counter this limitation, PZFlex has now been implemented on a bespoke cloud computing architecture that easily facilitates many parallel instances of the software, as shown in Figure 1. This new development allows the user to run all de-coupled models in a single parallel batch without the need for an in-house supercomputer and specialized license of the software.
entire data-set is now available in 2 minutes total simulation time. This new capability makes the design and computational testing of novel inspection methods a rapid and economical prospect.
Figure 1. Visual representation of massively parallel parametric FE simulations on custom cloud architecture
METHODOLOGY
Inspection Arrangement
A typical wedge-coupled phased array inspection scenario for examining defects in a well-characterised representation of an anisotropic weld has been used throughout this paper.
The 64 element phased array was designed to maximise bandwidth, ensuring a short pulse length for maximum resolution. To achieve this performance, a 1.07 mm thick 1-3 piezocomposite structure was selected, with 2 pillars under each array element, and a soft epoxy filler. Each pillar was 0.3 mm wide with a kerf of 0.2 mm to give an active element size of 0.8 mm and pitch of 1mm . The array was backed with a 15 mm thick tungsten loaded epoxy material with an acoustic impedance of 10 MRay. Finally, a quarter-wavelength 4.64 MRay acoustic matching layer was employed to promote sensitivity and further increase bandwidth. It should be noted that the 2D plane strain configuration of the model approximates this array as a 2-2 piezocomposite but it is an effective approximation of a linear array.
A Rexolite wedge was used to couple sound into the test piece. An 18 degree wedge angle was selected to generate a longitudinal wave with a natural angle of 45 degrees in the component. The design of the wedge was intentionally kept simple, with no attempt made to damp unwanted reflections; the effects of this simple design are noted in the resulting images. Interestingly, the type of parametric study that would be required to optimise the wedge design to reduce such spurious reflections aligns very well with the work described in this paper.
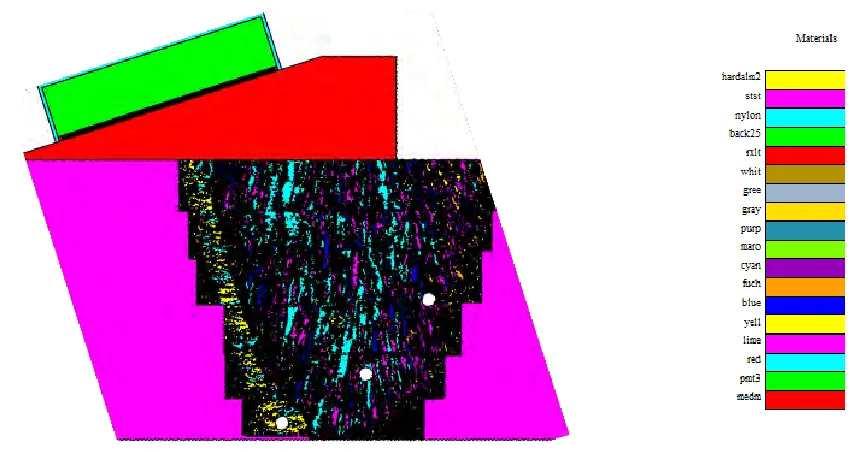
Figure 2. FE simulation of piezoelectric phased array on a wedge focusing to three 2mm SDH in an anisotropic weld structure surrounded by stainless steel.
Figure 3. (a) An austenitic weld showing the buttering and cladding layers. (b) Processed weld map where color regions represent unique areas of dominant crystal orientation detailed in Table 1. This map is also
read into PZFlex to represent the weld. ((a) and (b) from Harvey et al (2010))
Anisotropic Weld
The initial use of the electron back-scatter diffraction (EBSD) technique for the quantification and mapping of austenitic weld microstructure for inspection design was presented in the 10th ECNDT conference by Carpentier et al (2010). The EBSD technique implemented in a scanning electron microscope is widely used to determine the microtexture of crystalline materials, and provides accurate information on the crystallographic orientation of the entire weld cross-section scanned.
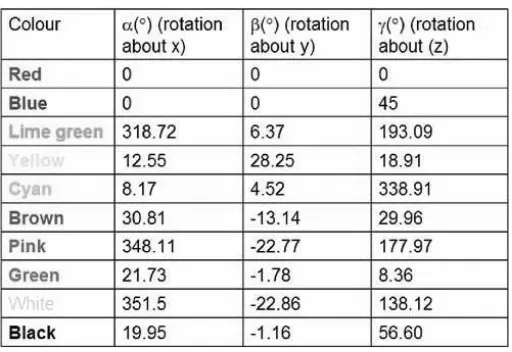
for simulating such difficult problems. The specimen used represents a typical dissimilar joint used for the safe-end in pressurised water reactors and is shown in Figure 3(a). Information related to the grain boundaries, shown in Figure 3(b), and orientations of the grain microstructure, presented in Table 1, were taken from these papers. For clarity, the measured stiffness constants for this weld are taken to be C11=203.6 GPa, C12=133.5 GPa and C44=129.8 GPa, from Lenkerri et al (1980).
Table 1. The ten dominant orientations used for the weld map; the crystallographic orientations are expressed as three rotation angles about the x, y and z axes of the component reference frame, as required
for modelling. (Harvey et al (2010))
Finite Element Analysis
As the structure of the medium under investigation becomes increasingly complex in composition, analytical and semi-analytical models for simulating ultrasound propagation no longer offer an accurate solution in a reasonable solution time. Indeed, unfeasibly long computational time is often a deterrent for the application of FEA to such a problem. However, as the PZFlex code is specifically designed to model large wave propagation problems with difficult media, such 2D problems can be solved in the order of minutes, with solutions from 3D representations available in the order of hours.
From the EBSD scan a series of discrete crystal orientations can be selected during post-processing and used to indentify macro-regions of the weld that are similar in behaviour, i.e. any structure within +/- 20° of the dominant orientation is classed as having the same orientation. This enables a simplified color-coded map to be generated where each color pertains to a particular crystal orientation in a 3 axis system, as shown in Figure 2. As the stiffness matrix for the crystal is known, it is then possible to transpose this matrix to the discrete orientations extracted from the EBSD scan. This results in each color having a unique set of material properties, representing anisotropy in the simulation.
The model is then meshed for an element size that is below the Rayleigh scatterer limit of 300μm and is sufficient for wave propagation accuracy at target frequencies. In this case element size is set to 100μm to satisfy both criteria. The final model is approximately 1.7million elements in size and is a 2D plain strain model.
RESULTS
Imaging Algorithms
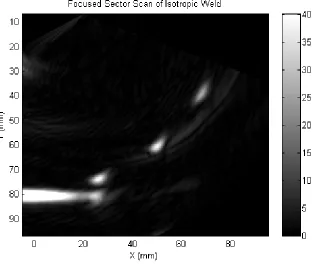
Two alternative imaging algorithms were compared, Focused sectors scan and the Total Focusing Method. Focused sector scans are used routinely in NDE, and are implemented in commercially available array controllers. Dynamic Depth Focusing (DDF) was applied to the focused sector scans to improve image resolution. DDF utilizes multiple transmit focal laws for each focal angle, and calculates a receive focal law for every sample in the received A-scan. The beam was swept in 0.5 degree steps between 0 and 70 degrees, with 8 focal depths for each angle, resulting in 1128 unique transmit focal laws. Therefore, this method requires 1128 unique simulations in PZFlex.
The second algorithm used was the Total Focusing Method (TFM) from Holmes et al (2005). In this method each array element is used to transmit a pulse, and the reflected waves are recorded on every array element. This inspection approach is known as full matrix capture (FMC), as a matrix of A-scans are collected, each one representing a transmit-receive pair. The TFM algorithm uses this data set to produce an image that is focused to each point in the test piece. An advantage of this approach is that only 64 simulations were required for the 64 element array in this arrangement.
Results
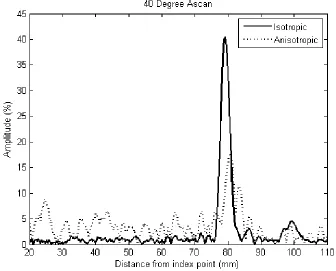
The modeled results clearly show that the anisotropic nature of the weld has a significant adverse effect on the inspection. From Figure 4 the pressure wave generated by the array can be seen in both the isotropic and anisotropic situations for a 40 degree focused sector scan. In the isotropic case a tight focus is achieved, and the advancing wave fronts are undistorted. In contrast, the pressure wave in the anisotropic simulation is distorted, and a trial of reverberating energy can be seen in the weld’s grain structure. This variation in phase due to non-uniform wave-speed will have a direct effect on the fidelity of any of the conventional imaging methods used in this inspection.
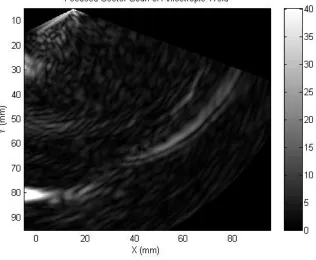
When the two imaging methods are implemented with the simulated inspection data, the isotropic case for both imaging algorithms produces similar results, as shown in Figure 5 and Figure 6 for DDF and TFM respectively. The back wall reflection is clearly defined, along with the 3 side drilled holes. The amplitude of the 60 degree hole is around 3 dB lower than the other two, and this can be attributed to the limited element acceptance angle of the array design, and a lowering of the longitudinal transmission coefficient at higher angles of refraction. Artifacts introduced by internal reflections within the wedge are notable, particularly those from the top corner of the wedge, which results in an arc at a radius of approximately 85 mm in the image. This would be problematic in the inspection under consideration, as it lies close to the expected defect range.
The images generated in the anisotropic weld are significantly poorer, and illustrate the difficulties encountered in this type of inspection, as shown in Figure 7 and Figure 8 for DDF and TFM respectively. The defects are no longer visible, and the back wall reflection is significantly scattered where the wave passes through the weld material. Once again, both images are similar, with neither algorithm offering a distinct advantage. It should be noted that the images were scaled so that the back wall reflection was 100%, to allow direct comparison between imaging techniques.
Figure 4. Phase aberration due to anisotropic weld grain structure
Figure 6. TFM in an Isotropic Stainless Steel weld with three 2mm SDH defects present
Figure 8. TFM in an Anisotropic Stainless Steel weld with three 2mm SDH defects present.
CONCLUDING REMARKS
Developing new, or improved, inspection methodologies that can handle the complex and difficult materials found in many modern industries has become a topic of great interest in the NDE arena recently. Not only do conventional imaging and inspection techniques fail to provide reliable and repeatable results, engineers cannot rely extensively on many common simulation tools to develop alternative protocols to help guide improved inspections. The example of the virtual inspection of a well-characterized anisotropic weld presented in this paper clearly illustrates the difficulties that will arise. Indeed, the failure of conventional techniques to image defects placed in the grain structure further reinforces the community’s emphasis on finding new ways to approach these materials.
This perceived gap in simulation capability has lead to FEA presenting itself as a valuable tool for to helping better understand both the mechanisms which lead to the breakdown of established techniques, and how to prototype inspections that may deliver improved performance. As PZFlex is a transient code that is optimized for wave-propagation and piezoelectric simulation, it is possible to extract data of practical use in a reasonable time from simulations, hence allowing users to compare directly with experimental data.
However, until recently, performing an entire inspection via simulation still required a great deal of computational resource and time. The introduction of PZFlex on the cloud now facilitates several step-changes in how users can approach these simulations. Firstly, massively parallel parameter sweeps can be performed in parallel through setting up hundreds of virtual machines, each with an instance of the code, drastically reducing overall simulation time by 3 orders of magnitude. Secondly, this ability to parallise also augments PZFlex MPI capabilities and allows for multi-billion element problems to be readily solved on cloud implementations. Finally, with cloud computing, users will always have access to the latest hardware and will therefore always be on the cutting edge of what can be simulated in a reasonable time-frame.
REFERENCES
Carpentier, C., Nageswaran, C., and Y Y Tse (2010). “Evaluation of a new approach for the inspection of austenitic dissimilar welds using ultrasonic phased array techniques”, Proc 10th ECNDT conference, Moscow, RUS.
Harvey, G., Tweedie, A., Carpentier, C. and Reynolds, P. (2010) “Finite Element Analysis of Ultrasounic Phased Array Inspections on Anisotropic Welds” pp. 827-834; Review of Progress in Quantitative Nondestructive Evaluation, Volume 30A; Volume 30B, 18–23 July, San Diego, California, USA. Holmes, C., Drinkwater, B. W. and Wilcox, P. D. (2005) “Postprocessing of the full matrix of ultrasonic
transmitreceive array data for non-destructive evaluation,” Nondestr. Test Eval. Int., vol. 38, no. 8, pp. 701–711.