ABSTRACT
AHN, JONGHOON. Development of Energy Performance Metrics for Airport Terminal Buildings using Multivariate Regression Modeling. (Under the direction of Dr. Soolyeon Cho.)
Improving energy efficiency within the U.S. building sector is a critical issue due to
the fact that buildings account for more than 40% of total energy use in the U.S. Amongst
buildings, Airport Terminal Buildings (ATBs) are one of the most energy-consuming
building types. This is because ATBs consist of multiple different building types in a
large-scaled one-roofed structure. ATB constituents can include offices, retailers, food services,
and so on. Therefore, it is imperative to develop effectual metrics to measure the energy
performance of ATBs.
In spite of being one of the major building types, ATBs are historically rarely
included in energy performance studies and surveys. Moreover, most existing energy
performance benchmarking methods have mainly focused on common and single-use
buildings, including their system parts. Due to lack of the information and the benchmark
methodology, many designers and researchers are unable to perform optimal energy design
practices for ATBs.
This dissertation proposes the Multivariate Regression Model (MvRM) to benchmark
the energy performance of ATBs. It is developed using a statistical validation process which
includes the analyses of measured data, utility bills, simulation results, and regression
Furthermore, real data from 20 existing ATBs across North and Central America were used
to define weighted values reflecting their space programs. Each adjusted EUIwas induced
and used to calculate a more refined average EUI in the cases where sufficient examples
were not provided. By using the analyses, actual measured EUIs are adjusted to define the
energy performance of target ATBs. Also, by using the results, a more dependable average
EUI is calculated to evaluate the performance of existing ATBs as well as estimate the
energy consumption of future ATBs. Utilizing case studies of train station complexes and
subway stations, the effectiveness of the MvRM for ATBs and the expandability to analyze
© Copyright 2016 Jonghoon Ahn
Development of Energy Performance Metrics for Airport Terminal Buildings using Multivariate Regression Modeling
by Jonghoon Ahn
A dissertation submitted to the Graduate Faculty of North Carolina State University
in partial fulfillment of the requirements for the degree of
Doctor of Philosophy
Design
Raleigh, North Carolina
2016
APPROVED BY:
_____________________________ _____________________________
Dr. Soolyeon Cho Dr. Wayne Place Committee Chair
BIOGRAPHY
Jonghoon Ahn received his B.A. degree from Yonsei University at Seoul in South
Korea, and his M.Arch. degree from Clemson University at South Carolina in United States.
While studying in the Ph.D. program, he has worked as a teaching/research assistant at the
Department of Architecture in College of Design. His research and teaching interests focus
on improving benchmarking methods, energy performance, and advanced control systems at
design phases. Currently, he is conducting a research project on the improvement of building
energy performance benchmark by statistical tools and building control algorithms by
ACKNOWLEDGMENTS
I would like to express my sincere appreciation to my advisor, Dr. Soolyeon Cho for
his kind and thoughtful supports. Dr. Cho’s wide knowledge and futuristic direction have
helped me to sail my studies towards successful achievements of this dissertation. I also
sincerely appreciate my committee members, Dr. Wayne Place, Dr. Jianxin Hu, and Dr.
Stephen Terry, for inspiring questions from their insights, and Dr. Art Rice as Director of
Ph.D. program, and Marvin Malecha as Dean of the College of Design.
I would like to express my gratitude to Profs. Hyun Ick Shin, Profs. Chungkeun Park,
Profs. Kyu-Duhk Seo, Dr. Dae Hun Chung, and Principal Baewon Koh, who have
encouraged and inspired me during my Ph.D. study. I thank to my 2012 classmates in
College of Design and new friends in Raleigh for productive discussions and their kind helps
throughout the years. Needless to say, I also thank guys, my friends in Korea, for sharing
their lives with me.
I send my deep appreciations to my family members, Hakno Ahn, Okhui Kim, Insook
Ahn, Suhyung Lee, Myoungsook Jo, Jaechul Lee, Jeseong Kim, Gyoungah Lee, and Gyuri
Kim, who have always supported me both materially and spiritually since I decided to study
abroad and came to this land. Most of all, my deepest appreciation should go to my wife and
son, Jaeah Lee and Huey Lee Ahn. It was totally impossible to get any small achievements in
TABLE OF CONTENTS
LIST OF TABLES………vii
LIST OF FIGURES………ix
1. INTRODUCTION ... 1
1.1 Energy... 1
1.2 Airport Terminal Buildings ... 2
1.3 Energy Performance Benchmark ... 2
1.4 Research Question ... 3
1.5 Research Goal and Objectives ... 4
1.6 Overview of Chapters ... 4
2. LITERATURE REVIEW ... 6
2.1 Energy... 6
2.1.1 Energy Use Intensity (EUI) ... 6
2.1.2 Building Sector ... 7
2.1.3 Commercial Sector ... 8
2.1.4 Energy Supply ... 9
2.1.5 Recent Movement ... 10
2.1.6 Databases and Tools ... 12
2.1.7 Summary ... 17
2.2 Airport Terminal Building (ATB) ... 17
2.2.1 Various Space Types in ATB ... 18
2.2.2 Design Manuals ... 19
2.2.3 Recent Movement ... 20
2.2.4 Implementation of Energy Savings Technology ... 23
2.2.5 Energy Performance Surveys ... 30
2.2.4 Summary ... 33
2.3 Energy Performance Benchmark ... 33
2.3.1 Benchmark ... 33
2.3.2 EUI Model ... 34
2.3.3 Summary ... 39
2.4 Summary of Literature Review ... 39
3. METHODOLOGY ... 41
3.2 Variables ... 44
3.2.1 Independent Variables ... 44
3.2.2 Dependent Variables ... 44
3.3 Data Mining ... 45
3.3.1 Actual Measured Data/Utility Bills ... 45
3.3.2 CBECS Data ... 46
3.3.3 Simulated Data ... 48
3.4 Modeling... 50
4. RESULTS AND RESEARCH FINDINGS ... 55
4.1 Benchmark for 20 ATBs ... 55
4.1.1 Weighted Values and Regression Coefficients ... 55
4.1.2 MvRM model ... 64
4.1.3 Energy Performance Benchmark ... 66
4.1.4 Benchmark for ATBs ... 68
4.2 Application to Mass Transportation Buildings ... 70
4.2.1 Case Study: Train Station Complexes (TSCs) ... 70
4.2.2 Case Study: Subway Stations (SUBs) ... 87
4.3 Application to Recently Reported 10 ATBs ... 108
4.4. Research Findings ... 111
5. CONCLUSIONS AND FUTURE STUDIES ... 132
5.1 Conclusions ... 132
5.2 Future Studies ... 135
LIST OF TABLES
Table 2-1 Example of the 2003 CBECS reports (Part) ... 13
Table 2-2 Example of the U.S. National Average Site EUI ... 14
Table 2-3 Design Manuals for ATB and Related Facilities ... 20
Table 2-4 LEED certificated ATBs in the U.S. as of 2012 ... 23
Table 2-5 Energy Saving Technologies implemented in 23 Airports ... 24
Table 2-6 Comparison between LED, CFL, and Incandescent Bulb ... 26
Table 2-7 Specification and Performance Comparison between T12 and T8 ... 27
Table 2-8 Estimated Cost, Payback, and Savings for Lighting Technologies ... 28
Table 2-9 Energy Efficient Lighting and Energy Saving Technologies implemented ... 29
Table 2-10 Information of 10 U.S. ATBs ... 30
Table 2-11 Information for 12 ATBs in North and Central America ... 32
Table 3-1 Simulation Configurations ... 49
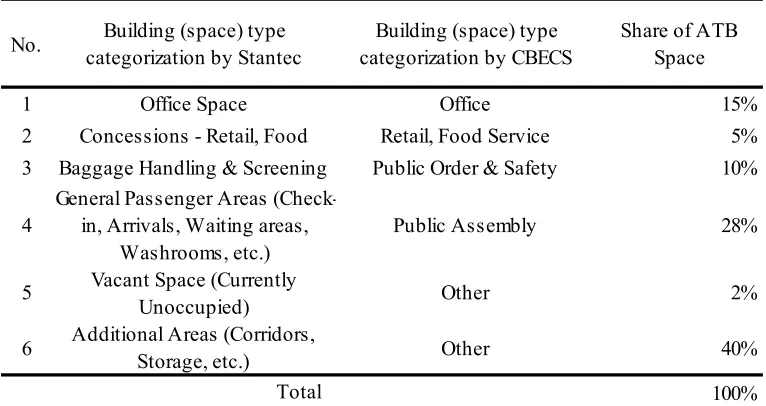
Table 4-1 Space Types and Share of the Floor Spaces ... 56
Table 4-2 Database of 20 ATBs from CAP and Stantec Reports ... 57
Table 4-3 Simulation Configurations ... 58
Table 4-4 RC and Sig. (p-value) as Factors and Building Types ... 63
Table 4-5 EUIMea and EUIAdj of 20 ATBs in CAP and Stantec reports ... 69
Table 4-6 Building Types and Share of Floor Space ... 73
Table 4-7 RC and Sig. (p-value) as Factors and Building Types ... 77
Table 4-8 Simulation Configurations ... 78
Table 4-9 RC and Sig (p-value) as Factors and Building Types ... 80
Table 4-10 Geometry and Operational Characteristics of two TSCs in Seoul, South Korea ... 83
Table 4-11 EUIMea and EUIAdj of 2 TSCs in Seoul, Korea ... 85
Table 4-12 Energy Use of Subway and Bus System ... 88
Table 4-13 Space Types and Share of Floor Spaces ... 92
Table 4-14 EUI Comparison between Above and Underground ... 93
Table 4-15 Weighted Values from the Effect of Soil Temperature ... 94
Table 4-16 RC and Sig. (p-value) as Factors and Building Types ... 97
Table 4-17 Simulation Configurations ... 98
Table 4-19 RC and Sig. (p-value) of Factors... 100
Table 4-20 EUIMea and EUIAdj of the SMRT 4 Routes in Seoul, Korea ... 106
Table 4-21 10 ATBs’ Information from the ACRP document and the NASEM database ... 109
Table 4-22 EUIMea and EUIAdj of 10 ATBs in the ACRP document ... 110
Table 4-23 EUIAdj and MvRM EUIAdj of 20 ATBs in CAP and Stantec reports ... 114
Table 4-24 EUIAdj and MvRM EUIAdj of 2 TSCs in Seoul, Korea ... 115
Table 4-25 EUIAdj and MvRM EUIAdj of 4 routes of SMRT in Seoul, Korea ... 115
Table 4-26 EUIAdj and MvRM EUIAdj of 10 ATBs in the ACRP document ... 116
Table 4-27 EUIEst and MvRM EUIEst of 20 ATBs in CAP and Stantec reports ... 117
Table 4-28 EUIEst and MvRM EUIEst of 2 TSCs in Seoul, Korea ... 118
Table 4-29 EUIEst and MvRM EUIEst of 4 routes of SMRT in Seoul, Korea ... 118
Table 4-30 EUIEst and MvRM EUIEst of 10 ATBs in ACRP document ... 119
Table 4-31 Comparison of EUIAdj between Conv. Model and MvRM for 20 ATBs, 2 TSCs, and 4 routes of SMRT ... 120
Table 4-32 Comparison of EUIAdj between Conv. Model and MvRM for 10 ATBs ... 121
Table 4-33 Comparison of EUIEst between Conv. Model and MvRM for 20 ATBs, 2 TSCs, and 4 routes of SMRT ... 123
Table 4-34 Comparison of EUIEst between Conv. Model and MvRM for 10 ATBs ... 124
LIST OF FIGURES
Figure 2-1 Site and Source Energy ... 7
Figure 2-2 Building Sector in Energy Consumption ... 8
Figure 2-3 Primary Energy Consumption and Fuels used to Generate Electricity in the U.S. ... 9
Figure 2-4 Terminal Space Layout of JFK Int’l Airport Terminal Building ... 19
Figure 2-5 Comparison of Energy Consumption and Annual Electricity Cost ... 31
Figure 3-1 Conceptual Framework ... 42
Figure 3-2 Materialization of Framework ... 43
Figure 3-3 EUIMea vs. Building Age for 723 Office Buildings in the CBECS ... 47
Figure 3-4 EUIMea vs. CDD for 723 Office Buildings in the CBECS ... 47
Figure 3-5 Simulated EUI vs. HDD for 30 Simulated Retails ... 49
Figure 3-6 Simulated EUI vs. Area for 30 Simulated Office Buildings ... 50
Figure 4-1 Simulated EUI vs. Area for 30 Simulated Office Buildings ... 59
Figure 4-2 Simulated EUI vs. Age for 30 Simulated Retails ... 59
Figure 4-3 EUIMea vs. HDD for 355 Retails in the CBECS ... 60
Figure 4-4 EUIMea vs. Enplanement for 20 ATBs in the CAP and Stantec ... 61
Figure 4-5 Old and New Seoul Train Stations ... 72
Figure 4-6 EUIMea vs. Number of Floors for 182 Food Services in the CBECS ... 75
Figure 4-7 EUIMea vs. Operating Hours for 208 Public Assembly Buildings in the CBECS ... 75
Figure 4-8 Simulated EUI vs. Age for 30 Simulated Retails ... 78
Figure 4-9 Simulated EUI vs. Age for 30 Simulated Food Services ... 79
Figure 4-10 Comparison of Sum of All Impact Factors as Building Types in Cases 1 and 2 ... 86
Figure 4-11 EUIMea vs. Operating Hours for 355 Retails in the CBECS ... 95
Figure 4-12 EUIMea vs. Number of Floors for 182 Food Services in the CBECS ... 96
Figure 4-13 EUIMea vs. Passengers per Day for 4 routes of SMRT ... 100
Figure 4-14 Comparison of Sum of All Impacts as Building Types ... 107
Figure 4-15 Comparison of EUIMea, EUIAdj, and EUIEst from MvRM for 20 ATBs ... 125
Figure 4-16 Comparison of EUIMea, EUIAdj, and EUIEst from MvRM for 2 TSCs and 4 routes of SUBs ... 126
1.
INTRODUCTION
1.1 Energy
Since the beginning of the modern era, rapid industrial growth has required
considerable energy supply, which consequently caused the catastrophic oil crisis in the
1970’s. At that time, many developing countries faced substantial petroleum shortages
operating their industries. The situation accounted for the U.S. production peak in 1973 as
well as the political objectives of some Middle Eastern countries in late 1970’s (Hamilton,
2011).
By the end of 1960s, the crises were already implied by the fact that petroleum usage
peaked around the world (Hamilton, 2011). Western countries wanted more petroleum
supply at low price, but the oil-producing countries in the Middle East wanted to reduce the
production to increase the unit price. This dissonance slowed down the economic growth in
many countries as oil prices skyrocketed. Even though this situation was ignited in part due
to political and religious aspects, the stagflation as a result of combination of stagnancy and
inflation impoverished many countries and their citizens’ lives (Barsky & Kilian, 2000).
Since then, international energy policies, strategies, and technologies have been rapidly
refined to prevent such crises. By conducting advanced analytics, precise evaluation of
building energy performance helps to pinpoint existing problems and provides better
1.2 Airport Terminal Buildings
Since the establishment of the College Park Airport in Maryland in 1909 (the oldest
airport in the world), airports have consistently been developed to catch up with rapid
worldwide economic growth (The Maryland National Capital Park and Planning Commision,
2015). About 44,000 airports were constructed worldwide by 2009 (15,095 in the U.S.),
which reflects the fact that the airport business has fulfilled huge demands of several
industries (CIA, 2010).
During the 100 years of commercial flight, many changes in architecture, technology,
and aviation have modified the design and planning factors related to functionality and user
convenience of Airport Terminal Buildings (ATBs) (TRB, 2010). With the increase in
physical size and business model, recent ATBs have been designed and transformed into
complex buildings that can meet more intense needs and demands. The systematic and
programmatic complexity in design and planning prevents the quantification of the energy
performance with respect to ATBs unlike office buildings, malls, hospitals, and other major
building types. This is directly related to the difficulty in evaluating ATB energy
performance. For the reason, many researchers and designers cannot refer to the energy
optimal design of ATBs.
1.3 Energy Performance Benchmark
According to the U.S. Department of Energy (USDOE), buildings in the U.S.
accounted for about 41% of energy consumption and about 71% of electricity used (USDOE,
(ASHRAE, 2008). The importance of precise data measurement has been recognized as key
in energy consumption patterns and defining energy policies. Energy consumption measures
have been collected by the USDOE’s Commercial Building Energy Consumption Survey
(CBECS) and the Residential Energy Consumption Survey (RECS). Also, benchmark
methods comparing theoretical models and real world measures have been developed and
tested. Despite these efforts, there remains uncertainty in energy consumption measures
caused by the weakness of measured data.
As computing technologies have developed, researchers have recognized the
advantage of using simulation techniques. The gaps between theories and practices can be
mitigated, and theoretical assumptions that have never been tried before due to technical
limitations can be verified. Accumulated energy consumption surveys and advanced
simulation applications have made the energy performance benchmark more attractive to
recent energy analysts.
1.4 Research Question
The intersection of energy efficiency, airport terminal buildings, and energy
performance benchmarks can provide several opportunities for researchers. Recent energy
saving technologies may have potentials to change design paradigms of conventional ATBs.
An examination of ATBs can be a starting point for integration of building types, which also
contribute to improve metrics for benchmarking mixed-use buildings, building clusters, and
actual measured data and simulated results, in any phases, the tools can assist them to design
energy optimal ATBs.
Consequently, the following research question is proposed: “Are there any effective
benchmarking tools that can help either determine or compare the energy performance of
ATBs?”
1.5 Research Goal and Objectives
The research goal herein is to evaluate and estimate the energy performance of ATBs
in the U.S. with the help of energy use benchmark metrics applicable to ATBs. Specifically,
the research objectives and tasks are to:
Identify specific characteristics and areas of ATBs that result in energy consumption.
Find and test existing statistical metrics to develop energy use benchmark models for ATBs.
Develop a Multivariate Regression Model (MvRM) for ATBs that can provide energy performance level information.
Test and verify the effectiveness of MvRM by case studies including other mass transportation buildings.
1.6 Overview of Chapters
Chapter 2 provides a literature review on energy, ATBs, and energy performance
benchmarks. This chapter describes an overview on the previous studies conducted on energy
statistical methods, and characteristics of ATBs. Chapter 3 is dedicated to the discussions on
research methodology including a description of the conceptual approach. This chapter
includes detailed explanations for 4 different measures to evaluate or estimate the energy
performance of ATBs. Chapter 4 provides research results and findings to discuss the
methodology’s effectiveness through statistical data analyses and comparisons between the
measures. Chapter 5 concludes the discussion on the effectiveness of the methodology used
in this research. This chapter also provides recommendations for future studies that may
define the intersection of energy issues, ATBs, energy performance benchmarks, and energy
2.
LITERATURE REVIEW
2.1 Energy
2.1.1 Energy Use Intensity (EUI)
A building’s energy consumption level is indicated by its Energy Use Intensity or
Index (EUI). The EUI is most often used as an expression of building energy consumption
and effectively reflects the building’s annual energy consumption (measured in kBtu or GJ)
related to the gross floor area (measured in square feet or m2) of the building (AIA, 2012).
For instance, if Building A is 10,000 sf. (929 m2) consumes 900,000 kBtu (263,763 kWh) a
year, its EUI would be 90 kBtu/sf-yr. (283.92 kWh/m2-yr.). If Building B is 100,000 sf.
(9,290 m2) consumes 8,000,000 kBtu (2,344,560 kWh) a year, it would consume 80
kBtu/sf-yr. (252.37 kWh/m2-yr.) as its EUI. Thus, Building B is more than 10% more energy efficient
than Building A. Due to its simplicity and intuitiveness, the EUI indicator has been
commonly used in energy studies.
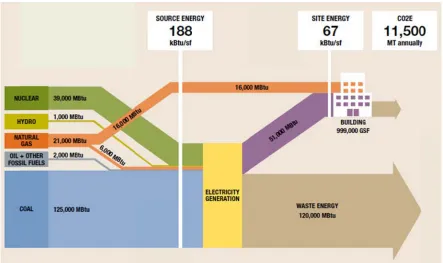
The EUI indicator is related to either site or source energy. Per the USDOE and the
AIA, the site energy is regarded as a general term of a building’s energy consumption and is
described as a utility bill (AIA, 2012). The source energy describes the detailed measure of a
building’s energy footprint including the energy loss during production, transmission, and
delivery. Figure 2-1 shows diagrammatic description of difference between site and source
2.1.2
build
consu
consu
consu
the i
accou
(USD
Building Se The Build
ding sector. I
umption, wi
umption (US
umption in 2
industrial se
unted for 54
DOE, 2015). ector ding Databo
In 2010, ene
ith the build
SDOE, 2015
2010, which
ector (USDO
4% of energ
Additionall
Figure 2-1 S
ook Chapter
ergy consum
ding sector
5). The U.S.
is 44% mor
OE, 2015).
gy consump
y, 75% of en
Site and Sou
1 provides
mption in the
alone acco
building sec
re than the t
Within the
ption and co
nergy source
urce Energy
an overview
U.S. accoun
ounting for
ctor shared a
transportatio
e building
ommercial b
es used came
w of energy
nted for abo
about 7% o
about 41% o
on sector and
sector, resid
buildings acc
e from fossil
y use in the
out 19% of g
of global en
of primary en
d 36% more
dential buil
counted for
nucle consu 2.1.3 indic the to facili build const carbo influe consu ear generatio
umption by s
Commercia The Build
ated in Figu
otal U.S. con
ities represen
ding sector
truction also
on dioxide e
ential factors
umption (US
on, and 9%
share as coun
Figure 2
al Sector ding Databoo
ure 2-2, the e
nsumption,
nted about h
showed a
o showed a
emissions (U
s in the com
SDOE, 2015
from renew
ntry, industr
2-2 Building
ok Chapter 3
energy consu
while the en
half of the c
10% drop
22% drop, w
USDOE, 20
mmercial sect
).
wables. Figu
ry, and fuel t
g Sector in E
3 focuses on
umption of c
nergy consu
ommercial s
p in energy
which cause
015). Heatin
tor, accounti
ure 2-2 show
types used (U
Energy Consu
n energy use
commercial
umption of o
sector (USD
y expenditu
ed a positive
ng, cooling,
ing for abou
ws the pie
USDOE, 20
umption
in the comm
buildings w
office, retail,
DOE, 2015).
ures, and n
e result of a
and lighting
ut 50% of th
charts of en
15).
mercial secto
was about 19
, and educat
The comme
new comme
a 6% decrea
g were the
2.1.4 build deliv accou usage 2015 petro future indic Acco electr Figu Energy Sup The Buil ding sector, ered energy
unted for ab
e. This amou
). To gener
leum, solar,
e of fuel us
ates that it c
ording to the
ricity genera
ure 2-3 Prim pply
ding Databo
electricity
in 1980 to
bout 41% of
unt of electr
rate electric
, wind, geot
sed to gener
comprise onl
USEIA, ren
ation from 10
mary Energy
ook Chapter
demand inc
9.5 quads in
f total primar
ricity in the
city, several
thermal, hyd
rate electric
ly 34% of en
newable sour
0% in 2008 t
Consumptio
r 6 examine
creased from
n 2010 (USD
ry energy, b
buildings s
l fuel types
dro, and biom
city. The co
nergy consum
rces (mostly
to 14% in 20
on and Fuels
es the U.S.
m 4.4 quads
DOE, 2015).
but it took a
sector has do
s are used:
mass. Figur
nsumption o
mption in ge
y, wind) coul
035 (USDOE
used to Gen
energy sup
s (1 quad =
. In 2010, th
about 74% o
oubled since
coal, nucle
re 2-3 descri
of coal has
enerating ele
ld increase th
E, 2015).
nerate Electr
pply. Within
= 1,015 Btu
he building s
of total elect
e 1980 (USD
ear, natural
ibes the pas
declined, w
ectricity by 2
heir share in
2.1.5 Recent Movement
2.1.5.1 Architecture 2030 Challenge
Architecture 2030 is an independent, non-profit, non-partisan research organization. It
was established in 2002 in response to the energy and global warming crisis (Architecture
2030, 2011). In 2006, Architecture 2030 issued the original 2030 Challenge for buildings.
Global architectural communities have sought to eliminate fossil fuel use for new buildings
and major renovations by 2030 (Architecture 2030, 2011). To achieve the Architecture 2030
plan, all firms, organizations, and individuals need to adopt the 2030 Challenge to meet the
target outlined by the initiative (Architecture 2030, 2011). This initially required each new
building project or major renovation to be designed to achieve an energy consumption
performance standard of 50% of the regional average. This standard increased to 60% of the
regional average by 2010 (Architecture 2030, 2011). Every five years, the standard increased
and will continue to increase by an additional 10%, thus achieving carbon neutral buildings
by 2030 (Architecture 2030, 2011). Major renovations are also required to meet the 50%
target throughout this timeline, but they are encouraged to achieve additional reductions
(Architecture 2030, 2011; Architecture 2030, 2012).
2.1.5.2 U.S. Department of Energy 2025 Initiative
The Net-Zero Energy Commercial Building Initiative aims to achieve marketable
net-zero energy buildings. Such buildings can be grid integrated and capable of generating as
and geothermal plants by 2025. They are executed by an array of public and private
partnerships for high performance buildings (USDOE, 2012).
2.1.5.3 Living Building Challenge
The Living Building Challenge (LBC) utilizes a benchmark given by the best
knowledge available today (CRGBC, 2008). Projects achieving sustainability performance
serve as role models to others that follow and are applied to development at all scales, from
buildings to infrastructure, landscapes, and neighborhoods. The LBC consists of seven
performance areas: site, water, energy, health, materials, equity, and beauty (CRGBC, 2008).
2.1.5.4 Obama Administration’s Executive Order 13514
The Executive Order 13514 of 2009 includes strengthened federal policies and
activities and supports energy issues for implementing green roofs, archiving Net-Zero
energy buildings, and retrofitting agency buildings or leased buildings. Specifically, the
heads of federal agencies were tasked with improving their agency’s energy efficiency and
lessening greenhouse gas emissions by reducing energy intensity 3% annually until 2015
(FedCenter, 2015; Office of the Press Secretary, 2009). They ensure that at least half of the
required renewable energy should come from new renewable sources by implementing
renewable energy generation projects on agencies’ properties and agency acquisitions of
goods and services including bio-based, environmentally preferable, energy-efficient,
water-efficient, recycled-content products, and paper consisting of at least 30% post-consumer fiber
performance and sustainable buildings, and at least 95% of office must be certified by an
environmental assessment tool such as Energy Star (FedCenter, 2015; Office of the Press
Secretary, 2009).
2.1.6 Databases and Tools
2.1.6.1 Commercial Building Energy Consumption Survey (CBECS) Report
Since 1979, the USDOE has performed the large-scaled surveys of more than 5,000
commercial buildings and has opened the CBECS report to public via the U.S. Energy
Information Administration (USEIA) website (USEIA, 2008). The CBECS report categorizes
by construction and operation factors such as building types, area, year built, energy
consumption of heating and cooling, ventilation, equipment, and operating hours. It also
includes subdivided items such as number of elevators, computer area percentage, natural gas
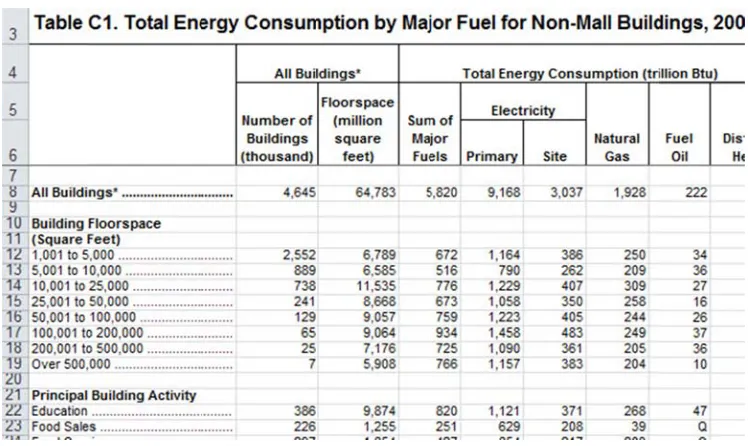
used for cooking, window glass type, and more. Tables 2-1 and 2-2 show the CBECS report
format and parts of its subdivisions, as well as EUI samplings for major building types to
understand a certain building’s place on the energy use continuum based on the 2003 CBECS
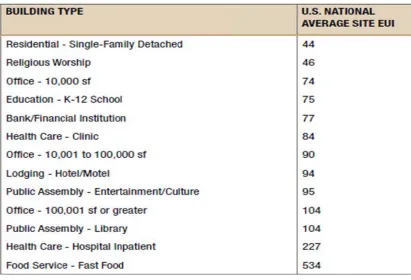
data m in Ta build 44 to Table 2-2 mining and
able 2-2, foo
dings had onl
534 across b
Table 2-1
2 summarize
trimming, th
od service as
ly 44 kBtu/s
building typ
1 Example o
s the U.S. n
here is a littl
s fast food b
f./yr., which
pes (USEIA,
of the 2003 C
ational avera
le bit of diff
buildings con
h reflects tha
2008; AIA,
CBECS repo
age of site E
ference in sta
nsumed 534
at EUI levels
2012; USEI
orts (Part)
EUI. Due to
atistics for E
4 kBtu/sf./yr
s locate on a
IA, 2008; US
methodolog
EUI. As indi
.), but reside
a wide range
expla overa skysc becau comm comm build Energ Some stud
ains that a s
all than a sk
craper with
use the squa
mercial build
mercial build
ding’s 69.4 k
gy Protectio
Table 2-2 E
dies provide
small office
kyscraper w
high-perform
are footage
ding in New
ding on the P
kBtu/sf./yr.)
on Agency (
Example of t
e further ana
building w
with thousan
mance syste
of building
w England
Pacific Coas
due to diffe
(USEPA) in
the U.S. Nati
alysis based
with 80 work
ds of peopl
ems may ha
matters (AI
that is abou
t consumes
erences in h
ndicates that
ional Averag
on the data.
kers consum
le. If the lo
ave a lower
IA, 2012). T
ut 40% larg
99.0 kBtu/sf
heating energ
t about 30%
ge Site EUI
For instanc
mes consider
ad densities
r EUI than
The USEIA
ger than a s
f./yr. compa
gy (USEIA,
% of energy
ce, the AIA g
rably less en
s are similar
the small o
A describes t
same conditi
ared to the Pa
office buildings is wasted even though when the building is regarded as an energy efficient
building type (USEPA, 2007).
2.1.6.2 Energy Star Portfolio Manager
The USEPA provides the Energy Star Portfolio Manager online tool of to measure
and track energy and water consumption. Its report indicates that there are 6,000 Energy Star
partners, over 70,000 active project managers, and 350,000 buildings participating in the
program (Cook, Overview of the Energy Star Program and the Portfolio Manager Tool,
2014). By entering property information data (e.g. building type, name, address), property
type data (e.g. gross floor area, operating hours, number of workers), and energy
consumption data, a Portfolio Manager benchmarks the Energy Star score of all buildings
(Cook, Benchmarking with EPA's Energy Star Portfolio Manager, 2014). Buildings that
receive scores of 1-50 (50 is national average) out of 100 need to invest in new equipment
and enhance operational practices. For buildings with scores of 51-74, operations and
maintenance practices can be improved or equipment can be upgraded. Buildings that score
75 or over are named top performing facilities, reflecting superior energy management
(Cook, Benchmarking with EPA's Energy Star Portfolio Manager, 2014). The USEPA
currently uses the 2003 CBECS data to create most of the Energy Star scores in the Portfolio
Manager (Energy Star, 2015).
2.1.6.3 Building Energy Asset Score
of commercial and multifamily residential buildings. Users gather information about
building’s physical characteristics (e.g. building geometry, window, HVAC system, lighting
system), but it does not require users to gather energy consumption data (Wang, Goel, &
Marhmalbaf, 2013). The score system consists of a 10-point scale, and over 8.5 points
accounts for high efficiency. Unlike the CBECS and Portfolio Manager, the Building Energy
Asset Score is based on the modeled EUI estimate by each tool, and it runs an energy
simulation using user-submitted building data submitted (USDOE, 2015). Therefore, it
reflects the energy efficiency of a building based on design, construction, and energy system,
so it can be used to complement the results of the Portfolio Manager, which reflects operation
and maintenance as well as physical aspects (USDOE, 2015).
2.1.6.4 Simulation A. COMcheck/REScheck
For designers, architects, builders, contractors, inspectors, and building officials, the
product group COMcheck/REScheck by Energy Efficiency & Renewable Energy (EERE)
determines whether commercial/residential projects meet the requirements of the building
International Energy Conservation Code (IECC) and American Society of Heating,
Refrigerating and Air-Conditioning Engineers (ASHRAE) Standard 90.1.
B. EnergyPlus
EnergyPlus is an energy analysis and thermal load simulation program based on a
user’s description of a building’s physical make-up and associated mechanical systems.
set-points, the conditions throughout HVAC system, and the energy consumption of primary
plant equipment, as well as many other simulation details.
C. OpenStudio
OpenStudio is one of the most frequently used simulation plug-ins for EnergyPlus in
the SketchUp program. This helps users to use EnergyPlus and SketchUp intuitively with a
graphical interface facilitating the selection of construction types, building materials, HVAC
systems, and schedules. Users can easily change the values of each item as demands and
modify them with accuracy in accordance with specific criteria.
2.1.7 Summary
A. Definition of EUI and site energy
B. Energy consumption of building and commercial sector in the U.S.
C. Recent movements for energy savings: Architecture 2030, USDOE 2025
Initiative, Living Building Challenge, Executive Order
D. Tools for evaluating energy efficiency
a. Measurement based: CBECS report, Portfolio Manager
b. Simulation based online tools: Building Energy Asset Score, COMcheck,
REScheck
c. Simulation software: EnergyPlus, OpenStudio
2.2 Airport Terminal Building (ATB)
transit (TRB, 2010). It directly reflects the morphological and operational concept of the
airport system. Consequently, an ATB has a great impact on planning, construction,
operation, and maintenance strategies of the airport system.
2.2.1 Various Space Types in ATB
The ATB consists of multiple building (space) types in one structure:
ticketing/check-in; passenger screening; hold rooms/waiting lounge; concession; baggage
claim/handling/screening; circulation; office/operation areas; support areas; and additional
areas for special requirements (TRB, 2010). All building types should be systematically
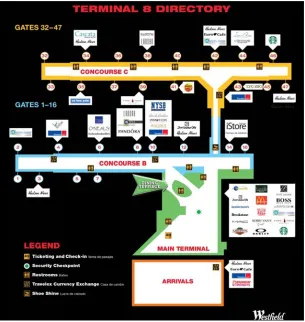
connected each other to link circulation and service areas. Figure 2-4 shows a terminal map
example for John F. Kennedy Int’l Airport.
For passenger flow efficiency in ATBs, IATA offers the following main points:
formulating circulation to optimize passengers’ moving distance, including motorized
sidewalk systems; minimizing distance and handling time of baggage; and applying modular
technology corresponding to future changes. These ATB characteristics can be related when
Fi 2.2.2 Manu Each secur the e
igure 2-4 Te
Design Ma Significan ual, FAA’s commonly rity requirem nvironmenta erminal Spac anuals nt reference
Advisory C
y mentioned
ments, and c
al impacts o
ce Layout of
es have been
Circular, and
d passenger
compatibility
of an airport
f John F. Ken
n used in A
d IATA’s A
and baggag
y and expan
as an impo
nnedy Int’l A
ATB design
Airport Deve
ge circulatio
ndability. FA
ortant issue o
Airport Term
n: ICAO’s A
elopment Re
on optimiza
AA’s recent
on airport d
ATB and several implementations for energy issues related to them (FAA, 1988; FAA, 2012;
IATA, 2004).
Table 2-3 Design Manuals for ATB and Related Facilities
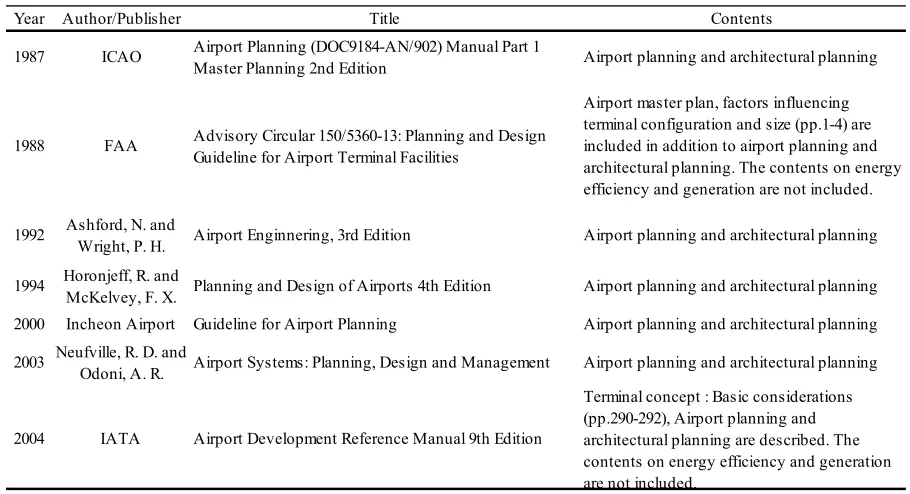
As indicated, most manuals do not include information of energy conservation and
generation as one of the major concepts for airport planning.
2.2.3 Recent Movement
The FAA announced its long-term plan to reduce environmental effects in its
Destination 2025 (FAA, 2011). By using advanced technology, operational improvements
are being performed to reduce noise, fuel burn, and emissions while continuing growth in
system activity, including appropriate policy approaches to achieve environmental
cost-Year Author/Publisher Title Contents
1987 ICAO Airport Planning (DOC9184-AN/902) Manual Part 1
Master Planning 2nd Edition Airport planning and architectural planning
1988 FAA Advisory Circular 150/5360-13: Planning and Design Guideline for Airport Terminal Facilities
Airport master plan, factors influencing terminal configuration and size (pp.1-4) are included in addition to airport planning and architectural planning. The contents on energy efficiency and generation are not included.
1992 Ashford, N. and
Wright, P. H. Airport Enginnering, 3rd Edition Airport planning and architectural planning
1994 Horonjeff, R. and
McKelvey, F. X. Planning and Design of Airports 4th Edition Airport planning and architectural planning 2000 Incheon Airport Guideline for Airport Planning Airport planning and architectural planning
2003 Neufville, R. D. and
Odoni, A. R. Airport Systems: Planning, Design and Management Airport planning and architectural planning
2004 IATA Airport Development Reference Manual 9th Edition
benefits for operating with such an advanced system (FAA, 2011; FAA, 2012). Sustainable
airport facilities, ground vehicles, and operational practices have already reduced emissions
and energy consumption and achieved at least a 50% reduction in un-recycled waste. The
FAA’s policy for aviation environmental and energy goals contains five pillars: noise, air
quality, climate, energy, and water quality. Additionally, the FAA’s Voluntary Airport Low
Emission Program, which it has operated since 2004, further reduces environmental harm
(FAA, 2012).
Through seminars, webinars, conferences, and publications, the IATA has presented
its position on environmental issues. In December 2005, the IATA Board of Governors
endorsed an industry-wide strategy for addressing climate change and emissions trading. This
strategy was developed through consultation with IATA member airlines and supported by
extensive analysis including four elements: technology; infrastructure and operations;
investment in newer and cleaner equipment; and emissions trading (IATA, 2006). In 2009,
the IATA announced a strategy through the Energy and Resource Institute, which includes
technology investments, effective operations, efficient infrastructure, and positive economic
measures. IATA reports state that nearly 70 million tons of CO2 was successfully reduced at
156 airports around the world (IATA, 2009; IATA, 2009).
Through several volumes of its journal, the ICAO addressed its interests in
environmental issues, revealing a global harmonized agreement for reducing emissions by
2050 (ICAO, 2011). By 2009, the conference had already adopted a global framework for the
sustainable development, which represents ICAO’s strong intention to make an important
turning point for future (ICAO, 2011; ICAO, 2012).
The Leadership in Energy and Environmental Design (LEED) is a rating system
developed by the U.S. Green Building Council (USGBC) in 1998. LEED’s main purpose is
to provide building users a design methodology for high performance green building with
respect to schematic design, construction, operation, and maintenance. The LEED point
system consists of five major categories: Sustainable Sites, Water Efficiency, Energy and
Atmosphere, Materials and Resources, and Indoor Environmental Quality (USGBC, 2009).
The system provides additional points for innovation design and regional priority. The
system assigns points to a building for certification within four levels: Platinum; Gold;
Silver; and Certified. The Platinum level is the highest position of the rating system, which
requires 80 points and above. Table 2-4 shows ATBs in the U.S. that had earned a LEED
certification by 2012 (Blackburn Architects, 2013; BuildingGreen, 2006; City of San Jose,
2013; Earth Techling, 2011; Earth Techling, 2011; GSP International Airport, 2013; Green
Airport, 2014; Green Building News, 2013; Huffingtonpost, 2011; Indianapolis Airport
Authority, 2013; Massport, 2015; PGAL, 2013; Port of Oakland, 2010; SFO, 2011; SFO,
2011; Sacramento International Airport, 2012; San Jose International Airport, 2013; The
Maryland National Capital Park and Planning Commision, 2015; Wilson Air Center, 2012;
World Construction Network, 2010). As indicated, the number of ATBs and their facilities
Table 2-4 LEED certificated ATBs in the U.S. as of 2012
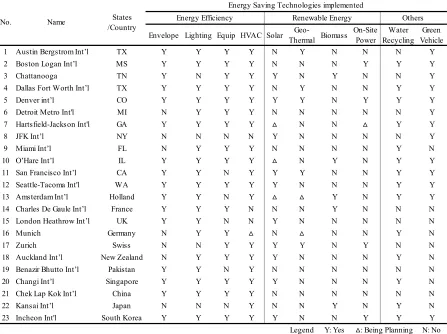
2.2.4 Implementation of Energy Savings Technology
Table 2-5 shows the energy saving technologies implemented among 23 airports in
the U.S., Asia, Europe, and Oceania (CAP, 2003; Armbrester, et al., 2011; DFW, 2012;
Alliance To Save Energy, 2012; DiA, 2010; DiA, 2011; DiA, 2012; CPG Airport, 2012;
Changi Airport Group, 2012; Changi Airport Group, 2010; Heathrow Airport, 2013;
Heathrow Airport, 2013; Incheon Airport, 2012; KIX, 2012; Massport, 2015; Munich
Airport, 2011; SFO, 2011; SFO, 2011; Schiphol Amsterdam Airport, 2011; Schiphol Group,
2010; Unique, 2005; Aeroports De Paris, 2010; Airport Industry Review, 2012; EarthCheck,
2010; DFW, 2013; The Port Authority of NY & NJ, 2012; CDA, 2011; Hanlon, 2011).
No. Name Certified Facility Award Year
1 Atlanta Int'l New International Terminal Silver 2012 2 Chattanooga Metro Center Terminal Platinum 2012 3 Indianapolis Int'l Entire Terminal Campus Silver 2012
4 Sacramento Int'l Terminal B Silver 2012
5 SF Int'l Terminal 2 (Renovation) Gold 2011
6 GSP Int'l General Aviation Terminal Gold 2010
7 Oakland Int'l Terminal 2 Gold 2010
8 San Jose Int'l Terminal B Silver 2010
Table 2-5 Energy Saving Technologies implemented in 23 Airports
As indicated, implementations account for increasing energy efficiency, decreasing
harmful gas emission, and promoting renewable energy. However, compared to other
building types, the ATB is one of the most challenging building types for energy savings in
terms of physical and operational size; great numbers of workers, visitors, flights, and
machines continuously arrive, depart, and operate 24 hours a day. Consequently,
implementing even small, simple technologies for people, buildings, and operations could
result in a huge impact on total energy consumption by ATBs.
Envelope Lighting Equip HVAC Solar ThermalGeo- Biomass On-Site Power RecyclingWater VehicleGreen
1 Austin Bergstrom Int’l TX Y Y Y Y N Y N N N Y
2 Boston Logan Int’l MS Y Y Y Y N N N Y Y Y
3 Chattanooga TN Y N Y Y Y N Y N N Y
4 Dallas Fort Worth Int’l TX Y Y Y Y N Y N N Y Y
5 Denver int’l CO Y Y Y Y Y Y N Y Y Y
6 Detroit Metro Int'l MI N Y Y Y N N N N N Y
7 Hartsfield-Jackson Int'l GA Y Y Y Y N N Y Y
8 JFK Int’l NY N N N N Y N N N N Y
9 Miami Int’l FL N Y Y Y N N N N Y N
10 O’Hare Int’l IL Y Y Y Y N Y N Y Y
11 San Francisco Int’l CA Y Y N Y Y Y N N Y Y
12 Seattle-Tacoma Int'l WA Y Y Y Y Y N N N Y Y
13 Amsterdam Int’l Holland Y Y N Y Y N Y Y
14 Charles De Gaule Int’l France Y Y Y N N N Y N N N
15 London Heathrow Int’l UK Y Y N N Y N N N N N
16 Munich Germany N Y Y N N N Y N
17 Zurich Swiss N N Y Y Y Y N Y N N
18 Auckland Int’l New Zealand N Y Y Y Y N N N Y N
19 Benazir Bhutto Int’l Pakistan Y Y N Y N N N N N N
20 Changi Int’l Singapore Y Y Y Y Y N N N Y N
21 Chek Lap Kok Int’l China Y Y Y Y N N N N N N
22 Kansai Int’l Japan N N N Y N N Y N Y N
23 Incheon Int'l South Korea Y Y Y Y Y N N Y Y Y
Legend Y: Yes N: No
No. Name States
/Country
: Being Planning Others Energy Saving Technologies implemented
Lighting is one of the most critical ways to save energy in most commercial building
types in terms of installation efficiency, system replacement, and payback period. The
Energy Program of Washington State University (2003) says that lighting is one of the major
Energy Efficiency Measures (EEMs) and is implemented within the categories below:
A. Reduce Lighting Requirement
a. Utilize Task Lighting
b. Lighting Control
c. Use Light-Colored Interior Wall Finishes
B. Install More Energy Efficient Lighting System
a. Use High-Efficiency Fixtures
b. Use Efficient Exterior Fixtures
c. Use High-Efficiency Ballast
C. Use Daylighting
a. Install Dimming Controls
b. Architectural Modifications (Washington State University, 2003)
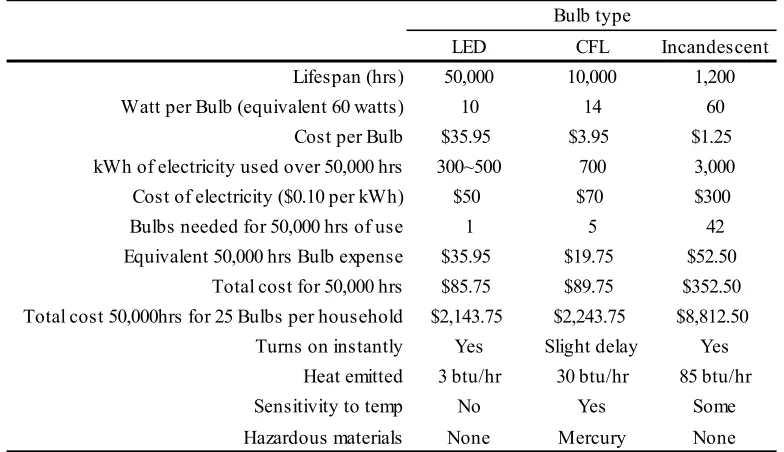
Among these, installing high efficient lighting or replacing old bulbs with high
efficiency bulbs are preferred in terms of time and cost effectiveness. Because replacing
bulbs does not require envelope replacements, structural modifications, and power capacity
upgrade, it is encouraged by institution and government policy. A comparison between three
different bulb types defines the economics of a high efficient bulb. Table 2-6 shows the
Table 2-6 Comparison between LED, CFL, and Incandescent Bulb
As indicated in Table 2-6, cost savings can vary by term and household size. The
comparison of LED and other bulbs needs to be refined because the cost of LED can rapidly
decrease as technology and product efficiency improves. In general, replacing incandescent
bulbs with CFL can save energy by 75%, and replacing incandescent with LED can save
energy by 75% to 80% (USDOE, 2015).
The 32-watt T8 lamp was introduced in the U.S. in 1981 (Lighting Research Center,
1993). The 4-foot fluorescent lamps became the standard for new construction and
conventional 40-watt T12 lamps were retrofitted. Replacing T12 lamps with magnetic
ballasts into T8 lamps with electronic ballasts can reduce energy consumption by 35% (E
Source Companies LLC., 2010). Table 2-7 shows the detailed comparison between the
LED CFL Incandescent
Lifespan (hrs) 50,000 10,000 1,200 Watt per Bulb (equivalent 60 watts) 10 14 60
Cost per Bulb $35.95 $3.95 $1.25 kWh of electricity used over 50,000 hrs 300~500 700 3,000 Cost of electricity ($0.10 per kWh) $50 $70 $300 Bulbs needed for 50,000 hrs of use 1 5 42 Equivalent 50,000 hrs Bulb expense $35.95 $19.75 $52.50
Total cost for 50,000 hrs $85.75 $89.75 $352.50 Total cost 50,000hrs for 25 Bulbs per household $2,143.75 $2,243.75 $8,812.50
Turns on instantly Yes Slight delay Yes Heat emitted 3 btu/hr 30 btu/hr 85 btu/hr Sensitivity to temp No Yes Some Hazardous materials None Mercury None
typical four-lamp T-8 and T-12 (Lighting Research Center, 1993; Lighting Research Center,
2015).
Table 2-7 Specification and Performance Comparison between T12 and T8
Energy efficient lighting systems have been developed and used to improve building
performance. The State Energy Conservation Office (SECO) in Texas provides an estimated
cost range and payback period of retrofitting lighting technologies. Table 2-8 shows the
results (SECO, 2009). Lamp diameter
Number and type of ballasts
Two standard magnetic
Two energy efficient magnetic
Two electronic
Two energy efficient magnetic
Two electronic
Two energy efficinet
T8 magnitic
One T8 electronic
Input power (watt) 179 160 133 137 116 129 111
Relative light output 100 100 94 80 79 95 89
Annual energy cost (3,000 operating
hrs per year and $0.10 per kWh) $53.70 $48.00 $39.90 $41.10 $34.80 $38.70 $33.30 Lamp types
40W T12 34W T12 32W T8
Table 2-8 Estimated Cost, Payback, and Savings for Lighting Technologies
Annual reports and media references indicate that some ATBs have achieved large
scale replacement of conventional bulbs into energy efficient LEDs. Their energy savings
information is included in Table 2-9 below (SFO, 2011; Huffingtonpost, 2011; CDA, 2011;
SANSI Technology Inc., 2015; DFW, 2012; DFW, 2013; DiA, 2010; DiA, 2011; DiA, 2012;
Hardesty, Denver airport switches 5400 lights to LED, 2014; Gallagher, 2014; Hardesty,
Detroit airport saves $1.2M per year with LEDs, 2014; The Port Authority of NY & NJ,
2012; Bright Light Systems, 2014; Dialight, 2013; Vancouver International Airport, 2015;
Bradley, 2014; PGAL, 2013; BuildingGreen, 2006; CREE, 2013; Aeroporti di Roma, 2010;
Massport, 2015).
Estimated cost ($) Estimated payback (years)
Potential annual savings (%) Ballast/Fixture replacement 300-100,000 10-12.5 8-10
Bulb replacement 100-5,000 1.3-6 16-79
Daylighting control 6,000-15,000 8.3-14.3 7-12
Street light bulb replacement 400-1,200 2-4 40
Motion/Occupancy sensors 350-2,000 3.1-6.6 15-32
Traffic signal bulb/fixture
Table 2-9 Energy Efficient Lighting and Energy Saving Technologies implemented
Lighting accounts for large amounts of electricity consumption in airport buildings.
Variations in savings percentages can be related to airport size, type of fuel used, or the
number of replacements or retrofittings. For instance, Leonardo da Vinci-Fiumicino Int’l
Airport (FCO) shows a very small percentage of electricity savings despite the large number
of conventional bulbs that were replaced with LEDs and CFLs. However, Orlando Int’l
Airport (MCO) shows a huge electricity savings despite just replacing 1,200 runway bulbs
with LEDs. Except for FCO, energy savings of most airports range from 20% to over 60%,
which can validate the result previously mentioned of TRB research (i.e. lighting accounts
for 40% of electricity used in airports.).
No. Name Code Energy efficient lighting
implemented Savings
1 SF Int'l SFO LEDs/Energy Efficient FLs 20% of LPD (10,000watts)
2 Chicago O'Hare Int'l ORD
1,100 LEDs of taxiway and runway, 2,400 LEDs/CFLs of interior lighting
632,000kWh/yr 3 Dallas-Fort Worth Int'l DFW T8 with electronic ballasts $12,608/yr
4 Denver Int'l DEN 51 watts LEDs 45% of elec. used ($327,000/yr)
5 Detroit Metropolitan DTW 6,050 LEDs in parking garage 66% of elec. used (7,345,000kWh/yr) 6 Albany Int'l ALB 1,969 LEDs in baggage claim 24% of elec. used ($66,000)
7 Marin Int'l, San Juan, Puerto
Rico SJU 160watts LEPs 73,954kWh/yr
8 General Mitchell Int'l MKE 80watts LEDs 50%of elec. used
9 Vancouver In'l, Canada YVR LEDs 1.3GWh of elec. used
10 Orlando Int'l MCO 1,200 LEDs on runway 61% of elec. used
11 Boston Logan Int'l BOS 2,000 LEDs 50% of elec. used
(2,261,218kWh/yr=$263,000) 12 Leonardo da Vinci-Fiumicino,
Italy FCO 1,000 LEDs/15,000 CFLs
2.2.5 Energy Performance Surveys
2.2.5.1 CAP Report
In 2003, USDOE released its 10 Airport Survey: Energy Use, Policies, and Programs
for Terminal Buildings by efforts of Clean Airport Partnership (CAP). The purpose of the
report was to identify opportunities to develop airports’ sustainability, to share information
on policies to maximize airport energy efficiency, and to aid government strategy to improve
building energy efficiency. The report included terminal description and energy use,
non-terminal buildings exceeding 90,000 sf., current energy policies and programs, future
investments, contact information, schematic diagrams, and summarized diagrams (CAP,
2003). Table 2-10 shows the reorganized information of 10 ATBs (CAP, 2003).
Table 2-10 Information of 10 U.S. ATBs
Natural Gas MBtu/sf
Monthly Yearly 6-Month Ave.
1 Pittsburgh Int'l 4.92 59.04 14.36 1,825,169
2 Salt Lake City Int'l 2.63 31.56 5.93 1,149,546
3 Cincinnati-Northern Kentucky Int'l 4.25 51.00 9.59 1,919,000
4 Cleveland Hopkins Int'l 3.94 47.28 8.88 916,774
5 Seattle-Tacoma Int'l 4.17 50.04 9.27 2,500,000
6 Portland Int'l 2.52 30.24 8.87 1,533,698
7 Ronald Reagan Washington National 7.03 84.36 4.63 537,585
8 Hartsfield-Jackson Int'l 3.20 38.40 2.07 3,055,696
9 Dallas-Fort Worth Int'l 3.34 40.08 5.23 2,876,000
10 Fort Lauderdale-Hollywood Int'l 3.84 46.08 3.47 900,913
Average 3.98 47.81 7.23 1,721,438
No. Airport Name
Energy Consumption
Terminal Area (sf) Electricity
the 1
(CAP
Figure
2-0 ATBs refl
P, 2003).
Figure 2
5 summariz
flecting annu
-5 Comparis
zes the infor
ual average e
son of Energ
rmation prov
electricity co
gy Consumpt
vided as bar
ost per squa
tion and Ann
r chart comp
are foot from
nual Electric
parisons bet
m the CAP r
city Cost
tween
As indicated in Figure 2-5, Pittsburgh Int’l (PIT) consumed large amount of natural
gas for heating in winter season. This tendency can be roughly confirmed by the cases of
Cincinnati-Northern Kentucky Int’l (CVG), Cleveland Hopkins Int’l (CLE), and
Seattle-Tacoma Int’l (SEA). However, obvious pattern of electrical consumption and annual
electricity cost cannot be found.
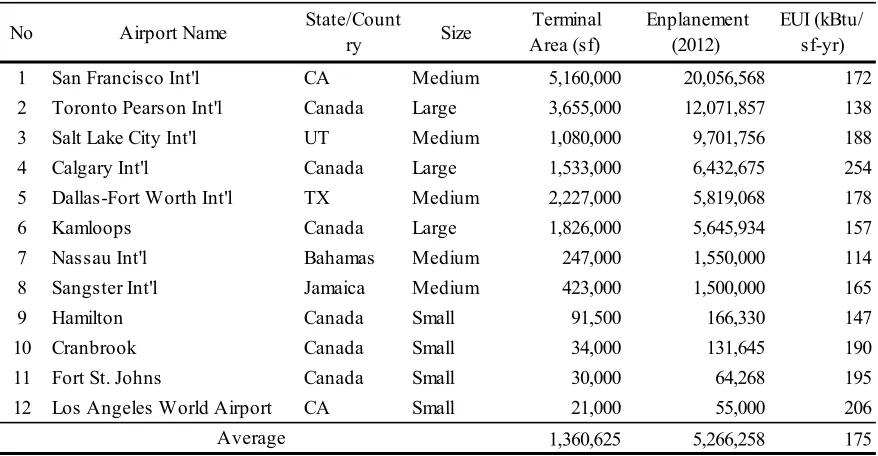
2.2.5.2 Stantec Report
Stantec, an architectural service company in Edmonton, provides geometry data and
energy consumption levels of 12 airports in North and Central America to develop and test a
reporting procedure for quantifying baseline energy usage intensity and greenhouse gas
emission for ATBs (Stantec, 2012). Table 2-11 shows reorganized information based on the
Stantec report (Stantec, 2012).
Table 2-11 Information for 12 ATBs in North and Central America
1 San Francisco Int'l CA Medium 5,160,000 20,056,568 172 2 Toronto Pearson Int'l Canada Large 3,655,000 12,071,857 138 3 Salt Lake City Int'l UT Medium 1,080,000 9,701,756 188
4 Calgary Int'l Canada Large 1,533,000 6,432,675 254
5 Dallas-Fort Worth Int'l TX Medium 2,227,000 5,819,068 178
6 Kamloops Canada Large 1,826,000 5,645,934 157
7 Nassau Int'l Bahamas Medium 247,000 1,550,000 114
8 Sangster Int'l Jamaica Medium 423,000 1,500,000 165
9 Hamilton Canada Small 91,500 166,330 147
10 Cranbrook Canada Small 34,000 131,645 190
11 Fort St. Johns Canada Small 30,000 64,268 195
12 Los Angeles World Airport CA Small 21,000 55,000 206
1,360,625 5,266,258 175 EUI (kBtu/
sf-yr) Enplanement
(2012)
Average
Size Terminal Area (sf) No Airport Name State/Count
2.2.4 Summary
A. Building types in ATBs: ticketing/check-in, passenger screening,
holdrooms/waiting lounge, concession, baggage claim/handling/screening,
circulation, office/operation areas, support areas, additional areas for special
requirements.
B. Design manuals: FAA, IATA, ICAO
C. Recent movements for energy savings: FAA, IATA, ICAO, LEED certificate of
nine airport facilities by 2012, implementation of energy conservation
technologies
D. Energy performance survey
a. CAP report: 10 ATBs in U.S.
b. Stantec report: 12 ATBs in North and Central America
2.3 Energy Performance Benchmark
2.3.1 Benchmark
The Energy Independence and Security Act (EISA) of 2007 is an Act of Congress
concerning energy policy in the U.S. Because of this Act, a guidebook was released in 2010
for building energy use benchmarks. The guide defined such important terms:
a. Benchmarking: The process of accounting for and comparing a metered
building’s current energy performance with its energy baseline, or comparing
performance over time, within and between peer groups, or to document top
performers (EISA Section 432, 2010; APEC, 1999; Stroud, 2015).
b. Building Energy Use Benchmarking System: A tool or system of tools that
enables the energy performance of a metered building to be benchmarked. See
definition of “benchmarking” above (EISA Section 432, 2010; APEC, 1999;
Stroud, 2015).
The book outlines minimum data input required for energy benchmarking.
a. Building Characteristics: type of building or facility, building or facility
location, all floor areas in the building (EISA Section 432, 2010; APEC,
1999).
b. Energy Consumption: Includes monthly or annual (depending on the
benchmarking system) site energy consumed by the building and measured
using standard or advanced meters (EISA Section 432, 2010; APEC, 1999).
2.3.2 EUI Model
Benchmark models have developed a regression model utilizing the statistical effect
of climate, HVAC system design, occupancy patterns, and building use. Most analysts
commonly suggested the regression model as an equation (Nie, Hull, Jenkins, Steinbrenner,
& Brent, 1975; Monts & Blissett, 1982; Sharp, 1996; Chung, Hui, & Lam, 2006):
⋯
where is an intercept, . . . are regression coefficient, … are standardized
values, and ε is random error.
Standardized values of each factor are calculated as non-unit values:
/
(2‐2)
where, X is a value of the variable, μ is mean, and σ is standard deviation.
By selecting factors and calculating their regression coefficients, the regression model
is specified to define the energy performance level of buildings. Monts & Blissett (1982)
suggested the regression model with a sample of Texas school and university buildings.
Based on the data, they specified variables as 16 different factors including climate,
occupancy pattern, HVAC system, and building type. The regression model is given (Monts
& Blissett, 1982):
∗ ∗ ∗ ∗ ∗
∗ ∗ ∗ ∗ ∗ ∗
∗ ∗ ∗ ∗ ∗
(2‐3)
where, EUI= Energy Utilization Index, HDD= Heating Degree Days, CDD= Cooling
Degree Days, DAYOCP= Day Occupants Monday through Friday, YRRND= Dummy
variable taking the value of one if the building operates on a year-round basis and zero if it
building utilizes Direct Expansion window units and zero if it does not, EC= Dummy
variable taking the value of one if the building utilizes Evaporative Coolers and zero if it
does not, PAFC = Dummy variable for Primary-Air-Fan-Coil, SDSZ= Dummy variable for
Single-Duct-Single-Zone, TR= Dummy variable for Terminal-Reheat, DD= Dummy variable
for Dual-Duct, MZ= Dummy variable for Multi-zone, SSP= Dummy variable using the value
of one if the building is a School Special Purpose building and zero if it is not, UCO=
Dummy variable for University Classroom and Office, UD= Dummy variable for University
Dormitory, USP= Dummy variable for University Special Purpose, B0= zero intercept, and
B1 to B16 = regression coefficients.
With the calculation of regression coefficients from 16 variables, the final regression
model is given (Monts & Blissett, 1982):
558,391 122.52 ∗ 179.36 ∗ 13.71 ∗
1,359 ∗ 76,469 ∗ 40,564 ∗
27,581 ∗ 124,005 ∗ 11,400 ∗ 203,193
∗ 36,208 ∗ 78,641 ∗ 93,232 ∗ 99,805
∗ 65,722 ∗ 28,066 ∗
(2‐4)
By using the model, the EUI of buildings can be easily calculated, and the EUIs of
different buildings can be compared. According to the result, climate influenced about 42%
of the variance in EUI. Especially, PAFC, TR, SSP, and UCO can be significant factors for
However, all regression coefficients based on raw data were not statistically validated
whether variables had strong relationship to changes in EUI or not. To remove
unstandardized effects from raw data, the standardizations of each value are required.
In order to define the effectiveness of the models, some statistical tools are required.
To find the amount of variations or dispersion of results derived from models, the standard
deviation is typically used. Also, to finding delicate differences between models or
correlations between factors, the regression analysis and the Analysis Of Variance (ANOVA)
test can be used. In the linear regression analysis, the Root Mean Squared Error (RMSE)
measures the average of the squares of the errors or deviations, the squared (or adjusted
R-squared) values indicate how much of the total variation in the dependent variable can be
described by the independent variable (Agresti & Finlay, 1999; Lund Research Ltd).
≡ 1
(2‐5)
∑
(2‐6)
where, is population, is independent (predicted) values, is regression’s
dependent variable.
is similar to the CV with the RMSD taking the place of the standard deviation (UCLA,
2016). Equation (2-7) indicates the CV of RMSE.
CV of
(2‐7)
where, is mean of the dependent variable.
As indicated in Eq. (2-5) and (2-6), the value of R-squared is increasing as the sum of
squares of residuals is decreasing, whereas the value of RMSE is decreasing as the mean
square error is decreasing. In other words, the correlation between dependent and
independent variables is increasing as the value of R-squared is increasing, which is
equivalent to the fact that models which have higher values of R-squared (or lower values of
RMSE or standard error of the estimate) are statistically precise. And also, the regression
analysis provides ANOVA table which consists of F ratio (F) and Significance (Sig.). the
value of F is defined by dividing mean square between groups by mean square
within-groups, so models which have large F ratio are relatively effective (Elvers, 2013; Agresti &
Finlay, 1999). The value of Sig. (or p-value) from ANOVA test is the significance of the F
ratio. If the Sig. (p-value) is less than or equal the α-level, then the null assumption (H0) that
all the means are equal can be rejected. Typically, if the Sig. (p-value) is greater than 0.05,
we fail to reject H0, which means that there is insufficient evidence to claim that some of the
means may be different from each other (Elvers, 2013). In other words, if the Sig. (p-value)
2.3.3 Summary
A. Definition of terms: Benchmark and benchmarking system
B. Required input data: Building characteristics, energy consumption
C. Regression modeling: Mathematical formation for EUI indicator
D. Tools for statistical analysis: Standardization, Linear Regression, ANOVA test
2.4 Summary of Literature Review
Most energy analysts have used the CBECS data to define the energy performance of
commercial buildings. However, the data still is missing information and outliers, and the
patterns of EUI vs. factors are still messy. For this reason, data trimming and outlier cutting
may be required to utilize the CBECS data effectively.
Although several studies and policies have complemented and strengthened building
performance and increased energy efficiency, design standards or criteria for large-scaled
transportation buildings are lacking. Among the building types, ATBs are among the largest
energy consuming buildings and among the largest-scaled building complexes. Even with the
growing prevalence of ATBs, energy-performance metrics have not been proposed in many
studies such as the CBECS report by the U.S. EIA, the AIA guide, or other design manuals.
Energy performance information for only 20 ATBs is available to the public. For this reason,
many designers and engineers do not clearly refer to ATBs’ EUI baseline.
Due to the operational characteristics of ATBs, there are complexities and difficulties
validation can cause errors or imprecision in performance analysis. Several benchmark
models cannot be utilized to analyze building complexes that are not categorized in the
CBECS report or other studies as surveyed building types. Most technical studies focus on
the operational aspects of vehicles and HVAC systems, and thermal dynamics. Existing
benchmark models utilize simple average EUIs as an intercept in the equation. Lack of the
information may increase the deviation of average EUI, and at the same time, the benchmark
results may not be validated as credible values.
In brief, the research problems are summarized:
1) Lack of information about ATBs: Just 20 (8 out of CAP report and 12 out of
Stantec report) ATBs information are opened to public.
2) Despite over 15,000 airports are in the U.S., ATBs are not included in most
energy surveys as a major building type.
3) ATBs consist of various building types in one-roof structure.
4) The CBECS data include some obvious outliers, possible input errors, and
missing data.
5) Existing energy performance metrics utilize simple average EUIs and raw
data.
3.
METHODOLOGY
3.1 Overview
For a comprehensive understanding of how EUI changes with different factors
including geometry information, operational characteristics, and climate conditions, this
study proposes Multivariate Regression Model (MvRM). Figure 3-1 describes the proposed
conceptual framework for MvRM which can incorporate various impact factors derived from
measured and simulated data.
The MvRM evaluates or predicts the performance of energy consumption in Airport
Terminal Buildings (ATBs) through the analyses of building geometry, operation, and
statistical interpretation. Furthermore, this model can be applied to different building types,
and it provides useful information to evaluate different types of buildings’ energy
performance. The generalized framework of the proposed MvRM can also incorporate
different energy performance surveys through a data mining process including sampling and
integrating. Another possible benefit of the generalized framework can provide insight on the
design aspect by adding morphological factors such as building orientation, shape, wall
soluti
and t
meas
Also, Fig
ion from the
the filtered
ured data, se
gure 3-2 de
e conceptual
data are ana
everal simul
Figure 3-1 C
scribes the
l framework
alyzed to fin
lation proces
Conceptual F
diagramma
k. All measu
nd significa
sses are perf
Framework
atic process
ured data are
ance as facto
formed. By c
of shaping
e filtered by
ors. In orde
comparing t
g a mathem
y statistical t
r to comple
the actual an atical
tools,
ement