ABSTRACT
Trichy, Gopinath, Rajagopal. Development of the ball indentation test to evaluate mechanical properties of nanostructured materials.
(Under the direction of Prof. R. O. Scattergood).
The goal of this thesis was to standardize the ball indentation test and subsequently apply it to evaluate the mechanical properties of nanostructured Zn.
The ball indentation test is an efficient test technique for mechanical characterization when material availability is limited, as often the case with nanostructured material. A ball indentation test set up was built in our laboratory and was used to evaluate mechanical properties of conventional materials like steels (A533B, A588B, A516 steels), Al 6061 and pure Zn. The theoretical background necessary for the BI methodology was briefly described. The effectiveness of ball indentation technique in determining the flow curve was demonstrated by comparing it with tensile results for the materials mentioned above. The influence of fixture compliance and indenter ball size on the plastic flow curve was discussed.
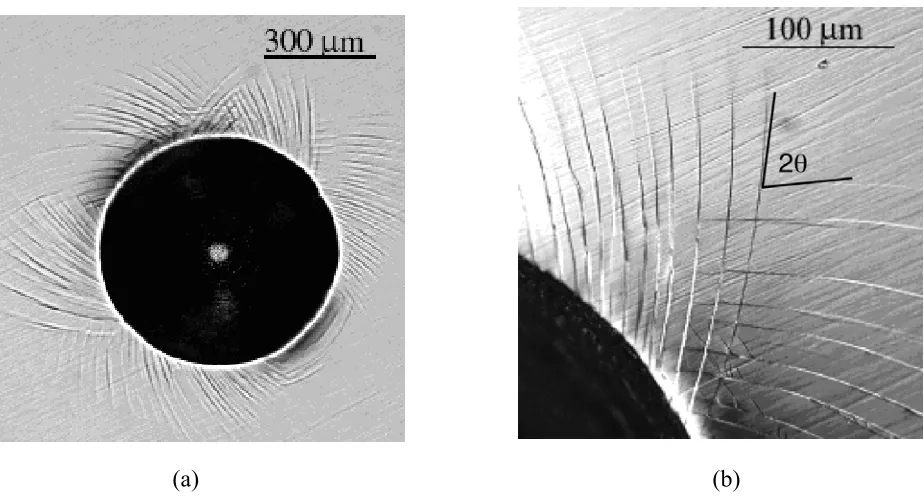
little or no effect of strain rate on the flow curve. Optical microscopy around the indent revealed intersecting radial and concentric shear bands. The included angle between the intersecting shear bands along the radial direction deviates from 90°, consistent with an influence of normal stress on the slip plane during yielding.
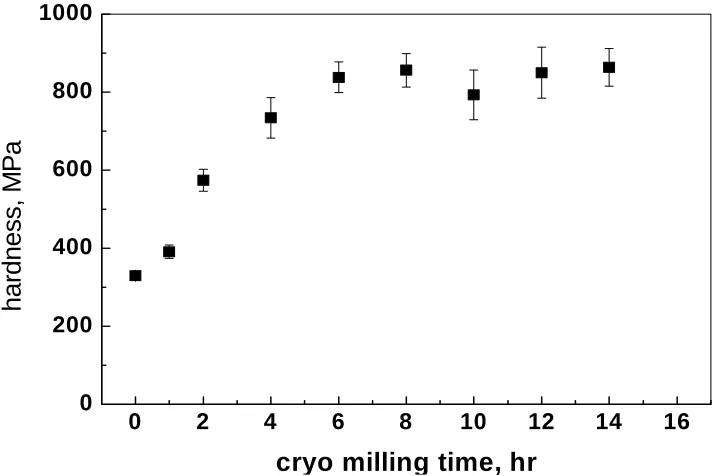
Ultra fine-grained and nanostructured Zn was produced by ball milling at liquid nitrogen temperatures. Variation of grain size and hardness as a function of cryo-milling time was studied. The hardness increased steadily at lower cryo-milling times. At longer milling times (6hr and more) the hardness reaches a steady state. The hardness values obtained were higher than that predicted by a Hall-Petch strengthening effect. Transmission electron microscopy studies were done to estimate the average grain size and grain size distributions. TEM studies also revealed significant dislocation activity. The miniaturized disk bend test (MDBT) and the ball indentation (BI) test were used to mechanically characterize the 14 hr cryo-milled and subsequently compacted sample with the average grain size = 42 nm and hardness = 864 MPa. MDBT results revealed poor ductility. BI test results showed low strain hardening and low strain rate sensitivity when compared to conventional coarse-grained Zn.
fracture surfaces showed that the UFG Zn is ductile. Six times the shear yield obtained by the shear punch test agreed well with the average hardness value. Ball indentation test results revealed negligible strain hardening and the flow curve seemed to soften at higher strains.
Development of the ball indentation test to evaluate mechanical
properties of nanostructured materials.
Gopinath R Trichy
A thesis submitted to the graduate faculty of North Carolina State University in
partial fulfillment of the requirements for the Degree of Master of Science.
Materials Science and Engineering Raleigh, 2005
Approved by:
Prof. R. O. Scattergood Prof. C. C. Koch
Chair of Advisory Committee Member
Prof. K. L. Murty Prof. V. Misra
BIOGRAPHY
ACKNOWLEDGEMENTS
I would like to thank my research advisor Dr. R.O. Scattergood for his guidance, support and encouragement during the course of this study. I would also like to express my sincere thanks to my co-advisors Dr. C.C. Koch and Dr. K.L. Murty. Their suggestions and advice during the weekly research group meetings were of immense help and have contributed to the successful completion of this project. In addition to being my research advisors Dr. R.O. Scattergood, Dr. C.C. Koch and Dr. K.L. Murty have also served as my committee members and I them grateful to them for their useful suggestions and remarks in regard to my thesis. Special thanks to Dr. V. Misra, the minor representative on my committee, her comments were of great help.
I am grateful to Dr. K. Youssef, the post-doc in our group, for his help, guidance and advice during the experimental studies, SEM and TEM analysis. I thank fellow graduate students in the group Mr. K.V. Rajulapati and Mr. R.K. Guduru for their co-operation, help and fruitful discussions. Mr. Rajulapati who is also my roommate has been a great friend and I acknowledge his help and encouragement. I would also like to thank my friends and fellow graduate students in the department, Mr. V. M. Bhosle and Mr. S. Ramachandran for their unvarying support and help.
Narasimhan Trichy, who lives in the United States of America. He has been a constant motivator and I acknowledge his help, support and advice.
TABLE OF CONTENTS
LIST OF TABLES………ix
LIST OF FIGURES………..xi
INTRODUCTION……….1
CHAPTER 1. Background………8
1.1 Synthesis of bulk UFG/nanostructured materials.………...8
References.………...14
1.2 Ball milling.……….……16
1.2.1 Evolution and mechanism of nanocrystalline microstructure development during milling ………...17
1.2.2 Milling process variables.………...20
References.…..………..23
1.3 Mechanical properties of nanostructured materials ……….25
1.3.1 Hardness vs. grain size and Hall-Petch behavior ……….…….25
1.3.2 Elastic properties of nanostructured materials ………..32
1.3.3 Ductility in nanostructured and UFG materials ………32
References…..………..37
1.4 Ball indentation test………...40
CHAPTER 2. Experimental procedures………49
2.1 Ball milling………..49
2.2 Material………51
2.3 Characterization techniques……….52
2.4 Mechanical testing………...53
References………55
CHAPTER 3. Standardization of the ball indentation test and influence of experimental parameters on the evaluated plastic flow curve……….56
3.1 Abstract………56
3.2 Introduction………..56
3.3 BI methodology………...57
3.4 Experimental procedures……….…60
3.5 Results and discussion……….…62
3.5.1 Effect of indenter ball size………63
3.5.2 Comparison with tensile data……….…...64
3.5.3 Conventional Zinc……….……67
3.6 Conclusions………..70
References………..…..70
CHAPTER 4. Mechanical properties of Zr52.5Ti5Cu17.9Ni14.6Al10 bulk metallic glass obtained using ball indentation tests………..72
4.2 Introduction………..72
4.3 Material and experimental procedures……….73
4.4 Results………..74
4.5 Discussion……….………...79
4.6 Conclusions………..81
References………..82
CHAPTER 5. Synthesis, characterization and mechanical properties of cryo-milled Zinc………84
5.1 Abstract………84
5.2 Introduction………..84
5.3 Experimental………87
5.4 Results………..88
5.5 Discussion………..102
5.6 Conclusions………109
References………109
CHAPTER 6. Mechanical characterization of UFG Zn by small specimen test techniques; Ball indentation test, Shear punch test and Miniaturized disk bend test………113
6.1 Abstract………..113
6.2 Introduction………113
6.3.1 Ball indentation test………114
6.3.2 Shear punch test………..116
6.3.3 Miniaturized disk bend test……….118
6.4 Material and experimental procedure………119
6.5 Results and discussion………...122
6.6 Conclusions………131
References………131
CHAPTER 7. Comparison of deformation mechanisms between coarse-grained and nanostructured zinc………...134
7.1 Introduction………134
7.2 Results of coarse grained Zn..………135
7.3 Results of nanostructured Zn……….141
7.4 Discussion………..146
References………..148
SUMMARY………149
LIST OF TABLES
CHAPTER 1. Background
Table 1. Data for percent elongation vs. grain size for samples prepared by two-step processing………..34 Table 2. Data for percent elongation vs. grain size for samples prepared by one-step processing………..35
CHAPTER 3. Standardization of the ball indentation test and influence of
experimental parameters on the evaluated plastic flow curve
Table 1. Comparison of dp from different methods using stiff fixture………..62 Table 2. Constraint parameter (α) for different materials as a function of ball size and
yield parameter Βm……….64
Table 3. BI test results for various test materials………...65
CHAPTER 7. Comparison of deformation mechanisms between coarse-grained and
nanostructured zinc
LIST OF FIGURES
CHAPTER 1. Background
1.1 Synthesis of bulk UFG/nanostructured materials
Fig. 1. Schematic illustration of the (a) SPTS and (b) ECAP technique [15]…………....12
1.2 Ball milling
Fig. 2. Schematic of the process during milling [8]..……….18 Fig. 3. Minimum grain size (dmin) vs. melting temperature [7]..………...19 Fig. 4. SPEX shaker mill used in our lab………...21
1.3 Mechanical properties of nanostructured materials
Fig. 11. Percent elongation vs. grain size for samples prepared by one-step processing
[26]……….35
1.4 Ball indentation test Fig. 12. Ball indentation test showing multiple indentation cycles………...41
Fig. 13. Schematic of the ball indentation test………...41
Fig. 14. Geometry during indentation………46
CHAPTER 2. Experimental procedures Fig. 1. Spex shaker mill used for ball milling………...50
Fig. 2. Tool steel vials used for milling……….50
Fig. 3. Nylon vial containers used for cryo-milling………...51
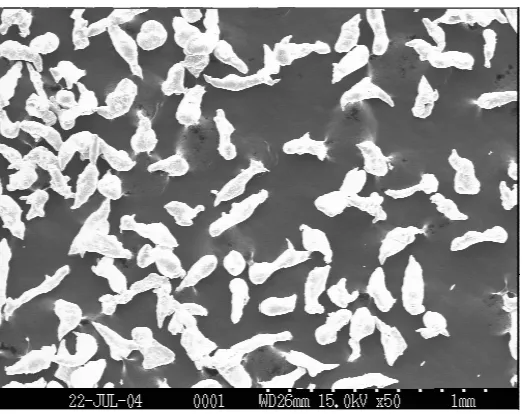
Fig. 4. SEM micrograph of Zn-A ………..51
Fig. 5 SEM micrograph of Zn-B………51
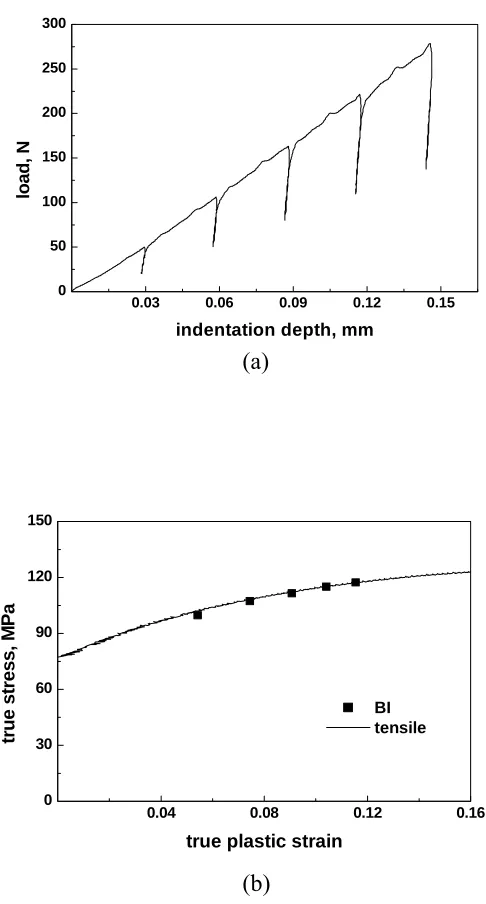
CHAPTER 3. Standardization of the ball indentation test and influence of experimental parameters on the evaluated plastic flow curve Fig. 1. (a) Load vs indentation depth plot for a BI test on A533B steel. (b) Schematic illustration of an indent………..61
Fig. 2. Effect of indenter size on the σ−εpcurves derived from BI tests on A533B steel………63
Fig. 3. Tensile σ−εpcurves and BI data for various materials………...66
Fig. 5. (a) Load-indentation depth plots at varying strain rates for pure Zn. (b) Corresponding σ vs. εp stress-strain curves. (c) Strain rate sensitivity (m) calculation from log(σ) vs. log(ε∗) plot………69
CHAPTER 4. Mechanical properties of Zr52.5Ti5Cu17.9Ni14.6Al10 bulk metallic glass
obtained using ball indentation tests
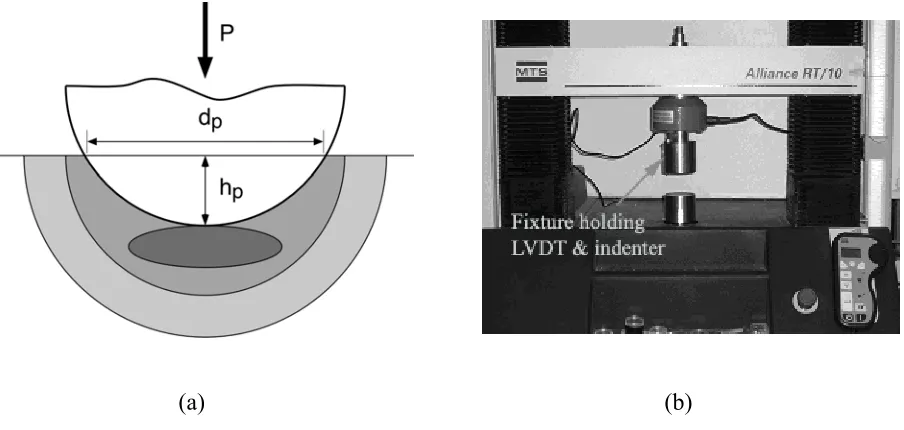
Fig. 1. (a) Schematic of the ball indentation test. The indentation plastic zone (shaded) grows outward as P increases. (b) Ball indentation test setup………...74 Fig. 2. (a) Ball Indentation P vs. hp curve for ZrBMG. (b) The corresponding BI plastic flow curve………..77 Fig. 3.BI plastic flow curves for the different strain rates indicated……….77 Fig. 4. (a) Nomarski optical micrographs showing slip lines around the indent. (b) Magnified image of the area adjacent to the indentation edge.……….78 Fig. 5.(a) Area around an indent formed at higher loads. (b) An optical micrograph of a Vickers indentation………78
CHAPTER 5. Synthesis, characterization and mechanical properties of cryo-milled
Zinc
Fig. 15. Taken from ref. [34], showing hardness vs. for cryo-milled Zn (solid circles) and room temperature Zn (solid triangles). The relative density of the cryo-milled samples is
shown by open squares………105
Fig. 16. Hardness vs. d-1/2 (d= grain size) for nanostructured Zn [34]. Data from references [34, 35] is compared with data from this work………..106
Fig. 17. Plot showing minimum grain size obtained by ball milling vs. melting temperature for various materials taken from ref. [10]. Data point for Zn from this study indicated by an open square is included………..106
CHAPTER 6. Mechanical characterization of UFG Zn by small specimen test techniques; Ball indentation test, Shear punch test and Miniaturized disk bend test Fig. 1. (a) Typical load vs. indentation depth plot obtained by a ball indentation. (b) Schematic illustration of the BI test……….115
Fig. 2. Schematic of the shear punch test [14]……….117
Fig. 3.Schematic illustration of the miniaturized disk bend test [22]……….119
Fig. 4. SEM micrograph of the starting Zn powder……….120
Fig. 5. (a) Experimental set up of the ball indentation test (b) Shear punch test……….121
Fig. 6. In-situ consolidated Zn spherical balls produced after 25 hrs of room temperature ball milling………...123
Fig. 7. Variation of hardness from the edge to the center of the spherical Zn ball……..123
hrs) showing large distribution of grain sizes………..125 Fig. 10. MDBT result on the UFG Zn……….126 Fig. 11. (a) SEM micrograph showing the hat-shaped morphology of the UFG Zn sample after MDBT. (b) SEM micrograph showing the fracture surface of the UFG Zn sample………..127 Fig. 12. Shear punch test result on UFG Zn………128 Fig. 13. Ball indentation test results on UFG Zn. (a) Load vs. indentation depth plots at various strain rates. (b) The corresponding flow curves. (c) Log(stress)-log(strain rate) plot for strain rate sensitivity calculation……….130
CHAPTER 7. Comparison of deformation mechanisms between coarse-grained and
nanostructured Zinc
Fig. 1. Microstructure of CG Zn………..135 Fig. 2. (a) σ vs. εp for CG Zn at different strain rates. (b) log(σ) vs. log(εp) on an expanded scale……….137 Fig. 3. Strain hardening exponent (n) vs. log(ε*) for CG Zn………...137 Fig. 4. (a) log(σ) vs. log(ε*) at different strains for CG Zn. (b) strain rate sensitivity (m) vs. strain(εp) for CG Zn………..138 Fig. 5. (a)Truestress (σ) vs. log(ε*) for CG Zn. (b) S (slope from Fig.5(a)) vs. strain
(εp)………139
Fig. 8. (a) log(σ) vs. log(ε*) at different strains for NS Zn. (b) strain rate sensitivity (m) vs. strain(εp)for NS Zn………144 Fig. 9. (a) Truestress (σ) vs. log(ε*) for NS Zn. (b) S (slope from Fig.5(a)) vs. strain
INTRODUCTION
Nanostructured (grain sizes < 100 nm) and ultra fine-grained materials (grain sizes between 100 and 500 nm) have been the focus of numerous research studies over the past decade. Such extensive research has been motivated mainly because of the novel/superior properties these new and novel class of materials exhibit. The unique physical, chemical and mechanical properties that these materials exhibit have been attributed to the small grain sizes and large fraction of grain boundaries [1]. Of importance to this study are the mechanical properties and available literature indicates following properties:
1. Strength/hardness: The hardness for the nanostructured and ultra fine-grained (UFG) materials can be a factor of 2 to 10 times the hardness of their conventional coarse-grained counterparts [2,3]. The major interest involving studies of strength in the case of nanostructured and UFG materials has been to see if the Hall-Petch relation holds at smaller grain sizes. Literature shows varied results that can be separated into three classes.
i. Petch relation holds even at small grain sizes with essentially the same Hall-Petch slope that is seen at large grain sizes [4].
ii. Hardness increases with decreasing grain size but with a Hall-Petch slope lower than that observed for coarse-grained material [5,6,7].
2. Elastic modulus: Earlier studies revealed significantly low elastic modulus when compared to their coarse grained counter parts [9,10], which was later attributed to porosity in the specimens. Samples free from porosity gave results in good agreement with the usual values [11,12].
3. Ductility: Nanostructured materials generally show low ductility [2,13] but recent developments show some optimism [14,15].
Nanostructured and UFG materials have been produced by a number of processing techniques. Some of these are; mechanical attrition [16,17], inert gas condensation [18], electrodeposition [19], sputtering [20], chemical synthesis [21] and severe plastic deformation techniques (like equi-channel angular pressing and high-pressure torsion) [22]. It is important to note that in some cases the structure and properties of the nanostructured or UFG material can depend on the mode of preparation and previous time-temperature history [1].
obtained from small samples. The miniaturized disk bend test (MDBT) [23, 24], sub size tensile [25] and compression tests [26] are some examples of small specimen test techniques that have been developed and applied successfully to mechanically characterize nanostructured materials.
In this project another small specimen test technique, the ball indentation (BI) test was designed, standardized and subsequently applied to evaluate mechanical properties of nanostructured and UFG Zn. The ball indentation test is based on multiple indentations on a specimen surface by a spherical indenter at the same penetration location [27-29]. The applied indentation loads and corresponding penetration depths form the raw data from which other mechanical parameters of importance like true stress, true strain, strain hardening exponent etc are derived using equations based on elastic-plastic analysis and semi empirical relationships [27-29].
In this thesis results are categorized and presented in the form of different chapters.
Chapter 1: This chapter presents the background necessary for this study.
Chapter 2: This chapter outlines the experimental procedures required for this study.
Chapter 3: This chapter deals with the methodology and standardization of the BI test technique. Effectiveness of the BI test technique was demonstrated by matching/correlating ball indentation derived flow stress curves with tensile curves for various conventional materials like steels (A533B, A588B, A516), Al6061 and pure Zn.
Chapter 4: As an extension to the study of the test technique, the BI test was employed to evaluate the mechanical properties of bulk metallic glasses (amorphous material). Flow curve obtained by the BI test revealed significant strain hardening, which is unusual for such type of materials.
Chapter 5: This chapter deals with the synthesis, characterization and study of mechanical properties of nanostructured Zn. Nanostructured Zn is synthesized by cryo-milling. TEM studies were done to estimate the average grain size and grain size distributions. The BI test and the MDBT were used for mechanical characterization.
a variety of small specimens tests such as the ball indentation (BI) test, the miniaturized disk bend test (MDBT) and the shear punch test (SPT).
Chapter 7: This chapter compares and summarizes the results obtained by the BI test on coarse-grained and nanostructured Zn.
References
1. H. Gleiter, Nanostructured Mater., 1995, 6, 3.
2. J.R. Weertman in Nanostructured materials: Processing, Properties and Applications, ed. C.C. Koch, Williams Andrews Publishing, Norwich, NY, 2002, p. 397.
3. D.G. Morris, in Mechanical Behavior of Nanostructured Materials, 1998, vol. 2, Trans Tech Publications Ltd.
4. P.G. Sanders, C.J. Youngdhal, J.R. Weertman, Mater. Sci. Eng., 1997, A234-236,
77.
5. J.S.C. Jang, C.C. Koch, Scripta Metall., 1990, 24, 1599.
6. V.Y. Gertsman, M. Hoffman, H. Gleiter, R. Birringer, Acta Metall., 1994, 42,
3539.
7. G.W. Nieman, J.R. Weertman, R.W. Siegel, Scripta Met., 1989, 23, 2013.
8. U. Erb, Nanostructured Mater., 1995, 6, 533.
9. H. Gleiter, Prog. Mater. Sci., 1989, 33, 223.
10. G.W. Nieman, J.R. Weertman, R.W. Siegel, J. Mater. Res., 1991, 6, 1012.
12. P.G. Sanders, J.A. Eastman. J.R. Weertman, Acta Mater., 1997, 45, 4019.
13. C.C. Koch, D.G. Morris, K. Lu, A. Inoue, MRS Bulletin, 1999, 24, p. 54.
14. C.C. Koch, J. Metastable and Nanocrystalline Mater., 2003, 19, 9.
15. K.M. Youssef, R.O. Scattergood, K.L. Murty, C.C. Koch, Appl. Phys. Lett., 2004,
85, 929.
16. C.C. Koch, Nanostructured mater., 1993, 2,141.
17. C.C. Koch, Nanostructured mater., 1997, 9, 13.
18. R. Birringer, H. Gleiter, H.P. Klein, P. Marquardt, Phys. Lett. A, 1984, 102, 365.
19. R.O. Hughes, S.D. Smith, C.S. Pande, H.R. Johnson, R.W. Armstrong, Scripta Metall., 1986, 20, 93.
20. Z.G. Li, D.J. Smith, Appl. Phys. Lett., 1989, 55, 919.
21. Gan-Moog Chow and Lynn K. Kurihara in Nanostructured materials: Processing, Properties and Applications, ed. C.C. Koch, Williams Andrews Publishing, Norwich, NY, 2002, p. 3.
22. R.Z. Valiev, R.K. Islamgaliev, I.V. Alexandrov, Prog. Mater. Sci., 2000, 45, 103.
23. M. Hoffman, R. Birringer, Acta Mater., 1996, 44, 2729.
24. T.R. Mallow, C.C. Koch, Acta Mater., 1998, 46, 6459.
25. Q. Wei, D. Jia, K.T. Ramesh, E. Ma, Appl. Phys. Lett., 2002, 81, 1240.
27. G. Trichy, R. Kishore, R.O. Scattergood, C.C. Koch, K.L. Murty, “Influence of Experimental Parameters on the Plastic Flow Curve obtained by Ball Indentation Testing”, Ultra fine Grained Materials III, Edited by Y.T. Zhu, T.G. Langdon, R.Z. Valiev, S.L. Semiati, D.H. Shin, and T.C. Lowe, TMS, 2004, p. 553-558.
28. F.M. Haggag, in ‘Small Specimen Test techniques Applied to Nuclear Reactor Vessel Thermal Annealing and Plant Life Extension,’ ASTM STP 1024, American Society for Testing and Materials, Philadelphia, 1993, p. 27.
CHAPTER 1.
BACK GROUND
1.1 Synthesis of bulk UFG/nanostructured materials
A wide variety of techniques have been successfully used to synthesize ultra fine grained (UFG) and nanostructured materials. Some of them are listed below.
Mechanical attrition [1,2]
Severe plastic deformation (SPD) techniques [3] Inert gas condensation [4]
Electrodeposition [5] Chemical synthesis [6] Sputtering [7]
Crystallization of amorphous phases by annealing [8] Rapid solidification [9]
reactions to produce nanostructured particles. Major chemical synthesis modes and methods have been reviewed by Chow et. al. [6].
Top down processes are more prevalent and have been widely used to produce bulk UFG and nanostructured material. These processing methods involve bulk solids as starting material from which nanostructured materials are obtained by structural decomposition. In most techniques that fall into this category mechanical/thermal means are employed for structural decomposition. Ball milling and SPD techniques are top down processing methods that employ severe plastic deformation for structural decomposition. Severe plastic deformation induces defects (dislocations) into the material, which then self assemble into nanoscale grains with or without aid of thermal treatments.
because of porosity was instead attributed to the presence of wide, low-density grain boundaries [12]. Another example is the negative Hall-Petch behavior, in nanostructured Cu and Pd produced by inert gas condensation, reported in 1989 by Chokshi et. al. But later research on nanostructured Cu and Pd (after improvements in the inert gas condensation experimental techniques were made) showed data from hardness and compression tests that were consistent with the extrapolations of Hall-Petch coarse grain behavior into the nano regime [12]. Consequently the earlier report on the negative Hall-Petch effect was attributed to poor processing techniques and porosity in the samples. Improvements in inert gas condensation synthesis and compaction techniques [13] helped produce nanostructured samples with less porosity and flaws. These improved samples showed superior strength, ductility and elastic modulus [12,14] when compared to earlier data on the same material. These results show the striking ill effects artifacts have on the mechanical properties and thus emphasize the importance to produce artifact free samples.
severe plastic torsion straining (SPTS) [15,16] and equal channel angular pressing (ECAP) [15,17]. Other notable bulk deformation techniques include multiple forging [18], accumulative roll bonding [19], repetitive corrugation and straightening [20].
In case of SPTS, deformation by torsion straining under high pressure is employed to fabricate disk shaped samples. The sample is compressed between two dies and one of them rotates thus generating significant shear strains. A schematic of the SPTS technique is shown in Fig. 1(a). Samples are usually disks with 10-20 mm diameters and 0.2-0.5 mm thicknesses. The disk samples were shown to have a more or less uniform microstructure across the sample. Detailed calculations [15] involving both the compressive and torsional stress states corroborate this observation. The SPTS technique has also been successfully used to compact nanopowders. Nanocrystalline Ni powders produced by ball milling and compacted by the SPTS technique showed 95% density and hardness values of 8.6 GPa [21].
Fig. 1. Schematic illustration of the (a) SPTS and (b) ECAP technique [15].
Multiple forging is another technique used to produce UFG/nanostructured material by deformation of bulk billets. In this technique the material is subjected to multiple forging operations (setting-drawing) with a change of axis of the applied stress after each pass. Unlike SPTS and ECAP, the homogeneity of the strains provided by this technique is inferior. However this method is useful to achieve nanostructure in brittle materials by processing at elevated temperatures. Grain refinement at the elevated processing temperatures has been attributed to dynamic recrystallization [15]. Multiple forging technique has been successful in producing refined grain structures in a variety of Ti, Ni and Mg based alloys [15].
cut and the specimen surfaces are cleaned. The cut specimens are then stacked and the stacked sample is rolled again to sufficient deformation so that good bonding is established. The process is repeated and the accumulated strains can reach large values depending on the number of passes. Work has been done using dissimilar foils and they exhibit nanostructured grain formation [23]. The number of rolling cycles in this study was large, about 63-75 times. Work has also been done on similar metal sheets. However the grain structure obtained was in the submicron range.
Repetitive corrugation and straightening involves two basic steps. First the sample is bent or corrugated using a special die and then straightened between two flat plates. Repetition of this process helps build up significant plastic strain in the samples. In some cases the samples are immersed in liquid nitrogen before deforming them so as to lower the chances of dynamic recovery and consequently improve efficiency of grain refinement. The RCS technique was effectively used to produce UFG Cu [20].
References
1. C.C. Koch, Nano-structured mater., 1993, 2, 141.
2. C.C. Koch, Nano-structured mater., 1997, 9, 13.
3. R.Z. Valiev, A.V. Korznikov , R.R. Mulyukov, Mater. Sci. Eng., 1993, A168,
141.
4. R. Birringer, H. Gleiter, H.P. Klein, P. Marquardt, Phys. Lett. A, 1984, 102, 365.
5. R.O. Hughes, S.D. Smith, C.S. Pande, H.R. Johnson, R.W. Armstrong, Scripta Metall., 1986, 20, 93.
6. Gan-Moog Chow, Lynn K. Kurihara in Nanostructured materials: processing, properties and applications, ed. C.C. Koch (Williams Andrews Publishing, Norwich, NY, 2002), p. 3.
7. Z.G. Li, D.J. Smith, Appl. Phys. Lett., 1989, 55, 919.
8. K. Lu, W.D. Wei, T.J. Wang, Scripta Metal. Mater., 1990, 24, 2319.
9. A. Inoue, Mater. Sci. Eng., 1994, A179/A180, 57.
10. E.L. Hu, D.T. Shaw in Nanostructure Science and Technology, ed. by R.W. Seigel, E.L. Hu and M.C. Roco (Kluwer Academic Publ. Dordrecht, 1999), p. 15. 11. P.G. Sanders, J.G. Barker, J.R. Weertman, J. Mater. Res., 1996, 11, 311.
12. P.G. Sanders, C.J. Youngdhal, J.R. Weertman, Mater. Sci. Eng., 1997, A234-A236, 77.
13. P.G. Sanders, G.E. Fougere, L.J. Thompson, J.A. Eastman. J.R. Weertman, Nano-structured mater.,1997, 8, 243.
14. P.G. Sanders, J.A. Eastman. J.R. Weertman, Acta Mater., 1997, 45, 4019.
16. R.Z. Valiev, A.V. Korznikov, R.R. Mulyukov, Mater. Sci. Eng., 1993, A168, 141.
17. V.M. Segal, V.I. Reznikov, A.E. Drobyshevkij, V.I. Kopylov, Metally, 1981, 1,
115.
18. O.R. Valiahmetov, R.M. Galeyev, G.A. Salishchev, Russian Metally, 1990, 10,
204.
19. Y. Saito, H. Utsunomiya, N. Tsuji, T. Sakai, Acta Mater., 1999, 47, 579.
20. J.Y. Huang, Y.T. Zhu, H. Jiang, T.C. Lowe, Acta. Mater., 2001, 49, 1497.
21. R.Z. Valiev, R.S. Mishra, J. Grosa, A.K. Mukherjee, Scripta Mater., 1996, 34,
1443.
22. R.Z. Valiev, I.V. Alexandrov, Y.T. Zhu, T.C. Lowe, J. Mater. Res., 2002, 17, 5.
23. L. Battezzati, P. Pappalepore, F. Durbiano, I. Gallino, Acta. Mater., 1999, 47,
1.2 Ball milling
Mechanical attrition (ball milling) of single or multicomponent powders is a versatile technique that has been widely used to produce UFG/nanostructured material. This method produces nanostructured material by inducing severe plastic deformation to bring about structural decomposition of the coarse grained structures [1]. Lattice defects accumulate during the plastic deformation and consequently structural decomposition occurs. Mechanical attrition can be categorized as [1]
Mechanical milling: milling of single-phase elemental or intermetallic powders. Mechanical alloying: milling of a mixture of single-phase powders that leads to compositional changes.
1. Production of fine dispersion of second phase (usually oxide) particles. 2. Extension of solid solubility limits.
3. Refinement of grain sizes down to nanometer range. 4. Synthesis of novel crystalline and quasicrystalline phases. 5. Development of amorphous (glassy) phases.
6. Disordering of ordered intermetallics.
7. Possibility of alloying difficult to alloy elements.
8. Inducement of chemical (displacement) reactions at low temperature. 9. Scaleable process.
1.2.1 Evolution and mechanism of nanocrystalline microstructure development
during milling
Fig. 2. Schematic of the process during milling [8].
The understanding of the evolution of nanostructure during milling comes from the initial work of milling and TEM studies on Ru and AlRu [9,10]. In this work shear bands with high dislocation densities were observed during early stages of milling. Small (8-12 nm) grains with low angle boundaries were seen within these shear bands. As milling times were increased the shear bands coalesced and the grain size decreased. The small angle grain boundaries between the nano grains changed to high angle grain boundaries suggesting grain rotation. Fecht et. al. [11] have described the development of nanocrystalline microstructure during milling in three basic stages.
Stage 1: Deformation localization in shear bands containing a high dislocation density. Stage 2: Dislocation annihilation/recombination/rearrangement to form cell/subgrain structures with nanoscale dimensions-further milling extends this structure throughout the sample.
The minimum grain size obtainable during milling depends on the material and a number of other process variables. The balance between the defect structure introduced by plastic deformation and its recovery by thermal processes governs the minimum attainable grain size [12]. Koch in his review on ball milling [7] put together data from references [9,10,12,13-16], showing a relation between the minimum grain size and melting temperature for some FCC, BCC and HCP metals (see Fig. 3) .It is clear from the figure that for some FCC metals minimum grain size attainable depends inversely on the melting temperature. However in case of the BCC, HCP and FCC metals with high melting temperature, dmin attainable is independent of melting temperature. It is important to note that most of the grain sizes mentioned in these data were derived from X-ray diffraction line broadening which predicts the average grain size and absolute values can be questionable.
The dmin attainable also depends on several experimental parameters like the ball to powder ratio [16], the milling temperature [17] and energy of the mill [17].
1.2.2 Milling process variables
Ball milling is a complex process and requires optimization of several parameters to obtain the required phase, structure and some times final state of the product. Important parameters include milling temperature, ball to powder ratio, milling container, milling atmosphere, type of mill.
Milling temperature has a direct effect on the rate at which nanostructure develops in the milled material. Generally milling is carried out at room temperature or liquid nitrogen temperatures. In our lab milling at liquid nitrogen temperatures is accomplished by circulating a continuous controlled flow of liquid nitrogen around the vial during milling. It has been reported that in most materials milling at low temperatures forms smaller grains. For example, Shen and Koch [18] observed smaller nanocrystalline grain sizes in Cu and Ni milled at –85° C as compared to milled material at room temperature. Smaller grain sizes at lower temperatures were also observed in case of intermetallic compounds like TiNi [17] and CoZr [19]. At low temperatures higher dislocation densities can be achieved because the rate of recovery gets depressed thus resulting in smaller grain sizes.
must be given to factors such as the type of mill and ball to powder ratio that govern the energy imparted during milling which in turn affects the kinetics of the process.
There exists a variety of mills that have been used for mechanical attrition; tumbler mills, attrition mills, shaker mills, vibratory mills, planetary mills etc. These have extensively been discussed in ref [6,20,21].
Generally for laboratory studies the SPEX (model 8000) shaker mill is used, see Fig. 4. These are high-energy ball mills that mill small batches (5-20 g) of powders. The milling container or the vial containing the sample charge and the hardened balls are secured in a clamp and shaken energetically. They have high frequencies and relatively small amplitudes thus creating high-energy forces during milling.
Koch [7] in his review has pointed out that there is a good agreement in the final microstructure obtained by high-energy milling [11] and conventional low energy milling [16]. He also points out that, although mill energy does not affect the final microstructure, it affects the kinetics of the process and times for attaining the same microstructure will be several orders of magnitude longer in low energy mills as compared to high-energy mills. It is important to note that the total strain imparted governs the final microstructure.
The ball to powder ratio also affects the total strain imparted during ball milling. Hence it becomes a significant factor during milling. The importance of ball to powder ratio during milling has been shown in ref. [22], where the time required to form an amorphous phase in Ti-33at%Al powder mixture varied with different ball to powder ratios. In our study we have used a ball to powder ratio of 10:1.
The milling atmosphere has a major effect on the contamination of the final product. In order to avoid oxide contamination, milling is generally carried out in an inert gas atmosphere. The vials are either filled with inert gas (argon or helium) or they can be evacuated before milling. Iron contamination from the hardened steel balls can also occur during milling. However in some cases like copper, the steel balls get coated by a thin layer of copper during early stages of milling which stops further contamination.
such cases milling results in the formation of un-wanted hollow balls/irregular clusters, which may have been subjected to non-uniform plastic deformation and thus can have non-homogenous microstructure. In these cases either the milling temperature is decreased or process control agents (PCA) are added so that milling results in powders with uniform microstructure. The PCAs adsorb on the surface of the powders and interfere with the cold welding. A variety of PCAs like stearic acid, hexane, methanol, ethanol etc., with additions in the range of 1-5wt% have been used. More details about PCAs have been discussed in ref. [6]. Milling can also produce in-situ consolidation. In-situ consolidated Cu has been produced by a combination of cryo and room temperature milling [23]. In-situ consolidation has also been observed in this project in the case of Zn. In-situ consolidated material does not require a secondary compaction step and hence avoids porosity and artifacts in the samples.
References
1. C.C. Koch, Nano-structured mater., 1993, 2, 141
2. J.S. Benajmin, Metall. Trans., 1970, 1, 2943.
3. J.S. Benajmin, Sci. Amer., 1976, 234, 40.
4. C.C. Koch, O.B. Cavin, C.G. McKamey, J.O. Scarbrough, Appl. Phys. Lett., 1983, 43, 1017.
5. J. Eckert, L. Schultz, K. Urban, Appl. Phys. Lett., 1989, 55, 117.
6. C. Suryanarayana, Prog. Mater. Sci., 2001, 46, 1.
7. C.C. Koch, Nano-structured mater., 1997, 9, 13.
9. E. Hellstern, H.J. Fecht, C. Garland, W.L. Johnson, J. Appl. Phys., 1989, 65, 305.
10. E. Hellstern, H.J. Fecht, C. Garland, W.L. Johnson, Mat. Res. Soc. Symp. Proc., 1989, 132,137.
11. H.J. Fecht, E. Hellstern, Z. Fu, W.L. Johnson, Met. Trans. A, 1990, 21A, 2333.
12. J. Eckert, J.C. Holzer, C.E. Krill, W.L. Johnson, J. Mater. Res., 1992, 7, 1751.
13. E. Gaffet, M. Harmelin, J. Less. Comm. Met., 1990, 157, 201.
14. T.D. Shen, C.C. Koch, T.L. McCormick, R.J. Nemanich, J.Y. Huang, J.G. Huang, J. Mater. Res., 1995, 10, 139.
15. T.D. Shen, W.Q. Ge, K.Y. Wang, M.X. Quan, J.T. Wang, W.D. Wei, C.C. Koch, Nano-structured mater., 1996, 7, 393.
16. D. Oleszak, P.H. Shingu, J. Appl. Phys., 1996, 79, 2975.
17. K. Yamada, C.C. Koch, J. Mater. Res., 1993, 8, 1317.
18. T.D. Shen, C.C. Koch, Mater. Sci. Forum, 1995, 179-181, 17.
19. D.K. Pathak, PhD Dissertation, North Carolina State University, 1995.
20. W.E. Kuhn, I.L. Friedman, W. Summers, A. Szegvari, ASM Metals Handbook, Vol. 7, Powder Metallurgy, p. 56, 1985.
21. C. Suryanarayana, in Powder Metal Technologies and Applications, ASM Handbook, Vol.7, Materials Spark, OH: ASM International, p. 80, 1998.
22. C. Suryanarayana, G.H. Chen, F.H. Froes, Scripta. Metall. Mater., 1992, 26, 1727.
23. K.M. Youssef, R.O. Scattergood, K.L. Murty, C.C. Koch, Appl. Phys. Lett., 2004,
1.3 Mechanical properties of nanostructured materials
The mechanical properties of UFG and nanostructured materials have been studied extensively over the last decade. The empirical Hall-Petch equation (1) predicts an increase in strength as the grain size decreases.
σy = σo + kd-1/2 (1)
where σy is the yield strength, σo is a friction stress, representing the overall resistance of the crystal lattice to dislocation movement. k is a constant and d is the grain size. If this equation holds at small grain sizes exceptional strength can be expected. This potential/possibility has been the driving force for researchers over the years to produce this new class of material that have different/superior grain-size dependent properties.
1.3.1 Hardness vs. grain size and Hall-Petch behavior
Fig. 5. Hardness vs. grain size data for various nanostructured metals compared with their course grained counterparts (values near origin)[10].
The small size of the nanostructured samples, in most cases, has restricted the studies of strength usually to hardness measurements. Typically the results are displayed as Hall-Petch plots. The major interest involving the studies of strength has been to see if the Hall-Petch relation holds at smallest grain sizes. Literature shows varied results that can be separated into three classes:
1. Petch relation holds even at small grain sizes with essentially the same Hall-Petch slope that is seen at large grain sizes [11].
2. Hardness increases with decreasing grain size but the Hall-Petch slope has a lower value than that observed for coarse-grained material [3,5,12].
Fig. 6, 7, 8 illustrate some such cases. Fig. 6 from ref. [11] shows the Hall-Petch plot for nanostructured copper produced by inert gas condensation and subsequent compaction. As shown in the plot the hardness/3 data and the compressive yield strength data follow the Hall-Petch extrapolation from coarse grain sizes into the fine grain size regime. For these data points the slope does not change as we proceed from the large grain sizes to the smaller grain sizes. How ever the tensile yield strengths fall short of the Hall-Petch behavior. The authors [11] attributed this behavior to the greater sensitivity of the tensile stress to flaws that contribute to premature failure. They have also explained the possibility of local shear banding leading to catastrophic failure in tension, as in the case of bulk metallic glasses.
other words they explain that very small grain sizes cannot sustain dislocation pileups at the observed yield stresses. Another model explaining the deviation from regular Hall-Petch slopes at small grain sizes is the two-component model proposed by Masumura et. al. [15]. They consider a more realistic approach that considers a distribution of grain sizes in nanostructured materials as opposed to model nanostructured materials composed of single grain size. They proposed a model based on the idea that there exists a critical grain size (d*) above which grains deform by a stress (σhp) that follows the Hall-Petch equation. And if the grain size drops below d* then deformation is governed by the strength (σc) governed by a Coble creep [16] mechanism.
Fig. 7. Hall-Petch behavior in nanostructured iron produced by ball milling showing small but positive slopes at small grain sizes [3].
A negative Hall-Petch slope [18] at small grain sizes has been observed in the case of nanostructured Ni produced by electrodeposition (see Fig. 8). This is in contradiction to the earlier data on electrodeposited Ni by Hughes et. al. [7] who showed a positive linear Hall-Petch plot down to 12 nm. In the literature explanations of a negative Hall-Petch slope generally depend on the phenomena of Coble creep [16] or grain boundary sliding [17].
A negative Hall-Petch slope was also observed by Chokshi et. al. [18] in the case of nanostructured Cu and Pd produced by inert gas condensation. But this phenomenon was later clarified as an artifact [1]. Weertman [1] explains that the larger grain sizes (in case of Chokshi et. al.) were produced by annealing the as processed material (not by self-processing) to produce varying grain sizes. Later, it was shown that nanostructured samples produced by inert gas condensation harden after annealing, possibly due to densification or changes in internal strains [19,20]. Weertman [1] thus clarifies that if all the samples are tested in as-prepared state, or when all the processed samples are annealed, the inverse effect disappears. Koch and Narayan [44] have critically reviewed reports of inverse Hall-Petch behavior from the literature. They conclude that most of the experiments that report inverse Hall-Petch behavior have samples that exhibit clear artifacts or at least questionable. However they have also identified few exceptions that report artifact free samples showing inverse Hall-Petch behavior.
laboratories [7,13], or sometimes even by the same laboratory over a period of time [11]. The importance of the experimental/processing techniques and their limitations has to be realized. Researchers [1,2] have also stressed the significant affect of sample imperfections (porosity, voids, cracks) on the measured strength values. This is well illustrated in Fig. 9 by Sanders et. al. [11]. The straight line in Fig. 9 shows the best-fit data of results obtained by the same group before improvements in the processing techniques were made. Later, as discussed in ref. [21] improvements in the synthesis and compaction techniques for inert gas condensation were made and this resulted in cleaner and denser samples. These new/improved samples showed much higher strength, shown as triangular data points in Fig. 9.
1.3.2 Elastic properties of nanostructured materials
Early studies [22,23] on nanostructured metals like Cu and Pd prepared by inert gas condensation revealed substantially low elastic modulus values when compared to their coarse grained counterparts. Later studies by Sanders et. al. [24] on nanostructured Cu and Pd produced by improved inert gas condensation and compaction techniques [22] revealed modulus values in good agreement with the conventional values. The earlier results were thus attributed to artifacts in the samples and density values far lower than 100%. The improved samples were shown to have less porosity and density values closer to 100% and consequently they gave results in close agreement to conventional values [25]. Shen et. al. [25] investigated the elastic behavior of nanostructured Fe, Cu and Cu-Ni alloys synthesized by mechanical attrition. They used a nanoindentation technique for their elastic behavior studies and reported a good agreement with conventional values. The only deviation was in the case of 7nm grain size Fe with a 5% deviation. The results of various modulus studies have thus implicated porosity as an important factor in producing low elastic modulus values [1].
1.3.3 Ductility in nanostructured and UFG materials
categorized taking into account the synthesizing methods and are reported separately. The first category includes data from inert gas condensation and mechanical milling methods that produce nanopowders and hence require a secondary compaction step. They are called the two-step methods. The second category includes data from single-step processes like electrodeposition and SPD techniques (ECAP, accumulative roll bonding).
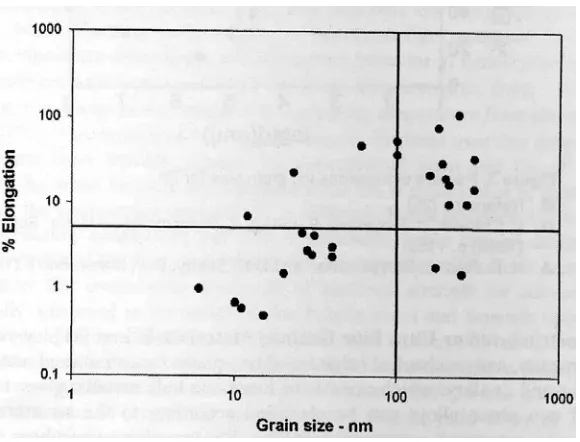
Fig. 10 taken from [26] shows % elongation in tension vs. grain size for elemental metals and alloys prepared by the two step processes. Table 1 (also taken from ref. [26]) gives the references for the data shown in the graph. Only two data points from references [6] and [27] fall above 5% elongation.
MATERIAL PROCESS GRAIN SIZE % ELONGATION REFERENCE
Cu IGC 30 nm 2 27
Cu IGC 30nm 7 27
Cu IGC 15 nm 1.5 6
Cu IGC 20 nm 0.8 6
Cu IGC 25 nm 6.3 6
Cu IGC 50 nm 2.2 6
Cu IGC 61 nm 2.2 6
Cu IGC 16 nm 2.4 24
Cu IGC 26 nm 1.8 24
Cu IGC 49 nm 1.6 24
Cu IGC 22 nm 1.6 24
Cu IGC 26 nm 1.8 28
Cu IGC 26 nm 2.1 28
Pd IGC 5 nm 0.6 6
Pd IGC 8 nm 0.3 6
Pd IGC 11 nm 0.6 6
Pd IGC 14 nm 1.8 6
Pd IGC 15 nm 0.5 6
Pd IGC 36 nm 2.6 24
Pd IGC 47 nm 4.0 24
Ni IGC 28 nm 1.1 28
Au IGC 36 nm 2.8 29
Al MM 21 nm 1.9 30
Al MM 40 nm 1.2 30
Fe MM 80 nm 0.14 31
IGC = Inert gas compaction, MM = Mechanical milling
Fig. 10. Percent elongation vs. grain size for samples prepared by two-step processing, taken from ref. [26].
MATERIAL PROCESS GRAIN SIZE % ELONGATION REFERENCE
Cu ED 174 nm 1.8 32
Cu ED 251 nm 1.5 32
Cu SPD 210 nm 17 33
Cu ECAP 100 nm 55 34
Cu ECAP 300 nm 15 35
Cu ECAP+R 200 nm 20 35
Cu ECAP+R+A 190 nm 30 35
Cu-0.4Cr-0.2Zr ECAP 160 nm 22 36
Ni ED 6 nm 1 37
Ni ED 10 nm 0.7 37
Ni ED 20 nm 1.5 37
Ni ED 40 nm 3.1 37
Ni ED 11 nm 0.6 38
Ni ED 15 nm 0.5 38
Ni ED 40 nm 2.4 38
Ni ED 26 nm 4.5 39
Ni ED 28 nm 2.8 39
Ni ED 30 nm 2.5 39
Ni ED 31 nm 4.2 39
Co ED 12 nm 7.0 40
Al alloy ECAP 300 nm 34 41
Al alloy ARB 270 nm 10 42
IF steel ARB 210 nm 10 42
Zn ISMM 23 nm 23 43
Zn ISMM 60 nm 48 43
Zn ISMM 180 nm 78 43
Zn ISMM 240 nm 110 43
Ti SPD 100 nm 38 34
ED = Electrodeposition; ECAP = equal channel angular pressing; R = rolling; A = annealing; ARB = accumulative roll-bonding; SPD = severe plastic deformation; ISMM = in-situ mechanical milling
References
1. J.R. Weertman in Nanostructured materials: processing, properties and applications, ed. C.C. Koch (Williams Andrews Publishing, Norwich, NY, 2002) pp.397.
2. D.G. Morris, in Mechanical Behavior of Nanostructured Materials, 1998, vol. 2, Trans Tech Publications Ltd.
3. J.S.C. Jang, C.C. Koch, Scripta Metall., 1990, 24, 1599.
4. C.C. Koch, Nano-structured mater., 1993, 2, 141
5. G.W. Nieman, J.R. Weertman, R.W. Siegel, Scripta. Mater., 1989, 23, 2013.
6. G.W. Nieman, J.R. Weertman, R.W. Siegel, Nano-structured mater.,1992, 1, 185.
7. R.O. Hughes, S.D. Smith, C.S. Pande, H.R. Johnson, R.W. Armstrong, Scripta Metall., 1986, 20, 93.
8. A.M. El-Sherik, U. Erb, G. Palumbo, K.T. Aust, Scripta Metall. Et Mater., 1992,
27, 1185.
9. R.Z. Valiev, A.V. Korznikov, R.R. Mulyukov, Mater Sci. Eng., 1993, A168, 141.
10. R.W. Siegel, G.E. Fougere, Nano-structured Mater., 1995, 6, 205.
11. P.G. Sanders, C.J. Youngdhal, J.R. Weertman, Mater. Sci. Eng., 1997, A234-236,
77.
12. V.Y Gertsman, M. Hoffman, H. Gleiter, R. Birringer, Acta Metall., 1994, 42,
3539.
13. U. Erb, NanoStructured Mater., 1995, 6, 533.
14. C.S. Pande, R.A. Masumura, R.W. Armstrong, Nanostuct. Mater., 1993, 2, 323.
16. R.L. Coble, J. Appl. Phys., 1963, 34, 1679.
17. H.Van Swygenhoven, M. Spaczer, A. Caro, Acta. Mater.,1999, 47, 3117.
18. A.H. Chokshi, A. Rosen, J. Karch, H. Gleiter, Scripta Metall., 1989, 23, 1679.
19. G.E. Fougere, J.R. Weertman, R.W. Siegel, NanoStructured Mater., 1993, 3, 379.
20. J.R. Weertman, P.G. Sanders, Solid State Phenomena, 1994, 35-36, 249.
21. P.G. Sanders, G.E. Fougere, L.J. Thompson, J.A. Eastman, J.R. Weertman, NanoStructured Mater., 1997, 8, 243.
22. H. Gleiter, Progress in Mats. Sci., 1989, 33, 223.
23. G.W. Nieman, J.R. Weertman, R.W. Siegel, J. Mater. Res., 1991, 6, 1012.
24. P.G. Sanders, J.A. Eastman. J.R. Weertman, Acta Mater. 1997, 45, 4019.
25. T. D. Shen, C. C. Koch, T.Y. Tsui, G.M. Pharr, J. Mater. Res., 1995, 10, 2892.
26. C. C. Koch, J. Metastable and Nanocrystalline Mat., 2003, 18, 9.
27. B. Gunther, A. Baalmann, H. Weiss, MRS Symp. Proc., 1990, 195, 611.
28. M. Legros, B.R. Elliot, M.N. Ritner, J.R. Weertman, K.J. Hemker, Phil. Mag., 2000, A80, 1017.
29. H. Tanimoto, S. Sakai, H. Mizubayashi, NanoStructured Mater., 1997, 9, 751.
30. E. Bonetti, L. Pasquini, E. Sampaolesi, NanoStructured Mater., 1997, 9, 611.
31. D. Jia, K.T. Ramesh, E. Ma, Ultrafine Grained Materials, ed. R.S. Mishra, S.L. Semiatin, C. Suryanarayana, N.N. Thadani, T.C. Lowe, TMS, Warrendale, PA, 2000, p.309.
32. F. Ebrahami, Q. Zhai, D. Kong, Scripta Mater., 1998, 39, 315.
33. O.V. Mishin, V.Y. Gertsman, R.Z. Valiev. G. Gottstein, Mater. Sci. For., 1998,
34. R.Z. Valiev, I.V. Alexandrov, Y.T. Zhu, T.C. Lowe, J. Mater. Res., 2002, 17, 5.
35. Y.M.Wang, E. Ma, M.W. Chen, Appl. Phys. Lett., 2002, 80, 2395.
36. A. Vingradov, V. Patlan, Y. Suzuki, K. Kitagawa, V.I. Kopylov, Acta Mater., 2002, 50, 1639.
37. N. Wang, Z. Wang, K.T. Aust, U. Erb, Mater. Sci. Eng., 1997, A237, 150.
38. A.F. Zimmerman, G. Palumbo, K.T. Aust, U. Erb, Mater. Sci. Eng., 2002, A328,
137.
39. F. Ebrahami, Z. Ahmed, K.L. Morgan, MRS Symp. Proc., 2001, 634, p. B2.7.1.
40. A.A. Karimpoor, U. Erb, K.T. Aust, Z. Wang, G. Palumbo, J. Metastable and Nanocrystalline Mater., 2002, 13, 415.
41. J. Wang, C. Xu, Z. Zhang, X. Zhao, L. Wang, T.G. Langdon, Ultrafine Grained Materials II, ed. Y.T. Zhu, T.G. Langdon, R.S. Mishra, S.L. Semiatin, M.J. Saran, T.C. Lowe, TMS, Warrendale, PA, 2002.
42. N. Tsuji, Y. Ito, Y. Koizumi, Y. Minamino, Y. Saito, Ultrafine Grained Materials II, ed. Y.T. Zhu, T.G. Langdon, R.S. Mishra, S.L. Semiatin, M.J. Saran, T.C. Lowe, TMS, Warrendale, PA, 2002, p. 389.
43. X. Zhang, H. Wang, R.O. Scattergood, J. Narayan, C.C. Koch, Appl. Phys. Lett., 2002, 81, 823.
1.4 Ball indentation test
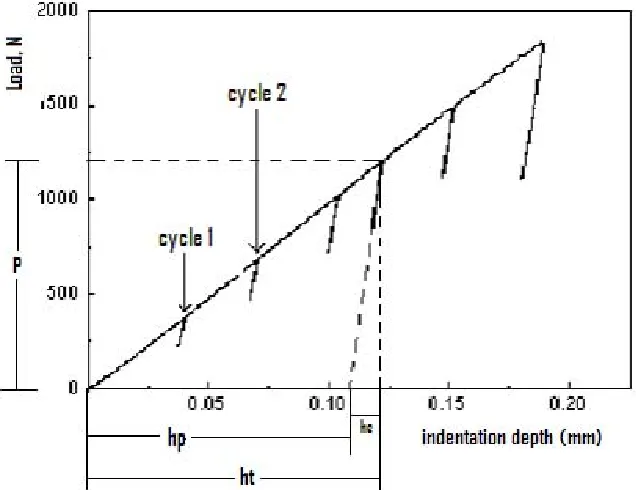
Most nanostructured material processing techniques yield material in limited quantities. Ball milling, used in this project for synthesis of UFG/nanostructured material, also produces material in limited quantity. In such cases there is a concomitant need to develop/modify techniques for material characterization such that reliable data can be obtained from the small samples. The ball indentation test is one such small-specimen test technique that involves multiple indentations on a specimen surface by a spherical indenter at the same penetration location. A typical ball indentation test process involves repeated loading, unloading and reloading cycles as shown in Fig. 12. Fig. 13 shows the schematic of the ball indentation test. The load and indentation depth are continuously measured during the test. These two parameters form the experimental raw data from which other mechanical parameters of importance like the plastic diameter, true stress, true strain, strain hardening exponent etc are derived using equations based on elastic-plastic analysis and semi empirical relationships. The sample for this test can be very small and multiple tests can be performed on a single specimen as long as the plastic zone of one indent does not overlap with plastic zone of neighboring indent.
stress and true plastic strain value. The true stress and plastic strain at multiple indents add to give the flow curve.
Fig. 12. Ball indentation test showing multiple indentation cycles.
The correlation between hardness and flow stress during spherical indentation was first clarified by Tabor in 1951 [1]. His calculations/explanations were based on three important premises: (i) Monotonic true stress-true plastic strain curves obtained from uniaxial tension and compression testing are reasonably similar. (ii) Indentation strain correlates with true plastic strain in tensile test. (iii) The hardness or mean indentation pressure correlates with the true stress in tensile test. Tabor defined the mean indentation pressure (σmean) as
2 4 p mean d P π
σ = (2)
where P is the applied load and dp is the plastic diameter of the indent. Plastic diameter was (dp) involved in the calculation because the final parameter derived was true stress. The plastic diameter was determined by optical measurement. Tabor then defined the true stress (σtrue) as the mean indentation pressure divided by a factor ψ (3). The ψ value was found to be equal to 2.8 for fully plastic indentations.
⎟⎟ ⎠ ⎞ ⎜⎜ ⎝ ⎛ = = ψ π ψ σ σ 1 4 2 p mean true d P (3)
To obtain indentation plastic strain (ε), Tabor normalized the plastic diameter (dp) by the diameter of the spherical indenter (D). Further, in order to correlate the indentation plastic strain with the tensile plastic strain a factor of 0.2 (independent of the material type) was introduced. Thus indentation plastic strain is given as
D dp 2 . 0 =
Francis [2] made notable additions to Tabor’s work and developed further functional relationships to convert the mean indentation pressure into true flow stress. Based on a statistical analysis he determined that the parameter ψ, introduced in Tabor’s work (3) was a continuous function of the size and development of the plastic zone surrounding the indentation. Francis’s work [2] coupled with some minor changes proposed by Haggag et. al. [3] gives the following equation.
27 27 1 1 87 . 2 0.53ln 1.12 12 . 1 > φ ≤ φ < ≤ φ ⎪ ⎩ ⎪ ⎨ ⎧ α φ + =
Ψ (5)
The parameter φ was determined to be a function of indentation plastic strain (ε), true stress (σtrue) and samples elastic modulus (Es), see equation (6). α is a constraint parameter that was introduced by Haggag et. al. [3]. There are three stages of development for the plastic zone beneath the indentation that govern the parameter ψ and are expressed analytically in equation (5). These are (i) the nucleation of the plastic zone during yielding, (ii) development of the zone with increasing size as a function of φ and (iii) full establishment of plasticity around the indentation as the zone is well developed and envelopes the indentation.
true s E σ ε φ 43 . 0
= (6)
It should be noted that the equation for true stress (3) involves the parameter ψ.
Haggag [4,5] made further important developments in the ball indentation test technique. He suggested a Hertzian equation (7) that would convert the indentation depth (can be experimentally measured) into plastic indentation diameter [4]. This would avoid the earlier method that involved tedious optical measurements to obtain the plastic indentation diameter. Note that to solve for plastic indentation diameter in equation (7) we would require iterative calculations.
(
)
(
)
3 1 2 2 * 2 2 ) 2 ( ) 2 ( 3 ⎥ ⎥ ⎦ ⎤ ⎢ ⎢ ⎣ ⎡ − + + = D h d h E d h PD d p p p p pp with ⎥
⎦ ⎤ ⎢ ⎣ ⎡ + = 2 1 * 1 1 91 . 0 1 E E
E . (7)
E is the elastic modulus and the subscripts 1 and 2 refer to the indenter and the test material respectively. During the load vs. depth characteristic in a spherical indentation process there are varying proportions of plastic and elastic strains associated with the load. To obtain the plastic indentation depth (which governs plastic diameter, which in turn governs true stress) Haggag [4] suggested a partial unloading technique. Partial unloading of the load to a level above the frictional effects creates a straight line on the load vs. depth plot (see Fig. 12). This straight line can be extrapolated to zero load to obtain the plastic indentation depth.
2 2 − ⎟ ⎠ ⎞ ⎜ ⎝ ⎛ = m D d A d P (8)
Here the constants m and A are the Meyers coefficient and the value of hardness when d/D is equal to 1. George in his analysis used the idea proposed by Hyott [7] who interpreted the parameter A in equation (8) as the measure of the resistance offered by the metal during initial penetration. He then was able to correlate yield strength (for a given material) to the parameter A by multiplying it with a constant (see equation (9)). The constant k was estimated from the slope of the line obtained by plotting yield strengths (derived from uniaxial tests for various orientations and rolling conditions) vs. their parameter A.
kA
yield =
σ (9)
The definition of strain rate and its effect on the ball indentation test was first discussed by Chi-Hung Mok [8]. He realized that ball indentation strain rate was directly proportional to the crosshead velocity. An equation was derived for ball indentation strain rate starting from Tabors equation (4) for true plastic strain. Differentiating equation (4) with respect to time gives
⎟⎟ ⎠ ⎞ ⎜⎜ ⎝ ⎛ = dt dd D dt
dε 0.2 p
(10)
Fig. 14. Geometry during indentation.
From Fig. 14, applying geometry we get
2 1 2 2 2 2
2 ⎥⎥⎦
⎤ ⎢ ⎢ ⎣ ⎡ ⎟⎟ ⎠ ⎞ ⎜⎜ ⎝ ⎛ − ⎟ ⎠ ⎞ ⎜ ⎝ ⎛ −
= D D dp
h (11)
Crosshead velocity (v) can be defined as time derivative of plastic indentation depth. So differentiating equation (11) with respect to time we get
⎟⎟ ⎠ ⎞ ⎜⎜ ⎝ ⎛ ⎥ ⎥ ⎦ ⎤ ⎢ ⎢ ⎣ ⎡ ⎟⎟ ⎠ ⎞ ⎜⎜ ⎝ ⎛ − ⎟⎟ ⎠ ⎞ ⎜⎜ ⎝ ⎛ = = − dt dd D d D d dt dh
v p p p
2 1 2 1
2 (12)
Substituting equation (12) into equation (10) we get an expression for strain rate as follows. 2 p p D d 1 d v 5 2 ⎟⎟ ⎠ ⎞ ⎜⎜ ⎝ ⎛ − =
ε& (13)
(
)
(
)
3 1 2 2 * 2 2 ) 2 ( ) 2 ( 3 ⎥ ⎥ ⎦ ⎤ ⎢ ⎢ ⎣ ⎡ − + + = D h d h E d h PD d p p p p pp with
2 2 2 1 2 1 * 1 1 1 E E E υ υ − + −
= (14)
ν is the Poisson ratio and the subscripts 1 and 2 refer to the indenter and the test material
respectively.
Ψ
= 42
p d P π σ , , 27 27 1 1 87 . 2 0.53ln 1.12 12 . 1 > φ ≤ φ < ≤ φ ⎪ ⎩ ⎪ ⎨ ⎧ α φ + = Ψ σ ε = φ 43 . 0 E2 p
(15) D dp p 2 . 0 =
ε (16)
References
1. D. Tabor, The Hardness of Metals, Clarendon Press, Oxford, 1951.
2. H.A. Francis, Transactions of ASME: Journal of Engineering Materials and Technology, July 1976, p. 272.
3. F.M. Haggag, G.E. Lucas, Metallurgical Transactions A, 1983, vol. 14, p. 1607-1213.
4. F.M. Haggag et.al., Innovative Approaches to Irradiation Damage and Fracture Analysis ASME PVP V.170, American Society of Mechanical Engineers, 1989, p. 101-107.
7. S.L. Hoytt, Transactions of the American Society for Steel Treating, 1924, vol. 6, p. 396-420.
CHAPTER 2
EXPERIMENTAL PROCEDURES
2.1 Ball Milling
Fig. 1. Spex shaker mill used for ball milling.
Fig. 3. Nylon vial containers used for cryo-milling.
2.2 Material
Two types of zinc powders were used for milling: Zn-A and Zn-B. Zn-A was procured from ALFA- AESAR with 99.9% purity. The initial oxygen content (as measured by a LECO process at NSL Analytical Services Inc.) was 0.15 at %. Fig. 3 shows an SEM micrograph of the Zn-A powders before milling.
Zn-B was procured from China by X. Zhang (former PhD student in our research group). Zn-B was 99.999% pure. The initial oxygen content was 1.68 at%. Fig. 5 shows an SEM micrograph of the Zn-B powders before milling.
Fig. 5. SEM micrograph of Zn-B.
2.3 Characterization techniques
The milled Zn was characterized using X-ray and TEM studies. X-ray diffraction patterns were obtained with a Rigaku Geigerflex diffractometer. The average grain size from X-ray peak broadening data was calculated using the Scherrer formula [1] and the Hall-Williamson analysis [2]. The Scherrer formula is given by
d = 0.9λ/βcosθ (1)
inverse of the y-intercept obtained by a linear fit of the plot between βcosθ/ λ and sinθ/ λ.
The slope gives the strain.
TEM studies were carried out using Topcon EM 002B and JEOL 2010F. TEM samples were prepared by mechanical polishing (until thickness = 80 µm) and subsequent electrolytic thinning. A Fischione twin jet polisher with 50% ethanol and 50% phosphoric acid, as the solution, was used for electrolytic thinning.
2.4 Mechanical testing
Ball Indentation Test
The UTS machine was specifically programmed by the author to carry out the loading, unloading and reloading cycles associated with the ball indentation test. The ball indentation experiment then gives a load vs. indentation depth plot (see Fig. 12, chapter 1). The indentation depth (hp) was calculated by extrapolating the partially unloaded line to zero load for each cycle. The equations (14), (15) and (16) in chapter 1 were then used to calculate plastic indentation diameter (dp), true stress (σ) and true plastic strain (εp). The equations for plastic diameter and true stress are intrinsic equations and require iterative calculations. To solve these equations programs were written and executed in C language. The true stress-true plastic strains thus obtained were plotted to obtain the flow curve. In some cases where the ball indentation data was correlated to the tensile test, consistent adjustments and reanalysis of the ball indentation data was done by adjusting the constraint factor (α) in equation (15), chapter 1. These adjustments were made keeping the α parameter constant for a particular class of materials. In all cases multiple tests were done to check for reproducibility. In cases where the tensile data was unavailable to correlate with the ball indentation data (like in the case of nanostructured zinc), α was assumed to be equal to 1. This choice would suffice to investigate effects such as strain hardening and strain rate sensitivity albeit the absolute magnitudes of strengths may not be the same as obtained from tensile tests.
References
1. A. Guinier, X-Ray Diffraction, W.H. Freeman, San Francisco, California, 1963, p. 121.
CHAPTER 3
Standardization of the ball indentation test and influence of
experimental parameters on the evaluated plastic flow curve
3.1 Abstract
When available material for testing is limited the techniques for material characterization need to be modified such that reliable data is obtained from small samples. The ball indentation (BI) test is one such technique. BI tests were performed on various steels, aluminum 6061 and pure Zn using a computer-controlled screw driven universal testing machine (UTM). The plastic diameters of the impressions were obtained by partial unloading and compared with plastic diameters obtained by complete unloading, and optical measurement. BI tests were compared to conventional tensile tests and the influences of the experimental parameters on the flow curve are discussed. Once the correlation was obtained on these materials, the technique can be used to characterize the mechanical properties of materials where standard tensile tests cannot be performed.
Keywords: indentation, tensile strength, plastic flow, true stress, true strain
3.2 Introduction
can be performed on a single specimen as long as the plastic zone of one indent does not overlap with plastic zone of neighboring indent. This chapter discusses the design, methodology and standardization of the ball indentation test technique. The theoretical background necessary for the BI methodology is briefly described. The influence of fixture compliance and indenter ball size on the plastic flow curve is discussed. The BI results are correlated with tensile test data for various steels, Al-6061 and pure Zn. BI test is also used to evaluate effect of strain rate in case of pure Zn.
3.3 BI methodology
![Fig. 1. Schematic illustration of the (a) SPTS and (b) ECAP technique [15].](https://thumb-us.123doks.com/thumbv2/123dok_us/1350238.1167907/32.612.188.436.101.307/fig-schematic-illustration-spts-b-ecap-technique.webp)
![Fig. 2. Schematic of the process during milling [8].](https://thumb-us.123doks.com/thumbv2/123dok_us/1350238.1167907/38.612.232.415.75.219/fig-schematic-process-milling.webp)
![Fig. 8. Hall-Petch plot of electrodeposited Ni showing a negative slope atlower grain sizes [13]](https://thumb-us.123doks.com/thumbv2/123dok_us/1350238.1167907/49.612.189.409.95.308/hall-petch-electrodeposited-showing-negative-slope-atlower-grain.webp)