Report No. 427
EVALUATING PATHOGEN REMOVAL IN STORMWATER BMPS
By
Jon Hathaway, William F. Hunt
Department of Biological and Agricultural Engineering
North Carolina State University
UNC-WRRI-427
The research on which this report is based was supported by funds provided by the Urban Water
Consortium-Stormwater Group through the Water Resources Research Institute.
Contents of this publication do not necessarily reflect the views and policies of the Urban Water
Consortium-Stormwater Group or the Water Resources Research Institute, nor does mention of
trade names or commercial products constitute their endorsement by the State of North Carolina.
Evaluating Pathogen Removal in Stormwater BMPs
Final Report
November 2010
Prepared By:
Jon Hathaway, PE and William F. Hunt PE, PhD
Department of Biological and Agricultural Engineering
Submitted To:
Executive Summary
Microbial quality in surface waters is a concern across the United States due to human reliance on surface waters for food, recreation, and other life sustaining activities. Although pathogens are of utmost concern, indicator bacteria are typically used for regulatory purposes to indicate the presence of fecal matter, and thus the possible existence of pathogens. Total Maximum Daily Loads (TMDLs) are established for surface waters impacted by excessive indicator bacteria.
Analyses are required to categorize sources of indicator bacteria, and a plan is developed to restore water quality in the impacted water by way of various management/control practices. Stormwater runoff has been shown to have high indicator bacteria concentrations, contributing to microbial degradation in surface waters.
Stormwater runoff is typically managed by implementation of SCMs. Although SCMs have been shown to sequester numerous pollutants, relatively little is known regarding their ability to sequester indicator bacteria. The effectiveness of SCMs in Wilmington, NC, was examined. Differences in performance were noted between SCMs studied in Wilmington, NC, and those
studied in Charlotte, NC, by Hathaway et al. (2009). Differences are potentially due to variations in particle association of indicator bacteria between the relatively clayey soils in Charlotte, NC, and the sandy soils in Wilmington, NC. High water tables in Wilmington, NC, likely also
influenced results, particularly for wet ponds, where dilution of stormwater runoff due to groundwater intrusion was likely. Although some SCMs showed statistically significant
reductions of indicator bacteria (p < 0.05), some SCMs appeared to export indicator bacteria. These data suggest SCMs do possess treatment mechanisms which are effective at sequestering indicator bacteria; however, an environment may be present in some SCMs which allows indicator bacteria to persist and/or regrow. In general, bioretention has shown fairly consistent sequestration of indicator bacteria in locations throughout North Carolina. Further,
infiltration-based SCMs offer some advantage, as mass removal of indicator bacteria can be realized through infiltration of runoff into subsoils.
Further study is needed to determine the impact of infiltrated stormwater on groundwater
constructed similarly and employing similar mechanisms of pollutant removal (wetland, wet
ponds, etc.) exhibited varied performance for indicator bacteria in both this study and others in literature. More research is needed to determine why such variability is present. For instance, stormwater wetlands were shown to perform well in Charlotte, NC, but not Wilmington, NC. Although inferences can be made as to the cause behind these differences in performance, a refined understanding of microbial processes in these systems would allow a greater
understanding of potential design modifications to SCMs which may lead to improved
performance. If no such design modifications are possible, SCMs equipped with different or new treatment mechanisms may be required to treat microbes in stormwater runoff.
For the Wilmington, NC, SCMs, effluent indicator bacteria concentrations were observed to vary
seasonally, although no significant relationships could be found (p < 0.05). Trends were apparent for both E. coli and enterococci for all but one SCM. The geometric mean effluent enterococci concentration was slightly higher during the non-swimming season for one wetland. These data suggest the potential for variations in indicator bacteria export from SCMs during
warmer seasons. Such seasonal differences, if present, must also be considered in microbial TMDLs. However, due to the lack of statistically significant relationships identified in these data, additional study is needed to verify the trends identified herein. Additional research should also be focused toward determining if these apparent differences in effluent indicator bacteria concentrations are due to elevated influent concentrations or poorer sequestration of indicator
bacteria during warmer months.
A paired watershed study in Wilmington, NC, showed differing performance between two bioretention cells constructed with varied media depth. Differences in function were potentially attributable to numerous factors, including differences in soil temperature, soil moisture, soil
chemistry, and soil physical properties. These factors were evaluated, with the only notable differences between the cells being variedmedia depth and a slightly warmer and moister environment in the shallow bioretention area. The differences in temperature and moisture were not considered substantial enough to result in such dramatic differences in performance.
reduced hydraulic contact time, and possibly stripping of bacteria from the soil matrix. For
bioretention cells, a minimum soil media depth appears to exist, below which poor
sequestration of indicator bacteria may occur due to high soil water flux and low contact time.
Soil water flux appears to be an important consideration during bioretention design. Although an increase in soil media depth is one option for decreasing soil water flux, other design options
may provide similar results. A reduction in ponding depth, and subsequent increase in surface area, will also lead to decreased soil water flux. Stormwater may also be slowed in bioretention areas by decreasing infiltration rate. This may be accomplished by increasing the content of fines within bioretention media. Increasing the percentage of fines may also lead to increased sorption of indicator bacteria. Thus, more shallow media depths may be possible provided the
soil media utilized has a higher fraction of fine soils (clay and silt). However, such modification to soil media will also result in decreased hydrologic efficiency. Thus, the trade-off between
indicator bacteria sequestration and hydrologic efficiency should be carefully considered. These design options should be explored in future research.
Related Documents
This report is a compilation of two manuscripts and a doctoral dissertation which were generated using data collected during the process of this study. Portions of this report may be published in the following documents:
• Hathaway, J.M., and W.F. Hunt. (in review). “Indicator bacteria performance of stormwater control measures in Wilmington, NC” Journal of Irrigation and Drainage Engineering.
• Hathaway, J.M., W.F. Hunt, A.K. Graves, and J.D. Wright. (in preparation). “Field evaluation of bioretention sequestration of indicator bacteria in Wilmington, NC”
Table of Contents
1 Indicator Bacteria Performance of Stormwater Control Measures in Wilmington, NC 8
Abstract ... 8
Introduction ... 8
Materials and Methods ... 4
1.1.1 Site Descriptions ... 4
1.1.2 Monitoring Methods ... 8
1.1.3 Statistical Evaluations ... 9
Results and Discussion ... 10
1.1.4 Summary Statistics ... 10
1.1.5 Concentration Reduction ... 12
1.1.6 Influent and Effluent Probability Plots ... 16
1.1.7 Analysis of Effluent Concentrations ... 18
1.1.8 Seasonal Impacts on SCM Effluent Concentrations ... 20
Conclusions ... 23
Acknowledgements ... 25
References ... 26
2 Analysis of Factors Influencing Bioretention Performance for Indicator Bacteria in Wilmington, NC ... 29
Abstract ... 29
Introduction ... 29
Materials and Methods ... 32
2.1.1 Site Descriptions ... 32
2.1.2 Monitoring Methods – Flow and Rainfall Monitoring ... 34
2.1.3 Monitoring Methods – Indicator Bacteria Monitoring ... 35
2.1.4 Monitoring Methods – Physical Measurements ... 35
2.1.5 Monitoring Methods – Soil Bacteria Analysis ... 37
2.1.6 Statistical Evaluations ... 38
Results and Discussion ... 38
2.1.7 Bioretention Performance for Indicator Bacteria ... 38
2.1.9 Worm Hole Presence ... 44
2.1.10 Soil Temperature and Moisture ... 44
2.1.11 Soil Properties... 47
2.1.12 Soil Indicator Bacteria ... 48
2.1.13 Synthesis of Data and Design Implications ... 51
Conclusions ... 53
Acknowledgements ... 53
References ... 54
A. Appendix A: Bioretention performance for indicator bacteria in Raleigh, NC ... 58
1
Indicator Bacteria Performance of Stormwater Control Measures in Wilmington,
NC
Abstract
Indicator bacteria are a common source of impairment in surface waters in the United States.
Urban stormwater runoff has been identified as a contributor to elevated indicator bacteria concentrations. Six Stormwater Control Measures (SCMs) were monitored in Wilmington, NC, for Escherichia coli (E. coli) and enterococci. Monitored SCMs included two stormwater wet ponds, two bioretention cells, and two stormwater wetlands. Sandier watersheds in Wilmington potentially lead to differences in SCM performance for indicator bacteria compared to SCMs
implemented in clayey watersheds. Results showed E. coli and enterococci concentration reductions between 70 and 98% for the two wet ponds and a bioretention cell with a 60 cm deep fill media. Other SCMs showed poor removal of indicator bacteria, in some cases negative, with stormwater wetlands performing the poorest overall for the three SCM types. Further
analysis showed that SCMs with high concentration reductions tended to have geometric mean effluent concentrations lower than the United States Environmental Protection Agency’s (USEPA) target surface water concentration for E. coli. Conversely, no SCM had a geometric mean effluent enterococci concentration lower than the USEPA target value. SCM geometric mean effluent concentrations were typically higher during North Carolina’s swimming season
between the beginning of April and the end of October, although no statistically significant relationship could be found (p < 0.05). Despite a lack of statistically significant relationships, the potential for higher effluent indicator bacteria concentrations from SCMs during the peak recreational season may have implications for both public health and watershed management and should be further evaluated by the scientific community.
Introduction
Surface waters in the United States are commonly placed on the Environmental Protection Agency’s (USEPA) 303(d) list due to impairment by pathogens (indicator bacteria) (USEPA, 2008).
P a g e
Typically, stormwater runoff mitigation involves the use of Stormwater Control Measures (SCMs – also known as Best Management Practices or “BMPs”). SCMs have been shown to effectively reduce numerous types of pollutants, yet their ability to remove indicator bacteria and
pathogens is still under evaluation. Studies have indicated variable performance of SCMs for indicator bacteria from storm to storm and based on SCM type (Hathaway et al. 2009, Krometis
et al. 2009, Passeport et al. 2009, Li and Davis 2009, Birch et al. 2004, Davies and Bavor 2000, Mallin et al. 2002). Evaluations of indicator bacteria removal in SCMs have typically been performed on data sets with less than 10 samples. Other than Hathaway et al. (2009), studies with more than 10 data points have collected samples at a predetermined time interval (monthly, biweekly, etc), and thus did not isolate SCM performance during storm flow.
Indicator bacteria are of particular concern in coastal areas, where human exposure can occur during recreational activities or consumption of shellfish (USEPA 2001). Such human health concerns have economic implications for the tourism and commercial fishing industries. Despite
the need for microbial controls in coastal areas, few evaluations have been performed for stormwater wetlands, wet ponds, and bioretention areas in watersheds with similar
characteristics to those of watersheds in the coastal Southeastern United States. In particular, limited data are present with regard to SCM removal and sequestration of enterococci, which is recommended for use as an indicator species in coastal areas and potentially has different
survival characteristics than other indicator bacteria species in the environment (USEPA 2001). Only two field studies could be found in scientific literature where either a stormwater wetland or bioretention area was monitored for enterococci sequestration and removal (Davies and Bavor 2000, Jones et al. 2008)
Coastal areas in the Southeastern United States are characterized by sandy soils. This may lead to differences in SCM microbe removal efficiency. For instance, the percentage of incoming microbes attached to sediment may vary from that in clayey watersheds, as microbes predominately attach to smaller particles (Davies and Bavor 2000). Krometis et al. (2009)
P a g e
(Sherer et al. 1992). Thus, SCMs receiving runoff with a small amount of particle associated
bacteria may perform differently than those which receive high amounts of particle associated bacteria. Resuspension of captured microbe-particle colloids may also be possible in SCMs. Microbes have been shown to persist in stream and estuary sediments, where a similar environment to that found in SCMs may be present (Sherer et al. 1992, Jeng et al. 2005).Thus, scour or resuspension of sediments in SCMs during storm events may also resuspend microbes.
This is specifically a concern in wet ponds and stormwater wetlands. Larger particles, such as sands, have a greater resistance to resuspension, potentially leading to reduced loss of particle associated bacteria from SCMs in sandy watersheds.
Bioretention is increasingly being used as part of Low Impact Development strategies in coastal
areas. Bioretention performance for indicator bacteria has been evaluated primarily for systems constructed with media consisting of some combination of organic matter, fine particles, and sand or expanded slate fines. However, design specifications for bioretention fill media are typically focused on hydraulic efficiency (i.e., infiltration rate). Thus, it is possible that in-situ
soils would be used as bioretention fill media in watersheds containing sandy soils. These potential fill soils have not been tested for indicator bacteria removal when used in bioretention designs. Although there has been some field evaluation performed on bioretention areas for indicator species removal by Hathaway et al. (2009), Li and Davis (2009), Dietz and Clausen (2005), and Passeport et al. (2009), no field evaluation has been performed on bioretention for
enterococci other than a study in New England by Jones et al. (2008).
Another concern for management of surface waters is the variation observed in stormwater indicator bacteria concentrations based on season and temperature. Hathaway and Hunt (in review), Selvakumar and Borst (2006), and McCarthy et al. (2007) all showed higher indicator
bacteria concentrations in stormwater runoff during warm seasons/temperatures. Such
conditions coincide with peak recreational use of surface waters. In TMDL guidance provided by the USEPA, seasonal variations must be taken into account for microbial TMDLs (USEPA 2001).
P a g e
two bioretention areas by Li and Davis (2009) observed the highest influent Escherichia coli (E.
coli) and fecal coliform concentrations during the summer; however, removal efficiency could not be correlated to temperature. There are public health implications for such information, as SCM efficiency may change throughout the year. Thus, watershed plans which apply one indicator bacteria removal percentage to a given SCM (i.e., not adjusted seasonally) may misrepresent the benefit of implementing such SCMs.
The objectives of this study were to build upon the current understanding of indicator removal in SCMs by: (1) evaluating the performance of SCMs implemented in sandy, coastal watersheds for both E. coli and enterococci, and (2) evaluating the influence of seasonality on SCM effluent concentrations and removal of indicator bacteria.
Materials and Methods 1.1.1 Site Descriptions
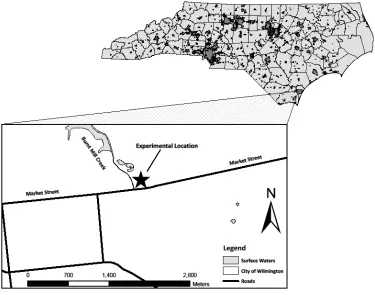
The experimental sites were located in Wilmington, North Carolina (Figure 5.1). Six SCMs were
evaluated, including two wet ponds, two bioretention areas, and two stormwater wetlands. Samples were collected between January 2008 and February 2010. General SCM characteristics are given in Table 5.1. Soils in the watersheds contributing to the SCMs were typically either hydrologic group A or B (sands and fine sands).
Wet Pond 1 was located in a residential medium density neighborhood with a watershed area of approximately 7 ha (Figure 5.2a). The wet pond had poor vegetative growth around its
perimeter and had a sinuous pathway between the inlet and outlet. Wildlife was not readily observed around the pond, and fencing around the pond likely restricted access from domestic animals. Wet pond 2 serviced a cinema parking lot and the surrounding area (Figure 5.2b). The
watershed was approximately 15 ha. The wet pond had minimal vegetative growth along its perimeter and grass was manicured to the pond edge. Water fowl were noted at the site on occasion, but never in large quantity. Wet Pond 2 exhibited submergence at the outlet, leading to increased normal pool depth, but decreased storage depth relative to the design
P a g e Table 1.1: General characteristics of Wilmington SCMs
Characteristic Wet Pond 1
Wet Pond
2 Bioretention-D Bioretention-S
Wetland 1 Wetland 2 Approximate Year Constructed
1999 1996 2006 2006 2005 2006
Drainage Area
(ha) 7.6 14.8 0.10 0.05 12.7 2
Watershed Composition Multi Family Residential (primarily duplex lots)
Commercial Commercial (parking lot) Commercial (parking lot) Municipal (school) Multi-family Residential Estimated
Imperviousness 45% 81% 100% 100% 20 % 42%
Primary Surrounding Soil Type (hydrologic group)1 Lynn Haven fine sand (B/D) and Seagate fine sand (B) Seagate fine sand (B) Baymeade fine sand (A) Baymeade fine sand (A) Leon Sand (B/D) Baymeade fine sand (A) Surface Area
(ha) 0.18 0.59 0.006 0.006 0.1 0.09
Surface Area: Drainage Area
Ratio
0.02 0.04 0.06 0.12 0.01 0.05
Storage Depth
(cm) 46
52 (actual lower due backwater in
effluent pipe)
28 28 31
> 15 (due to well infiltrating soils) Estimated Average Depth (cm)
198 168 602 252 7
17 (typically less due to
well infiltrating
soils) 1. NRCS 2010 – Soil Data Mart (http://soildatamart.nrcs.usda.gov/)
P a g e
(a) (b)
(c) (d)
(e)
Figure 1.2: Illustrations of SCMs: (a) Wet Pond 1, (b) Wet Pond 2, (c) Bioretention-D and Bioretention-S, (d) Wetland 1, and (e) Wetland 2
The two bioretention areas were located within the same parking lot which serviced a coffee shop (Figure 5.2c). A paired watershed design was sought, with each bioretention having a similar footprint, but watershed area differed due to microtopography within the parking lot.
P a g e
one with a soil depth of 25 cm (Bioretention-S). All fill soil for the bioretention areas came from
on site sandy soils. Each cell was constructed with a 10-cm underdrain to facilitate sample collection. It should be noted that underdrains are not typically required for bioretention areas in the sandy soils of coastal areas, thus this design differs from standard practice in the region. Runoff entered each bioretention cell as sheet flow. A small flume was installed at the
pavement edge in a location presumed to be representative of the entire watershed. This
allowed some pooling of runoff as it entered the bioretention cell, facilitating sampling of the inlet. The bioretention areas were covered with turf grass and had a small number of shrubs.
Wetland 1 serviced a 2-ha watershed consisting of a multi-family residential housing complex (Figure 5.2d). The wetland was constructed in sandy soils and typically had standing water only
present in the deep pools. Therefore, the average depth of the system and ponding depth varied from design specifications. Wetland 2 serviced a 13-ha watershed containing a school and associated athletic fields (Figure 5.2e). Both wetlands were designed consistent with guidance by Hunt et al. (2008), including varied internal topography, emergent vegetation, and a design
surface area based on capturing the water quality event for Wilmington, NC (3.8 cm). Large storms overflowed both wetlands by large weirs installed at each outlet.
1.1.2 Monitoring Methods
Short hold times and the increased man-hours and technical difficulty of using automatic
samplers for microbial analyses led to the use of grab samples for SCM evaluations. This is a common methodology for sampling surface waters for indicator bacteria (USEPA 2002, Burton and Pitt 2002). All wet ponds and wetlands had one defined inlet and outlet. One sample set was collected from the inlet and outlet of each SCM for each storm event. Each sample set consisted of two sterile bottles to facilitate two bacteria analyses (E. coli and enterococci). Inlet
samples were collected for both bioretention areas from the inlet flume mentioned previously. Outlet samples were collected from each respective bioretention cell’s underdrain. There are valid concerns over the use of grab samples, as concentrations of a given pollutant may vary during the course of the storm. However, use of grab samples was necessary in this study, and
P a g e
Samples were transported to Tritest, Inc for analysis. Hold times were generally less than 6 hours. Samples were analyzed for both E. coli and enterococci. E. coli were enumerated using Colilert® and enterococci were enumerated using Enterolert®. Each methodology is based on the use of a defined substrate media (IDEXX Laboratories Inc., Westbrook, Maine). Sample dilutions were performed as needed to adequately characterize bacteria concentrations. The
Limit of Detection (LOD) was typically either 2 or 10 MPN / 100 ml depending on the dilution used. The Maximum Reporting Limit (MRL) was typically 24,196 MPN / 100 ml. The MRL for E. coli was typically higher than that of Hathaway et al. (2009), allowing a better overall estimation of functionality. Data are analyzed herein using the values at the reporting limit without
adjustment.
1.1.3 Statistical Evaluations
Statistical analyses were made to evaluate the performance of each SCM. Removal percentages (Concentration Reduction “CR”) were calculated for each SCM using a similar methodology to
that used to generate efficiency ratios (USEPA, 2002); however, event mean concentrations are necessary to generate efficiency ratios. This was not possible due to the use of single grab samples in this study, leading to the use of Equation 1.
ܥܴ = ൬1 −ܩ݁݉݁ݐݎ݅ܿ ܯ݁ܽ݊ ܱݑݐ݈݁ݐ ܥ݊ܿ݁݊ݐݎܽݐ݅݊ܩ݁݉݁ݐݎ݅ܿ ܯ݁ܽ݊ ܫ݈݊݁ݐ ܥ݊ܿ݁݊ݐݎܽݐ݅݊ ൰ × 100% (1)
Microbial water quality standards are concentration based. Thus, geometric mean effluent concentrations from each SCM were compared to water quality standards for E. coli and enterococci. Based on USEPA recommendations, geometric mean E. coli concentrations should not exceed 126 organisms / 100 ml over a 30-day period for fresh water designated as full body
recreational waters (USEPA 1986). Similar recommendations exist for enterococci, whereby geometric mean concentrations should not exceed 33 organisms / 100 ml for fresh waters or 35 organisms / 100 ml for marine waters over a 30-day period (USEPA 1986).
A non-parametric Wilcoxon Signed Rank test was used to determine differences among influent
P a g e
concentrations, which is important when data sets contain values below the MDL or above the
MRL. These analyses were supplemented with probability plots to evaluate the performance of each SCM over the entire range of influent concentrations. Probability was calculated using Equation 2 (Burton and Pitt 2002).
ܲ =(݅ − 0.5)݊ (2)
Where: P = probability of a given observation i = rank of observation within group n
n = number of observations within a given data set
Additional statistical analyses were performed to evaluate differences in influent and effluent concentrations based on season. Samples were categorized based on the dates considered by the North Carolina Division of Environmental Health (NCDEH) to be the “swimming season” and “non-swimming season” (NCDEH 2010). Swimming season is defined as the period between the
beginning of April and the end of October. SCM functionality may hold more importance during swimming season, as water-related recreation increases. Wilcoxon Rank Sum tests were used to statistically evaluate differences in effluent concentrations between swimming and
non-swimming seasons. Also, the difference in geometric mean effluent concentrations between the two seasons was calculated using Equation 3.
ܵ݁ܽݏ݈݊ܽ ܦ݂݂݅݁ݎ݁݊ܿ݁ = ൬1 −ܩ݁݉݁ݐݎ݅ܿ ܯ݁ܽ݊ ܱݑݐ݈݁ݐ ܥ݊ܿ݁݊ݐݎܽݐ݅݊ (݊݊ − ݏݓ݅݉݉݅݊݃)൰ × 100%ܩ݁݉݁ݐݎ݅ܿ ܯ݁ܽ݊ ܱݑݐ݈݁ݐ ܥ݊ܿ݁݊ݐݎܽݐ݅݊ (ݏݓ݅݉݉݅݊݃) (3)
Results and Discussion 1.1.4 Summary Statistics
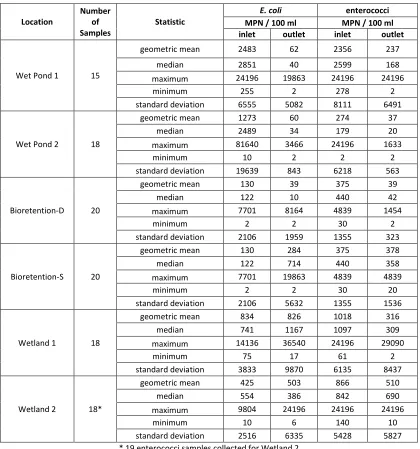
Between 15 and 20 storms were sampled for each SCM between January 2008 and February 2010. Summary statistics for these data are presented in Table 5.2. Samples were fairly well distributed throughout the seasons, with storm sizes ranging from 0.8 to 12.8 cm. The median
P a g e
more scour and decrease detention time in SCMs, these data are likely conservative estimates of
SCM function. There is some concern that large storms may dilute indicator species, resulting in decreased influent concentrations; however, McCarthy et al. (2007) and Hathaway and Hunt (in review) showed no significant correlation between indicator bacteria concentrations in urban stormwater runoff and storm size.
Table 1.2: Summary statistics for monitored storm events
Location
Number of Samples
Statistic
E. coli enterococci
MPN / 100 ml MPN / 100 ml inlet outlet inlet outlet
Wet Pond 1 15
geometric mean 2483 62 2356 237
median 2851 40 2599 168
maximum 24196 19863 24196 24196
minimum 255 2 278 2
standard deviation 6555 5082 8111 6491
Wet Pond 2 18
geometric mean 1273 60 274 37
median 2489 34 179 20
maximum 81640 3466 24196 1633
minimum 10 2 2 2
standard deviation 19639 843 6218 563
Bioretention-D 20
geometric mean 130 39 375 39
median 122 10 440 42
maximum 7701 8164 4839 1454
minimum 2 2 30 2
standard deviation 2106 1959 1355 323
Bioretention-S 20
geometric mean 130 284 375 378
median 122 714 440 358
maximum 7701 19863 4839 4839
minimum 2 2 30 20
standard deviation 2106 5632 1355 1536
Wetland 1 18
geometric mean 834 826 1018 316
median 741 1167 1097 309
maximum 14136 36540 24196 29090
minimum 75 17 61 2
standard deviation 3833 9870 6135 8437
Wetland 2 18*
geometric mean 425 503 866 510
median 554 386 842 690
maximum 9804 24196 24196 24196
minimum 10 6 140 10
standard deviation 2516 6335 5428 5827
* 19 enterococci samples collected for Wetland 2
P a g e
by Hathaway et al. (2009) and influent concentrations for one of two wet ponds studied in
Durham, NC, by Krometis et al. (2009). Geometric mean enterococci concentrations ranged from 274 to 2356, slightly higher than influent concentrations for SCMs studied by Jones et al. (2008), but lower than values reported for influent concentrations to wet ponds studied by Krometis et al. (2009).
1.1.5 Concentration Reduction
Concentration reductions for each SCM are documented in Tables 5.3 and 5.4. Highest E. coli reductions were observed for the wet ponds, which also had the highest influent
concentrations. Bioretention-D also performed well with a concentration reduction of 70%. Poor performance was noted for Bioretention-S and the two wetlands for E. coli, although both
wetlands had fair removal of enterococci. For each SCM, removal performance was variable from storm to storm. Individual event concentration reductions varied from greater than 90% to an addition of both E. coli and enterococci for most SCMs. Similar inter-event variations in SCM performance for indicator bacteria were showed for bioretention areas by Li and Davis (2009)
and for a stormwater wetland by Birch et al. (2004).
Table 1.3: E. coli concentration reductions for Wilmington SCMs
SCM Type
E. coli Concentrations (MPN/100ml) Geometric Mean Influent Geometric Mean Effluent Concentration Reduction (%)
Wet Pond 1 2483 62 98
Wet Pond 2 1273 60 95
Bioretention-D 130 39 70
Bioretention-S 130 284 -119
Wetland 1 834 826 1
Wetland 2 425 503 -18
Table 1.4: Enterococci concentration reductions for Wilmington SCMs
SCM Type
Enterococci Concentrations (MPN/100ml) Geometric Mean Influent Geometric Mean Effluent Concentration Reduction
Wet Pond 1 2356 237 90
Wet Pond 2 274 37 87
Bioretention-D 375 39 89
Bioretention-S 375 378 -1
Wetland 1 1018 316 69
P a g e
Results of a Wilcoxon Signed Rank analysis are shown in Table 5.5. Only the two wet ponds
significantly reduced E. coli (p < 0.05), while both wet ponds and Bioretention-D significantly reduced enterococci. Significant relationships can be difficult to find in microbial data sets given the inter-storm performance variability noted in these data and in other studies. Statistical analyses generally support the concentration reductions in Tables 5.3 and 5.4, as wet ponds and Bioretention-D were found to perform well.
Table 1.5: Results of Wilcoxon Signed Rank Analysis
Location
E.coli enterococci
p - value significant difference?
p - value
significant difference?
Wet Pond 1 0.0002 yes 0.0134 yes
Wet Pond 2 0.001 yes 0.001 yes
Bioretention-D 0.1926 no 0.0001 yes
Bioretention-S 0.0808 no 0.5459 no
Wetland 1 0.6095 no 0.1187 no
Wetland 2 0.6322 no 1 no
Wet ponds have shown varied levels of treatment for indicator bacteria. A study of two wet ponds in Durham, NC, by Krometis et al. (2009) yielded different results. One pond showed poor
performance with geometric mean concentration reductions of -41%, 0%, and -108% for fecal coliform, E. coli, and enterococci, respectively. The second pond showed modest removal, reducing geometric mean concentrations by 31%, 48%, and 36% for fecal coliform, E.coli, and enterococci, respectively. A study by Davies and Bavor (2000) on a wet pond near Sydney, Australia, showed similarly poor performance with fecal coliform and enterococci removal
efficiencies of -2.5% and 23%, respectively. In a study by Mallin et al. (2002), 2 of 3 wet ponds in Wilmington, NC, removed fecal coliform with an efficiency higher than 50%, with the third wetland showing negative removal. Positive removal of indicator bacteria was also reported by Hathaway et al. (2009) for a wet pond in Charlotte, NC, with concentration reductions of 70%
and 46% for fecal coliform and E. coli, respectively. Thus, from a removal efficiency metric, large variations in performance have been noted for wet ponds. Generally, performance for the wet ponds in Wilmington, NC, studied herein was good compared to studies in literature, and compared similarly to 1 of 3 wet ponds studied by Mallin et al. (2002) in Wilmington, NC, where a fecal coliform concentration reduction of over 85% was found. It should be noted that the
P a g e
97 organisms / 100 ml and 74 organisms / 100 ml, potentially influencing microbial removal
efficiency. Relatively poor performing wet ponds studied by Krometis et al. (2009) and Davies and Bavor (2002) potentially had different influent microbial particle association characteristics than those in Wilmington, NC, as finer soil types were likely present in their contributing watersheds. The soil types in the watersheds supplying runoff to the Wilmington, NC, SCMs were predominately fine sand. This may have implications for the amount of bacteria attached
to particles at the inlet and the likelihood of resuspension of captured sediments (and
associated bacteria) during subsequent events. Further, particle associated microbes have been shown to exhibit higher resistance to environmental conditions that otherwise cause their die-off (Sherer et al. 2002). Also, a high water table, characteristic of coastal areas in the
Southeastern United States, may have resulted in dilution due to groundwater intrusion into the
ponds. One of the two wetlands (Wetland 1) also intersected the groundwater table, but an improved performance was not evident.
Stormwater wetland indicator bacteria sequestration and removal has not been studied at
length in peer-reviewed literature. A study by Birch et al. (2004) showed mean fecal coliform removal of 76%. Davies and Bavor (2002) reported removal efficiencies of 79% and 85% for fecal coliform and E. coli, respectively. However, results for two wetlands in Charlotte, NC, studied by Hathaway et al. (2009) were variable. One wetland exhibited fecal coliform and E. coli removal of 98% and 96%, respectively, while the other showed fecal coliform and E. coli removal of 56%
and 33%, respectively. It should be noted that Hathaway et al. (2009) attributed high removal of indicator bacteria to a lack of vegetation in one of the wetlands, but vegetation deficiency is not a desirable attribute for stormwater wetlands. The results of studies in scientific literature generally indicate fair performance of stormwater wetlands for indicator bacteria. However, data from this research suggests poor performance of stormwater wetlands for E. coli removal,
and modest performance for enterococci.
Differences in microbial removal efficiency between stormwater wetlands and wet ponds are not well established. A comparison of stormwater wetland and wet pond performance by Davies
P a g e
less variable from site to site. For the SCMs studied in Wilmington, NC, as part of this study, wet
ponds appeared superior for removal of indicator bacteria. Numerous factors are likely
associated with removal of indicator bacteria in stormwater wetlands and wet ponds, including predation, settling of particle associated microbes, and potential resuspension of captured particle associated microbes due to internal SCM hydrodynamics. Thus, numerous variables are present in stormwater wetlands and wet ponds which may explain variations in performance.
Further research is needed to determine factors which contribute to the performance of these SCMs regarding microbe die-off.
Few field evaluations of indicator bacteria removal have been performed for bioretention, particularly for enterococci. Studies by Hathaway et al. (2009) on a bioretention area in
Charlotte, NC, and Passeport et al. (2009) on two bioretention cells in Graham, NC, indicated high fecal coliform concentration reductions, with all three cells having concentration reductions above 85%. Hathaway et al. (2009) also reported a 92% E. coli concentration reduction for the bioretention area in Charlotte, NC. Jones et al. (2008) examined enterococci removal from a
bioretention area in New Hampshire showing a concentration reduction of over 90%. Conversely, evaluations by Li and Davis (2009) on two bioretention areas in Silver Spring and College Park, MD, showed relatively poor performance for E. coli (median removal of 0% and 57%, respectively) and fecal coliform (median removal of 50% and 0%, respectively). Likewise, there was a substantial difference in functionality between the two bioretention areas studied
in Wilmington, NC. The differing depth of media, nominally 60 cm for Bioretention-D and 25 cm for Bioretention-S, appeared to result in varied performance. Further investigation is planned to explore possible explanations for the difference in performance between cells. Potential causes are differences in organic content of the soils in the two cells, differences in soil moisture, differences in soil temperature, and differences in hydraulic function of the two systems
P a g e 1.1.6 Influent and Effluent Probability Plots
Probability plots allowed greater examination of influent and effluent indicator bacteria relationships for each SCM. Probability plots for E. coli are presented in Figures 5.3a-5.3e. Probability plots for enterococci are presented in Figures 5.4a-5.4e. These plots generally support performance observations made previously. Separation between influent and effluent probability curves are particularly noted for both wet ponds for E. coli and enterococci and
Bioretention-D for enterococci. Some consistent separation between influent and effluent E. coli probability curves is noted for Bioretention-D; however, the separation is moderate in
comparison to that exhibited in its enterococci probability plot. Wetland 1 also appears to function fairly well for enterococci based on the probability plots, supporting the moderate removal efficiency noted in Table 5.4. Probability plots for Bioretention-S for both indicator
bacteria and the stormwater wetlands for E. coli show a lack of distinction between influent and effluent probability curves, indicating inconsistent, poor performance over the course of the study.
(a) (b)
P a g e
(e) (f)
Figure 1.3: E. coli probability plots for (a) Wet Pond 1, (b) Wet Pond 2, (c) Bioretention-D, (d) Bioretention-S, (e) Wetland 1, and (f) Wetland 2
(a) (b)
(c) (d)
(e) (f)
P a g e 1.1.7 Analysis of Effluent Concentrations
Microbial contamination is regulated by target concentrations established by the USEPA (1986). For fresh waters regulated for full body contact, the geometric mean over a 30-day period cannot exceed 126 organisms / 100 ml for E. coli or 33 organisms / 100 ml for enterococci. For marine waters regulated for full body contact, the geometric mean over a 30-day period cannot exceed 35 organisms / 100 ml for enterococci. Thus, effluent SCM concentrations can be
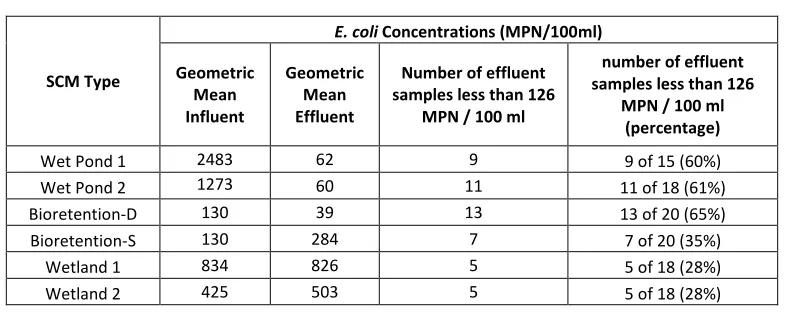
compared to these values to determine how they will affect concentrations in receiving waters. Obviously, mass balances would be required to evaluate the full impact of these practices on targeted watersheds. Median effluent indicator bacteria concentrations are shown in Tables 5.6 and 5.7.
Table 1.6: Median effluent E. coli concentrations
SCM Type
E. coli Concentrations (MPN/100ml)
Geometric Mean Influent Geometric Mean Effluent
Number of effluent samples less than 126
MPN / 100 ml
number of effluent samples less than 126
MPN / 100 ml (percentage)
Wet Pond 1 2483 62 9 9 of 15 (60%)
Wet Pond 2 1273 60 11 11 of 18 (61%)
Bioretention-D 130 39 13 13 of 20 (65%)
Bioretention-S 130 284 7 7 of 20 (35%)
Wetland 1 834 826 5 5 of 18 (28%)
Wetland 2 425 503 5 5 of 18 (28%)
Table 1.7: Median effluent enterococci concentrations
SCM Type
Enterococci Concentrations (MPN/100ml)
Geometric Mean Influent Geometric Mean Effluent
Number of effluent samples less than 33
MPN / 100 ml
Number of effluent samples less than 33
MPN / 100 ml (percentage)
Wet Pond 1 2356 237 4 4 of 15 (27%)
Wet Pond 2 274 37 10 10 of 18 (56%)
Bioretention-D 375 39 10 10 of 20 (50%)
Bioretention-S 375 378 3 3 of 20 (15%)
Wetland 1 1018 316 6 6 of 18 (33%)
P a g e
SCMs that provided good removal of indicator bacteria (Tables 5.3 and 5.4) also had low
geometric mean effluent concentrations. Median effluent E. coli concentrations were below USEPA target concentrations for Wet Pond 1, Wet Pond 2, and Bioretention-D. For enterococci, no SCM had median effluent concentrations below USEPA targeted values, although Wet Pond 2 and Bioretention-D approached targeted values.
No SCM consistently provided E. coli or enterococci concentrations lower than USEPA targeted values. Wet Pond 2 and Bioretention-D provided the highest percentage of effluent E. coli and enterococci samples below the target value, while Wet Pond 1 had a high percentage of storms below only the E. coli target value. Bioretention-S and the two stormwater wetlands did not typically have effluent concentrations below the USEPA target values.
These results suggest that although positive reductions of indicator bacteria can be observed in SCMs, even those which perform well may not consistently produce concentrations below USEPA target values for surface waters. Similar observations were made by Hathaway et al.
(2009). This is important in evaluating the effectiveness of watershed restoration activities. To reliably reduce indicator bacteria loadings to surface waters, SCMs must reduce runoff volume. SCMs may not consistently contribute to watershed restoration simply due to concentration reductions. To this end, a SCM like bioretention that has been repeatedly shown to reduce outflow volumes (Hunt et al. 2006, Li et al. 2009) holds the most promise.
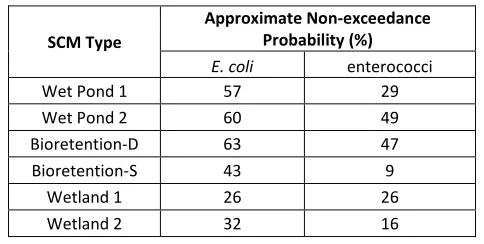
Estimations of non-exceedance probabilities were generated using probability plots. A
regression line was fit to the outlet data and the non-exceedance probability was estimated as the probability where the regression line crossed the USEPA targeted surface water
concentration for E. coli and enterococci, respectively. This allowed some estimation of the
probability a given SCM’s effluent concentration will not exceed USEPA targeted surface water concentrations. Approximate non-exceedance probabilities are presented in Table 5.8.
Generally, there is a higher probability of exceeding the enterococci target concentration, with non-exceedance probabilities being lower than 50% for all SCMs. Non-exceedance probabilities
P a g e
bioretention areas evaluated by Li and Davis (2009), where non-exceedance probabilities for E.
coli were estimated as > 65% and >75%.
Table 1.8: USEPA targeted concentration non-exceedance probabilities
SCM Type
Approximate Non-exceedance Probability (%)
E. coli enterococci
Wet Pond 1 57 29
Wet Pond 2 60 49
Bioretention-D 63 47
Bioretention-S 43 9
Wetland 1 26 26
Wetland 2 32 16
1.1.8 Seasonal Impacts on SCM Effluent Concentrations
The public health impacts of urban stormwater runoff are of particular interest during periods of the year when water related recreational activities are most common. Studies such as Hathaway
and Hunt (in review), Selvakumar and Borst (2006), and Line et al. (2008) suggest indicator bacteria concentrations in stormwater runoff may increase with warmer seasons/temperatures. Data were separated into swimming and non-swimming periods based on dates used as
guidelines for compliance sampling by the NCDEH (2010). The non-swimming period is from
November to the end of March, when average daily temperatures are lowest. For each SCM, both swimming and non-swimming seasons were represented by at least 5 samples (Table 5.9). The influent and effluent concentrations of E. coli and enterococci for each SCM are illustrated in Figures 5.5 and 5.6 for the two periods (swimming and non-swimming).
Table 1.9: Number of swimming and non-swimming samples for each SCM for both indicator bacteria
Location Number of Samples
swimming non-swimming
Wet Pond 1 10 5
Wet Pond 2 10 8
Bioretention-D 10 10
Bioretention-S 10 10
Wetland 1 10 8
Wetland 2 10 8*
P a g e Figure 1.5: Geometric mean influent and effluent E. coli concentrations for swimming and
non-swimming seasons for each SCM
Figure 1.6: Geometric mean influent and effluent enterococciconcentrations for swimming and non-swimming seasons for each SCM
Geometric mean concentrations of E. coli were higher during the swimming season for both the inlet and outlet of each SCM. For enterococci, this was also true for the majority of SCMs. Geometric mean inlet enterococci concentrations were found to be higher during the non-swimming season for Wet Pond 2, and geometric mean outlet enterococci concentrations were
P a g e
difference in geometric mean indicator bacteria concentrations between the swimming and
non-swimming seasons as calculated by equation 3. Effluent concentrations decreased by more than 60% for both indicator bacteria in all SCMs (other than enterococci in Bioretention-S and Wetland 2).
Table 1.10: Analysis of seasonal differences in effluent concentrations
Location
Effluent concentration reduction - swimming to non-swimming (%)
E.coli enterococci
Wet Pond 1 84 73
Wet Pond 2 61 69
Bioretention-D 68 63
Bioretention-S 89 40
Wetland 1 89 88
Wetland 2 66 -2
Despite apparent differences between swimming and non-swimming periods, Wilcoxon Rank Sum tests showed no statistically significant differences between inlet and outlet concentrations for the two seasons (p < 0.05). It is possible the high variability common in microbiological data resulted in statistically insignificant results; further, a relatively low number of non-swimming
samples (5) was available for Wet Pond 1. Nonetheless, these data suggest effluent indicator bacteria concentrations may vary seasonally for SCMs. A study on two bioretention areas by Li and Davis (2009) identified summer as the season when the highest influent concentrations of E. coli and fecal coliforms were found for each system; however, removal performance could not be correlated to temperature. Similar observations of higher effluent enterococci
concentrations during the summer and early fall were made by Jones et al. (2008) on a wet pond in New Hampshire.
Temporal changes in both influent and effluent indicator bacteria concentrations could also lead
to differences in SCM removal efficiency throughout the year. Table 5.11 shows indicator bacteria concentration reductions in SCMs during the swimming and non-swimming seasons. Concentration reductions are typically higher during the non-swimming season, although systems which performed well overall (Wet Pond 1, Wet Pond 2, and Bioretention-D) provided relatively high concentration reductions throughout the year. Nonetheless, these data suggest
P a g e
needed to strengthen this postulation. This represents a future research need in the stormwater
management field, and could have implications for both public health and watershed management.
Table 1.11: Indicator bacteria concentration reductions in SCMs during swimming and non-swimming seasons
Location
E.coli Enterococci
Concentration Reduction - swimming (%) Concentration Reduction - non-swimming (%) Concentration Reduction - swimming (%) Concentration Reduction -
non-swimming (%)
Wet Pond 1 96 99 84 96
Wet Pond 2 96 94 71 95
Bioretention-D 68 72 89 90
Bioretention-S -297 -21 15 -20
Wetland 1 -81 53 30 89
Wetland 2 -36 1 52 14
Conclusions
Six Stormwater Control Measures were evaluated for E. coli and enterococci removal over 15 to 20 storm events in Wilmington, NC. Both wet ponds and the deep bioretention cell were
effective at removing both E. coli and enterococci, with concentration reductions exceeding 70% for both indicator bacteria in each SCM. However, the shallow bioretention cell and both
stormwater wetlands did not perform well in comparison, particularly for E. coli. These data suggest some SCMs can export indicator bacteria, as two of the six SCMs showed negative removal of E. coli. Similar results have been seen in such studies at Krometis et al. (2009), Li and
Davis (2009), Jones et al. (2008), and Hathaway et al. (2009). These results are not illogical, as indicator bacteria have been shown to persist in sediments of streams and estuaries (Sherer et al. 1992, Jeng et al. 2005). Further, studies by Davies and Bavor (2000) on wet pond sediments indicated the persistence of indicator bacteria even after 28 days. SCMs may also attract
wildlife, leading to direct addition of indicator bacteria into the system through defecation.
These data have some similarity to other studies which evaluated microbial reductions in SCMs; however, some differences in performance may occur based on geophysical region. This is possibly due to differences in particle-microbe interactions in sandy watersheds and/or dilution
P a g e
evaluated by Mallin et al. (2002) performed well in comparison to wet ponds studied in clayey
watersheds by Krometis et al. (2009) and Davies and Bavor (2000). Also, further study is needed to determine how soil type and design configuration affect indicator bacteria removal in
bioretention areas. Despite a larger watershed, Bioretention-D performed well in comparison to Bioretention-S. Both the depth and type of fill media likely influence the ability of Bioretention-S to sequester bacteria.
SCMs which performed well in Wilmington, NC, showed promise in meeting USEPA target E. coli concentrations for surface waters. Both wet ponds and Bioretention-D had geometric mean effluent E. coli concentrations lower than USEPA target values. Enterococci target values were not achieved by any SCM; however, both Wet Pond 2 and Bioretention-D had geometric mean
effluent concentrations which approached target concentrations. Although this creates some concern as to the benefit of SCMs in watersheds impacted by microbial pollution, a SCM’s contribution to watershed restoration cannot be evaluated based on concentration reduction alone. Reductions in indicator bacteria mass entering surface waters may be achieved through
such mechanisms as infiltration. Evaluation of the impacts of infiltration on groundwater microbial quality represents another need within the field of stormwater management, particularly as infiltration-based SCMs become increasingly implemented.
SCM effluent indicator bacteria concentrations appear to vary throughout the year. Specifically,
effluent concentrations may elevate during the swimming season from April to October. Further research is needed to verify this observation due to the variability in these data and lack of statistically significant results. Elevated concentrations during the period of the year when water related recreational activities are most frequent causes some concern in regard to public health. Understanding these changes is important in determining how to manage watersheds for
indicator bacteria. TMDLs for microbial pollution are required to account for seasonal variability. Seasonal variability has been shown for indicator bacteria in urban stormwater runoff in such studies at Selvakumar and Borst (2006) and Hathaway and Hunt (in review). Further research is needed to determine if there are also seasonal differences in SCM indicator bacteria
P a g e
Despite a recent increase in the number of studies evaluating indicator bacteria performance of
SCMs, data are variable. Further, there are limited data in regard to SCM performance for enterococci, the USEPA recommended indicator bacteria for marine environments. A relatively limited amount of scientific literature has shown differences in performance of SCMs for fecal coliform, E. coli, and enterococci. The data presented herein have added to the limited scientific knowledgebase for SCM performance for enterococci. Removal of enterococci was found to vary
substantially from removal of E. coli for a number of the six SCMs evaluated. Differences in removal of E. coli and enterococci were not consistent, as some SCMs performed better for E. coli and others for enterococci. However, effluent enterococci concentrations did not approach USEPA target concentrations even in SCMs which had effluent E. coli concentrations less than USEPA targeted concentrations. Further, non-exceedance probabilities were lower for
enterococci for all SCMs other than Wetland 1. It is unknown if these differences are due to variations in the magnitude of influent and effluent microbe populations, or due to differences in indicator persistence. For instance, enterococci are typically regarded as being more resistant to environmental conditions (USEPA 2001). At this time, it does not appear that similar
performance can be assumed for a given SCM for all indicator bacteria.
Perhaps the most important need in examining indicator bacteria removal in SCMs is an understanding of mechanisms which control indicator bacteria persistence and sequestration. Such understanding will: (1) help determine which SCMs should be used in watersheds impacted
by microbial pollution, (2) allow a greater understanding of the public health implications of indicator bacteria persistence in SCMs, (3) explain the variability noted in this study and others with regard to SCM removal efficiency of indicator bacteria, and (4) potentially lead to design modifications which can be used for SCMs in an effort to enhance removal of indicator bacteria.
Acknowledgements
The authors acknowledge the funding agencies for this research, the North Carolina Department of Environment and Natural Resources and North Carolina Urban Water Consortium –
Stormwater Group. The authors would like to thank Joe Abbate of the Cape Fear River Watch for
P a g e
Engineering at North Carolina State University for their work in designing, constructing, and
monitoring four of the six SCMs evaluated in this study.
References
Bean, E.Z. (2005). “A field study to evaluate permeable pavement surface infiltration rates, runoff quantity, runoff quality, and exfiltrate quality.” Master of Science Thesis. Raleigh, NC: Department of Biological and Agricultural Engineering, NC State University.
Birch, G.F., C. Matthai, M.S. Fazeli, and J.Y. Suh. (2004). “Efficiency of a constructed wetland in removing contaminants from stormwater.” Wetlands, 24(2): 459-466.
Burton, G.A. and R.E. Pitt. (2002). “Stormwater Effects Handbook: A Toolbox for Watershed Managers, Scientists, and Engineers.” CRC Press, LLC, Boca Raton, Fl.
Davies, C.M. and H.J. Bavor. (2000). “The Fate of Stormwater-Associated Bacteria in Constructed Wetland and Water Pollution Control Pond Systems.” Journal of Applied Microbiology. 89: 349-360.
Dietz, M.E., and J.C. Clausen. (2005). “A field evaluation of rain garden flow and pollutant treatment.” Water, Air, and Soil Pollution, 167: 123-138.
Hathaway, J.M., and W.F Hunt. (in review). “Statistical evaluation of factors affecting indicator bacteria in urban stormwater runoff.” Journal of Environmental Engineering.
Hathaway, J.M., W. F. Hunt, and S. Jadlocki. (2009). “Indicator bacteria removal in storm-water best management practices in Charlotte, North Carolina.” Journal of Environmental Engineering, 135(12): 1275 – 1285.
Hunt, W.F., A.R. Jarrett, J.T. Smith, L.J. Sharkey. (2006). “Evaluating bioretention hydrology and nutrient removal at three field sites in North Carolina.” Journal of Irrigation and Drainage Engineering, 132(6): 600 - 608.
Hunt, W.F., M.R. Burchell, J.D. Wright, and K.L. Bass. (2007). “Stormwater wetland design update: zones, vegetation, soil, and outlet guidance.” AGW-588-12. North Carolina Cooperative Extension, Raleigh, N.C.
Jeng, H.C., A.J. England, and H.B. Bradford. (2005). “Indicator organisms associated with
stormwater suspended particles and estuarine sediment.” Journal of Environmental Science and Health, 40: 779-791.
P a g e
Krometis, L.H, P.N. Drummey, G.W. Characklis, and M.D. Sobsey. (2009). “Impact of microbial partitioning on wet retention pond effectiveness.” Journal of Environmental Engineering, 135(9): 758-767.
Li, H., and A.P. Davis. (2009). “Water quality improvement through reductions of pollutant loads using bioretention.” Journal of Environmental Engineering, 135(8): 567-576.
Li, H., L.J. Sharkey, W.F. Hunt, A.P. Davis. (2009). “Mitigation of impervious surface hydrology using bioretention in North Carolina and Maryland.” Journal of Hydrologic Engineering, 14(4): 407-415.
Line, D.E., N.M. White, W.W. Kirby-Smith, and J.D. Potts. (2008). “Fecal coliform export from four coastal North Carolina areas.” Journal of the American Water Resources Association, 44(3): 606-617.
Mallin, M.A., S.H. Ensign, T.L. Wheeler, and D.B. Mayes. (2002). “Pollutant removal efficacy of three wet detention ponds.” Journal of Environmental Quality, 31: 654-660.
Mankin, K.R., L. Wang, S.L. Hutchinson G.L. Marchin. (2007). “Escherichia coli sorption to sand and silt load soil.” Transactions of the ASABE, 50(4): 1159-1165.
McCarthy, D.T., V.G. Mitchell, A. Deletic, and C. Diaper. (2007). “Escherichia coli in urban stormwater: explaining their variability.” Water Science and Technology, 56(11), 27-34.
McCarthy, D.T., A. Deletic, V.G. Mitchell, T.D. Fletcher, C. Diaper. (2008). “Uncertainties in stormwater E. coli levels.” Water Research, 42: 1812-1824.
Natural Resources Conservation Service (NRCS). (2010). “Soil data mart.”
http://soildatamart.nrcs.usda.gov/ (March 25, 2010).
North Carolina Division of Environmental Health (NCDEH). (2010). “N.C. Recreational Water Quality.” http://www.deh.enr.state.nc.us/shellfish/Water_Monitoring/RWQweb/home.htm (March 25, 2010).
Passeport, E., W.F. Hunt, D.E. Line, R.A. Smith, and R.A. Brown. (2009). “Field study of the ability of two grassed bioretention cells to reduce storm-water runoff pollution.” Journal of Irrigation and Drainage Engineering, 135(4): 505 – 510.
Selvakumar, A., and M. Borst. (2006). Variation of microorganism concentrations in urban stormwater runoff with land use and seasons. Journal of Water and Health, 4(1): 109-124.
Sherer, B.M., J.R. Miner, J.A. Moore, J.C. Buckhouse. (1992). “Indicator bacteria survival in stream sediments.” Journal of Environmental Quality, 21: 591-595.
P a g e
USEPA. (2001). “Protocol for developing pathogen TMDLs.” EPA-841-R-00-002. Office of Water, Washington, DC.
USEPA. (2002). “Urban stormwater BMP performance monitoring.” EPA-821-B-02-001. Office of Water, Washington, DC.
USEPA. (2003). “Bacterial water quality standards for recreational waters: status report.” EPA-823-R-03-008. Office of Water, Washington, DC.
United States Environmental Protection Agency (USEPA). (2008). “Water quality assessment and total maximum daily loads information (ATTAINS). “
P a g e
2
Analysis of Factors Influencing Bioretention Performance for Indicator Bacteria in
Wilmington, NC
Abstract
Although bioretention has been shown to remove or sequester a wide range of pollutants, relatively little study has been performed to evaluate its ability to sequester indicator bacteria. Two bioretention areas in Wilmington, NC, were studied in a paired-watershed experimental design. The primary difference in the design of the two systems was soil depth. One
bioretention cell was constructed with 25 cm of fill soil (Bioretention-S) and one with 60 cm of fill soil (Bioretention-D). The systems were found to perform differently for indicator bacteria based on multiple performance evaluation metrics. Bioretention-D showed concentration reductions of 70% and 89% for E. coli and enterococci, respectively. Effluent concentrations from Bioretention-D compared well to EPA target values and other studies in literature.
Conversely, Bioretention-S showed concentration “reductions” of -119% and -102% for E. coli and enterococci, respectively. Effluent concentrations from Bioretention-S were substantially higher than USEPA target values and other studies in literature. Multiple factors were evaluated to determine the cause of performance differences between the two cells. Soil depth was
identified as the most important factor. The 25 cm of fill soil in Bioretention-S exhibited poorer runoff detention and theoretically resulted in higher soil water flux and decreased contact time relative to Bioretention-D. These differences seemingly led to diminished indicator bacteria sequestration. The results of this study suggest soil depth is an important design parameter for bioretention which should be carefully selected. Further, minimum soil depths appear to exist,
below which decreased sequestration of indicator bacteria may be experienced.
Introduction
Low Impact Development (LID) is increasingly utilized as a technique to mitigate the impact of stormwater runoff on surface waters (USEPA 2000). As part of LID, infiltration based SCMs
P a g e
SCM as part of LID is bioretention (also known as biofiltration, or bio-infiltration when
underdrains are not employed).
Bioretention has been shown effective at reducing runoff volumes, peak flows, and numerous pollutants ranging from nutrients to metals (Hunt et al. 2006, Dietz and Clausen 2005, Davis et al. 2006, Davis et al. 2009, Roseen et al. 2006). However, until recently, little was known
regarding bioretention sequestration of indicator bacteria. Indicator bacteria denote
contamination from fecal matter and thus the possible presence of pathogens. In a review of bioretention literature and future needs, Davis et al. (2009) identified research on bioretention removal of pathogenic bacteria as a need for the stormwater management community. Indicator bacteria are a common source of impairment in surface waters in North America,
Europe, Australia, and elsewhere. In the United States, there are more Total Maximum Daily Loads (TMDLs) in place for indicator bacteria than any other pollutant (USEPA 2010).
Stormwater runoff from urban watersheds has been shown to have substantial concentrations of indicator bacteria (Selvakumar and Borst 2006, McCarthy et al. 2007, Hathaway et al.
accepted ), contributing to microbial pollution in surface waters.
Bioretention has numerous treatment mechanisms for indicator bacteria. In addition to filtering bacteria as stormwater passes through the system, microbes may sorb to organic particles and soils. Such mechanisms result in sequestration of microbes; however, die-off of captured
microbes is controlled by other factors. Exposure to sunlight (UV radiation), desiccation,
predation, temperature, and nutrient availability can all influence microbial survival (Ferguson et al. 2003, Arnone and Walling 2007 ). Further, Indicator bacteria have been shown to persist in natural systems. Studies by Sherer et al. (1992) and Jeng et al. (2005) suggest indicator bacteria can persist in sediments from 7 to 30 days given suitable environmental conditions. Therefore,
despite treatment mechanisms within bioretention areas to facilitate indicator bacteria removal, microbial persistence within bioretention areas may limit overall effectiveness.
Laboratory analyses emulating bioretention function have been utilized to evaluate the
P a g e
bioretention fill media by Zhang et al. (2008) showed an 80% E. coli reduction. Zhang et al.
(2008) also analyzed bacteria concentrations in the bioretention fill media, observing a 99.9% die off of E. coli cells one week after synthetic stormwater runoff was applied to the columns.
Field studies on bioretention have also evaluated indicator bacteria removal. Some studies showed either concentration reductions of indicator bacteria greater than 85% (Hathaway et al.
2009, Passeport et al. 2009) or effluent indicator bacteria concentrations below detectable limits (Dietz and Clausen 2005). Conversely, an analysis of two bioretention cells in Maryland by Li and Davis (2009) yielded somewhat different results. E. coli concentration reductions in the two cells were 57% and 0%, while fecal coliform reductions were 0% and 50%. Li and Davis (2009) also observed export of indicator bacteria during some monitored events. Thus, although
studies such as Hathaway et al. (2009) have proposed the effectiveness of bioretention for indicator bacteria sequestration, variability exists among field collected performance data. It should be noted that other than Hathaway et al. (2009), field studies performed on bioretention for indicator bacteria have involved seven or fewer samples.
Although there are a growing number of studies evaluating bioretention performance for indicator bacteria, relatively little is understood regarding microbial dynamics within
bioretention fill media (Li and Davis 2009). No studies have been performed to evaluate which environmental conditions within bioretention areas can influence indicator bacteria
performance. Such data will result in a refined understanding of differences in performance observed for infiltration-based SCMs, and may lead to revised design standards for bioretention being implemented in watersheds with microbial TMDLs.
The objectives of this study were to build upon the current understanding of indicator bacteria
P a g e Materials and Methods
2.1.1 Site Descriptions
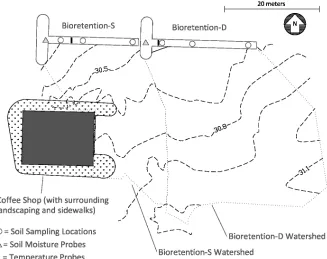
The experimental site was located in Wilmington, North Carolina (Figure 6.1). Two bioretention areas were constructed adjacent to one another within a parking lot (Figure 6.2). A paired-watershed experimental design was desired, but paired-watershed areas differed due to
microtopography within the parking lot. The surface areas of the bioretention cells differed by
only 1 m2. One bioretention was constructed with an average soil depth of approximately 60 cm (Bioretention-D), the other had an average soil depth of approximately 25 cm (Bioretention-S). All fill soil for the bioretention areas came from on-site sandy soil, which was classified as Baymeade fine sand (NRCS 2010). Clay and silt comprised 8 to 10 percent of the soil used as fill for the bioretention areas (Table 6.1). This is a lower percentage than bioretention areas
evaluated by Dietz and Clausen (2005) and Li and Davis (2009), where fines comprised 16 to 46 percent of the soil media. However, this percentage of fines is acceptable per North Carolina SCM design regulations (NCDENR 2007).
Each cell was constructed with a 10-cm underdrain to facilitate sample collection. It should be noted that underdrains are typically not required for bioretention areas in the sandy soils of coastal areas, thus this design differs from standard practice in the region. Runoff entered each bioretention cell as sheet flow. A small flume was installed at the pavement edge in a location presumed to be representative of the entire watershed. This allowed some pooling of runoff as
it entered the bioretention cell, facilitating sampling of the inlet. A similar sampling strategy was used in such studies as Hunt et al. (2006). The bioretention areas were vegetated with turf grass and a small number of shrubs. It should be noted that bypass of the shallow cell occurred on some occasions due to watershed topography routing water around the cell. This bypass was judged to not substantially influence the results of this study. General characteristics of each
P a g e Figure 2.1: Experimental location in Wilmington, NC
Table 2.1: General characteristics of Wilmington SCMs
Characteristic Bioretention-D Bioretention-S
Drainage Area (ha) 0.10 0.05
Watershed Composition Commercial (parking lot)
Commercial (parking lot)
Estimated Imperviousness 100% 98%
Surface Area (m2) 55 54
Surface Area: Drainage
Area Ratio 0.054 0.110
Storage Depth (cm) 28 (1% slope on cell)
28 (1% slope on cell) Estimated Average Soil
Depth (cm) 25 60
Soil Texture3
Sand (%) 88 87
Silt (%) 5 4
Clay (%) 5 4
1. NRCS 2010 – Soil Data Mart