SUSY search with two same-sign leptons and jets with the
ATLAS detector using 21 fb
−1of pp collisions at 8 TeV
Otilia Ducu, on behalf of the ATLAS Collaboration1,2,a
1IFIN-HH, Bucharest
2Aix-Marseille University, CPPM, CNRS/IN2P3
Abstract.A search for the production of supersymmetric particles decaying into final
states with jets, b-jets, missing transverse momentum and two isolated leptons, e or
μ, with the same electric charge (same-sign leptons) is presented. The analysis uses a
data sample collected during 2012, which corresponds to a total integrated luminosity
of 20.7 fb−1of √s=8 TeV proton–proton collisions recorded with the ATLAS detector
at the Large Hadron Collider. No significant deviation from the Standard Model ex-pectation is observed in any of these signal regions. Exclusion limits are derived for
a mSUGRA/CMSSM model, and for a wide variety of simplified models of
supersym-metry. The ATLAS result on which this note is based significantly extends previous exclusion limits..
1 Introduction
The standard Model (SM) is giving an excellent description of currently known phenomena. However this theory has some known problems, such as explaining the hierarchy problem. An extension that solves in a natural way several problems of the SM is Supersymmetry (SUSY) [1], a theory which
predicts a new partner for each SM particle (sparticle) differing by half a unit of spin.
In the Minimal Supersymmetric Standard Model (MSSM), with R-parity, the scalar partners of
right-handed and left-handed quarks, ˜qR and ˜qL, can mix to form two mass eigenstates, ˜q1 and ˜q2,
where ˜q1denotes the lighter particle. Large mixing can yield a bottom squark, ˜b1, and a top squark,
˜
t1, mass eigenstates which are significantly lighter than other squarks. Consequently, ˜b1and ˜t1could
be produced with large cross sections at the LHC, either directly in pairs, or through ˜gg˜ production
with subsequent ˜g → bb˜1or ˜g → tt˜1 decays (gluino-mediated production). Several possible decay
chains can lead to same-sign (SS) leptons. For instance, the gluino mediated top squark production,
followed by the decay ˜t1 → tχ˜01, leads to four top quarks in the final state. Alternatively, the decay
via a chargino ( ˜χ±1), ˜t1 → bχ˜±1 → bW±χ˜01 can also lead to SS lepton pairs. Direct pair-production
of bottom squarks, ˜b1b˜∗1, with ˜b1 → t˜χ˜+1, can give final states with 4 W bosons, 2 bottom quarks
and 2 neutralinos. Several scenarios are also considered for ˜gg˜ decays to gauginos through squarks
from the two first generations, via ˜g → qqχ˜±1 → qqW±χ˜0
1 or sleptons ˜g → qqχ˜±1 → qql˜ν/lν˜ (or
˜
g→qqχ˜0
2→qqll˜/νν˜ ) with ˜l→lχ˜01and ˜ν→νχ˜01. In these cases, advantage is taken of the Majorana
nature of the gluino andqand ¯q(orland ¯l) can be obtained in the final state. Therefore this enhances
ae-mail: [email protected]
DOI: 10.1051/
C
Owned by the authors, published by EDP Sciences, 2014
/2 01
epjconf 4 7100043
Table 1.Three signal regions are defined depending on number ofb-jets identified in the final state:
SR Nb−jets Other variables, exclusion case Additional cuts for discovery case
SR0b ==0 Njets≥3,ET >150 GeV, mT>100 GeV meff>400 GeV SR1b ≥1 Njets≥3,ET >150 GeV, mT>100 GeV meff>700 GeV SR3b ≥3 Njets≥5, (ET <150 GeV or mT<100 GeV) Njets≥4
the probability to obtain same-sign lepton pairs when only one lepton is produced in each gluino decay.
This proceeding describes a search [2] that utilizes final states with SS lepton pairs, multiple jets,
and missing transverse momentum (ET) observed by the ATLAS detector [3] at the LHC. The search
is conducted using 20.7 fb−1of proton-proton collisions at √s=8 TeV recorded in 2012. Production
of SS pairs in association with jets is rare for SM processes but can have high cross-section for the considered SUSY models.
2 Event selection and signal regions definition
Event selection requirements rely on electrons, muons, jets (includingb-tagged jets) andE T. To cover
the full phase space for control samples and signal region a combination ofET, single and di-lepton
triggers is used.
All jets are required to have pT >25 GeV (>40 GeV in the signal regions) and |η| <2.8. If
b-tagging is required, the threshold is lowered to 20 GeV. Leptons are required to havepT >20 GeV
and|η|<2.47 (2.4 for muons).
Signal region definitions are presented in Table 1. Selection criteria for the regions used for
model-independent limits on cross-sections (discovery case) include additional requirements for effective
mass (meff) or number of jets (Njets). We performed a fit of distributions in meffto set model-specific
limits using the signal regions for the exclusion case. All signal regions are made exclusive to each other to allow statistical combination of the limits on cross-sections.
SR1b is designed to be sensitive to a wide range of supersymmetry model signatures. The signal
region with a veto on the presence ofb-jets (SR0b) is complementary to SR1b and is designed to
cover the models which have no top in the final state. SR3b is considered to increase the sensitivity
for models with compressed mass spectra involving third generation squarks with lowET, or models
with R-parity violation that do not feature intrinsically highE T.
3 Background estimation and validation
Searches in events with two same-sign leptons are characterized by very low backgrounds. Three main classes of backgrounds can be distinguished: prompt same-sign lepton pairs, charge mis-measurement and fake leptons. Background evaluation is performed using a combination of Monte Carlo (MC) simulations and data-driven techniques.
Sources of real SS leptons arise mainly from the production of aWorZboson, decaying
lepton-ically, in association withtt¯, and from dibosons (WZ,ZZ) produced in association with jets. These
backgrounds are estimated with MC simulation.
Reducible background from charge mis-measurement consists mostly of events with two opposite-sign (OS) leptons for which the charge of an electron is mis-identified. The dominant mechanism is due to the radiation of a hard photon bremsstrahlung followed by an asymmetric conversion for which
the electron with the opposite charge dominates (e± → e±γ → e±e±e∓). This type of background
generally appears in dileptontt¯events and the estimation is done using a fully data-driven method.
electron pairs. The probability that one electron has its charge mis-measured varies from 10−4to 0.02
in the range 0≤ |η| ≤2.5 and 20<pT <200 GeV.
Another reducible background, so called fake lepton background, is caused by leptons from decays of hadrons, especially b hadrons. Other candidates can result from mis-measurement of hadronic jets. The fake lepton estimation is performed in data using a matrix method after loosening the lepton identification and isolation criteria. This method requires the measurement of lepton identification
efficiency and lepton fake rate as input. Lepton identification efficiency is measured in a data sample
enriched with prompt OS leptons fromZ → l+l−events. Lepton fake rate is measured in a sample
enriched in one prompt muon and one fake lepton of identical charge. For the electron fake rate the
measurement is done for two selections, with ab-jet veto and with at least oneb-jet.
Number of events
1 10
2
10
3
10
4
10
5
10
6
10 Same Sign e e
Data SM Total Charge flip Fake leptons Diboson
+ V t t ATLASPreliminary
=8 TeV s , -1 L dt = 20.7 fb
∫
>20 GeV
T
Number of b-jets with p
0 1 2 3 4 5
data / exp
0 1 2
Number of entries / 5 GeV
1 10
2
10
3
10
4
10
μ
Same Sign e 0 b-jets Data SM Total Fake leptons Diboson Charge flip
+ V t t ATLASPreliminary
=8 TeV s , -1 L dt = 20.7 fb
∫
[GeV]
T
Transverse momentum p 20 40 60 80 100 120 140 160
data / exp
0 1 2
Number of events / 20 GeV
1 10
2
10
μ μ
Same Sign >0 b-jets Data SM Total Fake leptons Diboson
+ V t t Charge flip ATLASPreliminary
=8 TeV s , -1 L dt = 20.7 fb
∫
[GeV]
T
Transverse mass m 0 50 100 150 200 250 300
data / exp
0 1 2
Figure 1.Left:eechannel, distribution of theb-jet multiplicity (pT>20 GeV). Middle:eμchannel, distribution
of thepT of the selected leptons with ab-jet veto. Right: μμchannel, transverse mass distribution after lepton
selections with at least oneb-jet [2].
Background systematic uncertainty
For the charge mis-measurement background the main uncertainty is coming mainly form the sta-tistical uncertainty of the charge flip rate measurement and from a potential systematic bias of the
data-driven method. The later one is estimated by taking the relative difference between the true rate
(MC, truth-matching) and the one obtained with the data-driven method. For the fake lepton back-ground the main uncertainty comes from the statistical uncertainty of the fake lepton rate and from a potential systematic bias estimated by changing the measurement region definition (eg: higher jet
multiplicity, tighter cuts onET, mT). For prompt SS pair production the main uncertainties come from
systematic variations of the jet energy scale,b-tagging efficiency and pile-up modeling in the MC
simulations. Additional uncertainties are assigned corresponding to different acceptance predictions
from alternative generators. In all SRs the dominant systematic uncertainty is coming from lepton
fake rate, jet energy scale,tt¯+Vandb-jets identification.
Background validation
The background estimates obtained using both data-driven and Monte Carlo techniques are checked by comparison with the data. Good agreement between the data and the background prediction is
observed. Some example distributions for theee,eμandμμchannels can be found in Figure 1.
In addition, to validate the Monte Carlo description of events with highb-jet multiplicity
contain-ing both real and fakeb-tags, a control region enriched in events containing OS dilepton pairs and
≥3b-jets has been studied.The distributions in this region, including thepT distributions of theb-jets
which play an important role in the selection, are found to agree well with the data.
Three regions are defined to validate the dominant backgrounds with prompt same-sign leptons,
Table 2.Background fit results for the VR-diboson, VR-ttW and VR-ttZ regions, with the discovery fit
configuration, for an integrated luminosity of 20.7 fb−1. Nominal MC and data-driven expectations are given for
comparison. The errors shown are the systematic uncertainties.
Event classes VR-diboson VR-ttW VR-ttZ
Observed events 54 9 4
Expected background events 74±13 4.2±1.9 8.0±2.0
Expectedtt¯+V events 1.6±0.8 2.7±1.5 3.2±1.1
Expected diboson events 60±7 0.4±0.1 3.9±1.3
Expected fake lepton events 12±11 1.1±1.1 0.9±0.5
Expected charge mis-meas. events 0 0 0
are not used to constrain the backgrounds in the fits but to verify the validity of the MC predictions. There is no overlap with the signal regions.
The validation region for tt W¯ (VR-ttW) uses exactly two same-sign muons (no electrons) to
reduce the background of fake leptons and charge mis-measurement. The event selection requires
one or more jets withpT >30 GeV, exactly twob-jets withpT >20 GeV, 20<ET <120 GeV and
transverse mass (mT)>80 GeV.
The validation region fortt Z¯ (VR-ttZ) requires three leptons (electrons or muons), where the two
leading leptons must havepT >20 GeV and the third lepton pT >10 GeV. A pair of opposite-sign,
same-flavour leptons is required with the invariant mass of 83<ml+l− <96 GeV. In addition, the
event selection requires two or more jets withpT >40 GeV, one or two b-jets with pT >20 GeV,
20<ET <120 GeV and meff>300 GeV.
The diboson validation region (VR-diboson) requires two same-sign muons to reduce the fake and charge mis-measurement backgrounds. In addition, the event selection requires two or more jets
withpT >20 GeV, nob-jet withpT >20 GeV, 20<ET <120 GeV and mT>100 GeV.
The number of observed events and expected background events in all three validation regions are shown in Table 2. The background checks in the validation regions provide confidence that the MC simulations predict the SM background rate of prompt like-sign lepton pairs in events with multiple jets and b-jets within a factor of approximately 2, where the accuracy is limited by the statistical uncertainty from the number of events in the validation region.
4 Results
A simultaneous fit of all signal regions using a profile-likelihood method is done to determine the best
estimate of each component (signal/background) in the data. The simultaneous fit is notably used to
test the statistical compatibility of the background-only hypothesis as well as the one of many signal models with our observed data.
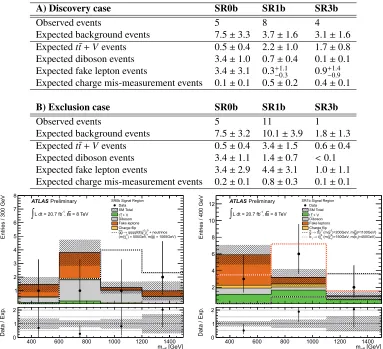
Table 3 presents the number of observed data events and expected background for the discovery (upper table) and exclusion cases (lower table). The background for the SR0b region is dominated by events containing fake leptons and dibosons (both with large uncertainties). In signal regions
SR1b and SR3b the largest background contribution and uncertainty is due tott¯plus vector boson
events. A comparison of tablesA andBshows, that the event sample for the exclusion case has a
larger background contribution from fake leptons in SR1b. This is due to the relaxed meff cut in the
exclusion case sample. Figure 2 shows the meff distribution in SR0b and SR1b using the exclusion
cuts.
Table 3.Number of observed data events and expected backgrounds for the three signal regions. The event counts correspond to the signal selection for the discovery limits (table A) and the exclusion limits (table B).
The quoted background errors include statistical and systematic uncertainties
A) Discovery case SR0b SR1b SR3b
Observed events 5 8 4
Expected background events 7.5±3.3 3.7±1.6 3.1±1.6
Expectedtt¯+Vevents 0.5±0.4 2.2±1.0 1.7±0.8
Expected diboson events 3.4±1.0 0.7±0.4 0.1±0.1
Expected fake lepton events 3.4±3.1 0.3+1.1
−0.3 0.9+1
.4 −0.9
Expected charge mis-measurement events 0.1±0.1 0.5±0.2 0.4±0.1
B) Exclusion case SR0b SR1b SR3b
Observed events 5 11 1
Expected background events 7.5±3.2 10.1±3.9 1.8±1.3
Expectedtt¯+Vevents 0.5±0.4 3.4±1.5 0.6±0.4
Expected diboson events 3.4±1.1 1.4±0.7 <0.1
Expected fake lepton events 3.4±2.9 4.4±3.1 1.0±1.1
Expected charge mis-measurement events 0.2±0.1 0.8±0.3 0.1±0.1
Entries / 300 GeV
1 2 3 4 5 6 7 8
ATLASPreliminary
= 8 TeV s , -1 L dt = 20.7 fb
∫
SR0b Signal Region Data SM Total
+ V t t Diboson Fake leptons Charge flip
+ neutrinos
0 1
χ∼
0 1
χ∼
qqqqll(ll)
→
g ~ g ~
) = 1065GeV) g ~ ) = 505GeV, m(
0 1
χ∼
(m(
[GeV] eff m 400 600 800 1000 1200 1400
Data / Exp.
0 1 2
Entries / 400 GeV
2 4 6 8 10
12 ATLASPreliminary
= 8 TeV s , -1 L dt = 20.7 fb
∫
SR1b Signal Region Data SM Total
+ V t t Diboson Fake leptons Charge flip
)=1100GeV) g ~ )=200GeV, m(
0 1
χ∼
(m(
0 1
χ∼
t t
→
g ~
)=450GeV)
1
b ~ )=150GeV, m(
±
1
χ∼
(m(
±
1
χ∼
t
→
1
b ~
[GeV] eff m 400 600 800 1000 1200 1400
Data / Exp.
0 1 2
Figure 2.Effective mass distributions in the signal regions SR0b (left) and SR1b (right) using the exclusion case event sample. The last bin includes overflows [2].
5 Interpretation
Model dependent exclusion limits are provided in the parameter space of several SUSY models. Five
typical SUSY models are presented: gluino mediated stop (tχ˜01) off-shell, gluino mediated stop (˜bχ˜±1 )
on-shell, direct sbottom ˜b1b˜1(tχ˜±1), direct-squark (via slepton) and mSUGRA/CMSSM.
Gluino mediated stop (tχ˜01) off-shell. In this model gluinos are produced in pairs and are assumed
to be lighter than all squark flavors. Gluinos decay through mediation of a virtual (off-shell) top squark
to a pair of top quarks and the lightest supersymmetric particle, LSP ( ˜g → tt¯χ˜0
1). In the simulation
the mass of the top squark is set tomt˜1=2.5 TeV and the masses of all other squarks are much higher
(decoupled). The final state is characterized by 4 top and two LSPs.
Results for this model are presented inm˜g−mχ˜0 plane. Figure 3 displays the observed and the
[GeV] g ~ m
500 600 700 800 900 1000 1100 1200 1300
[GeV]0 1
χ∼ m 0 200 400 600 800 1000 1200 forbidden 1 0 χ ∼ t t → g ~ ) g ~ ) >> m( t ~ , m( 1 0 χ∼ t t → g ~ production, g ~ -g ~
2 same-charge leptons + jets =8 TeV s , -1 L dt = 20.7 fb
∫
40 35 38 36 39 40 35 38 32 38 45 44 33 37 36 40 42 54 31 30 30 31 38 45 42 28 26 29 28 33 35 40 49 25 29 26 27 31 34 36 42 50 25 23 24 26 27 30 32 40 44 48 34 20 21 23 25 29 29 35 37 36 19 18 20 19 21 23 26 25 31 39 41 48 17 17 18 17 21 25 24 24 30 32 34 42 50 16 15 16 16 19 20 21 22 26 27 33 37 45 50 15 14 14 16 16 18 33 32 29 30 28 29 38 39 48 14 14 13 13 14 13 16 18 32 21 24 30 32 35 46 53 12 12 12 15 13 13 15 14 18 20 23 24 27 32 36 46 45 12 12 12 12 13 13 14 14 17 18 20 23 25 28 32 47 42 61 12 13 12 11 12 12 13 14 14 13 18 19 23 24 28 34 38 44 56Numbers give 95% CL excluded model cross sections [fb]
) theory SUSY σ 1 ± Observed limit (
) exp σ 1 ± Expected limit (
SR1b only
SR3b only
ATLASPreliminary
All limits at 95% CL
[GeV] g ~ m
600 700 800 900 1000 1100 1200 1300 1400 1500 1600
[GeV]0r¾1
m 200 400 600 800 1000 1200 forbidden 1 0 r ¾ t t A g ~
= 8 TeV s ), g ~ ) >> m( q ~ , m( 1 0 r¾ t t A g ~ production, g ~ g ~
Lepton & Photon 2013
ATLAS
Preliminary ExpectedObserved Expected Observed Expected Observed Expected Observed 10 jets * 0-lepton, 7 -
3 b-jets * 0-1 lepton, 4 jets * 3-leptons, 3 b-jets * 2-SS-leptons, 0 -
ATLAS-CONF-2013-054 ATLAS-CONF-2013-061 ATLAS-CONF-2012-151 ATLAS-CONF-2013-007 ] -1 = 20.3 fb int [L
] -1 = 20.1 fb int [L
] -1 = 12.8 fb int [L
] -1 = 20.7 fb int [L not included. theory SUSY m 95% CL limits.
Figure 3.Expected and observed limits for gluino mediated stop model (tχ˜0
1) off-shell. The left figure shows the individual exclusion limits for each signal region. The grey numbers show the upper limits on the cross-section for this scenario. The right figure compares these results with the limits obtained by other ATLAS searches also using the 2012 data. Limits are computed at 95% CL [2].
The yellow band around the expected limit shows the±1σuncertainty region including all
statis-tical and systematic uncertainties except the theorestatis-tical uncertainties on the signal cross section. The
±1σS US Ytheory lines around the observed limit are obtained by changing the signal cross section by±1σ. The grey numbers show the upper limits on the production cross-section for this scenario.
For comparison, results for this model from other ATLAS searches using the same data are shown in Figure 3 right. The exclusion lines show the interplay between SR1b, which performs best at a
large mass difference between the gluino and the LSP, and SR3b, which performs best at a small mass
difference (compressed region) between the gluino and the LSP. At 95% CL gluinos are excluded up
to masses of 900 - 1020 GeV for LSP masses below 550 GeV.
[GeV] g ~ m
700 800 900 1000 1100 1200 1300
[GeV]t ~ m 200 400 600 800 1000 1200 forbidden 1 ± χ ∼ tb+ → g ~
= 118 GeV 1
±
χ∼ ) = 60 GeV, 1 0 χ∼ ), m( g ~ ) < m( t ~ , m( 1 ± χ∼ b → t ~ , t ~ t → g ~
2 same-charge leptons + jets =8 TeV s , -1 L dt = 20.7 fb
∫
23 46 27 21 20 21 20 19 17 17 20 17 16 13 16 18 15 15 14 15 15 12 16 15 15 13 14 13 13 13Numbers give 95% CL excluded model cross sections [fb]
) theory SUSY σ 1 ± Observed limit (
) exp σ 1 ± Expected limit (
ATLASPreliminary
All limits at 95% CL
Gluino mediated stop (b˜χ˜±1 ) on-shell. In this model the lightest squark is ˜tand all other squarks
are heavier than the gluino with the gluino mass higher thanm˜t1+mt. Therefore the decay ˜g→t˜1thas
100% branching ratio (BR). The stop decay mode is assumed to be ˜t1 →bχ˜±1 withmχ±1 =120 GeV.
Hence, chargino decay is via a virtual W boson ˜χ±1 → W∗χ˜0
1 . The LSP mass is set to 60 GeV. The
final state is characterized by a pair of top and bottom quarks, two LSP and the decay products of the virtual W boson.
Figure 4 presents the limits for this model in themg˜−mt˜plane. At 95% CL gluinos are excluded
up to masses of about 940 - 1000 GeV for stop masses up to 750 GeV.
[GeV]
1
b~ m
300 350 400 450 500 550 600 650
[GeV] 1
±χ∼
m
100 200 300 400 500 600
forbidden
1
± χ ∼
t
→
b ~
) = 60 GeV 1 0 χ∼ , m( 1
±
χ∼ t → 1 b~ production, b ~ -b ~
2 same-charge leptons + jets =8 TeV s , -1 L dt = 20.7 fb
∫
298 194 149
127 108 95
82 86 76 73
77 66 66 67 55
62 56 56 55 50 50
90 72
46
Numbers give 95% CL excluded model cross sections [fb]
) theory SUSY σ 1 ± Observed limit (
) exp σ 1 ± Expected limit (
=8TeV s , -1 4 jets, 13.0fb ≥ 3-leptons,
ATLASPreliminary
All limits at 95% CL
Figure 5.Expected and observed limits for direct sbottom model, (tχ˜±1). Limits are computed at 95% CL [2].
Direct sbottom, b˜1b˜1 (tχ˜±1). This model assumes that only direct pair production of bottom
squarks is relevant. The decay mode is ˜b → tχ˜±1 followed by ˜χ±1 → W(∗)±χ˜0
1. The final state is
characterized by two top quarks, W bosons (on or offshell, depending onmχ˜±1−mχ˜0
1) andET.
Figure 5 (left) shows the observed and the expected limits in themb˜ −mχ˜± plane. In this model
the LSP mass is set to 60 GeV. Bottom squarks with masses up to 470 - 480 GeV for chargino masses below 320 GeV are excluded. As shown on the plot, this search improves the existing ATLAS limits for this model.
Direct-squark (via slepton). The model consists of direct squark pair production (first and second
generation) followed by decays which include sleptons. The decay chains are ˜q→qχ˜±1 and ˜q→qχ˜0
2,
with equal probability. Then the ˜χ±1 decays with equal probability into a slepton and a neutrino or
into a lepton and a sneutrino. The ˜χ0
2 decays with equal probability into a slepton and a lepton or a
neutrino and a sneutrino. Finally the slepton decays into a lepton and LSP, or the sneutrino decays into
a neutrino and a LSP. The masses of the ˜χ±1and ˜χ0
2are assumed to be equal to the average of the squark
and the LSP masses, and the slepton and sneutrino masses are assumed to be equal to the average of the ˜χ±1, ˜χ0
2 and the LSP masses. All three flavours of sleptons are considered and are degenerate in
mass. The final state is characterized by two light jets, up to four leptons andET.
In this model, squarks masses up to 600-660 GeV are excluded with 95% CL for neutralino masses below 380 GeV.
mSUGRA/CMSSM. In this constrained SUSY model three parameters are fixed to tan(β)=30,A0
=-2m0andμ>0, in order to accommodate a lightest Higgs boson mass around 126 GeV. Only strong
[GeV]
0
m
0 1000 2000 3000 4000 5000 6000
[GeV]
1/2
m
300 400 500 600 700 800 900 1000
(2000 GeV) q ~ (1600 GeV) q ~
(1000 GeV) g ~
(1400 GeV) g ~
h (122 GeV)
h (124 GeV)
h (126 GeV)
Expected Observed Expected Observed Expected Observed Expected Observed Expected Observed Expected Observed
> 0 , 0 = -2m 0 ) = 30, A `
MSUGRA/CMSSM: tan( Status: SUSY 2013
ATLASPreliminary
= 8 TeV s ,
-1
L dt = 20.1 - 20.7 fb
0
o¾ LSP
not included. theory SUSY m 95% CL limits.
0-lepton, 2-6 jets
0-lepton, 7-10 jets
0-1 lepton, 3 b-jets
1-lepton + jets + MET
1-2 taus + jets + MET
3 b-jets * 2-SS-leptons, 0 - ATLAS-CONF-2013-047
arXiv: 1308.1841
ATLAS-CONF-2013-061
ATLAS-CONF-2013-062
ATLAS-CONF-2013-026
ATLAS-CONF-2013-007
Figure 6.Expected and observed exclusion limits in the mSUGRA/CMSSM model with parameters tan(β)=30,
A0=-2m0andμ>0. Limits are computed at 95% CL [2].
Figure 6 presents the 95% CL exclusion limits for this model in the (m0,m1/2) parameter space.
The measurement allows one to exclude a large region of the mSUGRA/CMSSM parameter space.
6 Conclusions
A search for the production of supersymmetric particles decaying into final states with jets,b-jets,
ET and two isolated leptons, e orμ, of the same sign is presented. The analysis uses a data sample
collected during 2012 corresponding to a total integrated luminosity of 20.7 fb−1 of √s =8 TeV
proton-proton collisions recorded with the ATLAS detector at the Large Hadron Collider.
Three signal regions are defined with 0,≥1 and≥3b-jets, respectively. No significant deviation
from the Standard Model expectation is observed. Therefore the results are presented as
model-independent limits and as exclusion limits in a mSUGRA/CMSSM model and in several simplified
models of supersymmetry.
The diversity of the simplified models demonstrates the versatility of the analysis. This search
im-proves sensitivity of the ATLAS experiment especially to SUSY processes where the mass difference
between the decay products can be small, and, therefore, inaccessible via other decay modes. Hence this analysis covers several important aspects of the searches for supersymmetry at the LHC.
Acknowledgements
This work was supported by the Romanian Ministry of Education through the ATLAS Capacities/Module III
CERN project, by Faculty of Physics, University of Bucharest and by Ministry of Foreign Affairs of France
through a four months maintenance allowance.
References
[1] S.P. Martin,hep-ph/9709356(1997)
[2] ATLAS Collaboration,Search for strongly produced superpartners in final states with two same
sign leptons with the ATLAS detector using 21 f b−1of proton-proton collisions at √s=8 TeV
(ATLAS-CONF-2013-007, http://cds.cern.ch/record/1522430/, 2013)
[3] ATLAS Collaboration,The ATLAS experiment at the CERN Large Hadron Collider, (JINST, 3,