Combination of aronia, red ginseng and shiitake mushroom potentiated insulin secretion and reduced insulin resistance with improving gut microbiome dysbiosis in insulin deficient type 2 diabetic rats
Hye Jeong Yang1, Min Jung Kim1, Dae Young Kwon1, Da Sol Kim2, Ting Zhang2, Chulgyu Ha3, Sunmin Park2*
1Food Functional Research Division, Korean Food Research Institutes, Sungnam, Korea 2 Dept. of Food and Nutrition, Obesity/Diabetes Center, Hoseo University, Asan, Korea 3Biocampus of Korea Polytechnic Bioculture process, Nonsan, Korea
Running title: Anti-menopausal symptoms of herbal mixture
*Correspondence author: Sunmin Park, Ph.D Dept. of Food and Nutrition, Hoseo University 165 Sechul-Ri, BaeBang-Yup
Asan-Si, ChungNam-Do 336-795, South Korea Tel: 82-41-540-5345
Fax: 82-41-548-0670 E-mail: [email protected]
Abstract
Keywords: Aronia; ginseng; mushroom; pancreatectomy; type 2 diabetes; gut microbiome; insulin secretion
1. Introduction
The prevalence of type 2 diabetes is markedly increasing in Asian countries, including Korea and had reached 8.7% of the Asian population by 2014, and is expected to reach 12-5% by 2025 [1]. This is associated with ethnic differences in the etiology of type 2 diabetes [1]. Type 2 diabetes generally develops as a consequence of the imbalance between insulin resistance and insulin secretion [2]. When insulin resistance increases due to obesity, inflammation, oxidative stress, aging, less physical activity and etc., insulin secretion is elevated to overcome insulin resistance and to maintain normoglycemia. Increased inflammation and oxidative stress may accelerate the development of type 2 diabetes especially in Asians. However, Asians are susceptible to type 2 diabetes under the insulin resistant condition since their insulin secretory capacity and β-cell mass are low [3]. The Westernization
of diets elevate insulin resistance in Asians that is not compensated due to low insulin secretion capacity. Thus, the Westernization increases the prevalence of type 2 diabetes although obesity is much less in Asian than Caucasians.
accelerates the increase of insulin resistance in Px rats [5]. Anti-diabetic interventions for Asians can be examined for improvements in both insulin resistance and insulinotropic activity in Px rats fed with a high fat diet [6].
Previous studies have supported that gut the microbiome produces microbial metabolites including short-chain fatty acids (SCFAs), bile acids (BAs) and lipopolysaccharides (LPS) that modulate host glucose metabolism, mainly in the liver [7]. This is called the gut-liver axis. These metabolites directly influence metabolic diseases including type 2 diabetes [7]. Low-grade peripheral inflammation also promotes the development of type 2 diabetes. Patients with low a low bacterial α diversity in the gut microbiome are at greater risk of metabolic diseases
than are patients with high a α diversity [8]. Herbs rich in fiber, polyphenols and polysaccharides increase the abundance of the phylum Bacteroidetes, and genera Akkermansia, Bifidobacteria, Lactobacillus, Bacteroides and Prevotella [7]. However, it reduces the number
of phylum Firmicutes and Firmicutes/Bacteroidetes ratio in the intestines. It is well known some herbal compounds improve glucose metabolism by modulating insulin resistance and insulin secretion. The changes in some of the microbial metabolites from consuming plant compounds are correlated with changes to the gut microbiome that modulate glucose metabolism [9].
Aronia melanocarpa, red ginseng and shiitake mushroom have been reported to improve
mushroom have been well studied, but the whole foods, including dietary fiber, may be better for inducing changes to the gut microbiome that influence glucose metabolism. Aronia, red ginseng and shiitake mushroom have diabetic activity, their major function is anti-oxidative and anti-inflammatory properties and the direct effects on anti-diabetic activity such as insulin resistance and insulin secretion have not been examined. The relationship between anti-diabetic activity and the gut microbiome is not well characterized. We hypothesized that the combination of freeze-dried aronia, red ginseng, ultraviolet-irradiated shiitake mushroom and natokinase would prevent or reverse insulin resistance, improve insulin secretion, and help normalize serum glucose levels, due to changes in the gut microbiome. We tested the hypothesis in Px rats, a non-obese type 2 diabetic animal model.
2. Materials and methods
2.1. Preparation of the product and analysis of ingredients
Each of aronia, red ginseng, and shiitake mushroom was washed, dried at room temperature, freeze-dried, and powdered. Freeze-dried Aronia, red ginseng, shitake mushroom and natokinase were mixed with the ratio of (3.4: 4.1: 2.4:0.1) (Chakreis, AGM) and the ingredients were generously provided by YD Nutraceuticals Ltd. (Yongin-si, Korea). The freeze-dried powder mixture was used for the animal study. The mixture was extracted with in distilled water at 95°C for 12 h and the extracts were centrifuged at 10,000 × g at 4°C for 20 min. The supernatants were lyophilized in a freeze-dryer.
The mobile phase solvents were acetonitrile and 0.1% formic acid in water (6:4, v:v) with isocratic elution at a flow rate of 1 mL/min, 40°C in-column temperature, and UV detection at 270 nm. We used ginsenoside Rg, galactose, glucose and cyanidin-arabinoside as standards to quantify the sample.
The β-glucan contents of shitake mushroom was sequentially digested with digestion enzymes by incubating in lower temperature for 2 h. The enzymes used to digest the shitake mushroom were amylase (20 units, pH 6.9) at 20oC, cellulase (50 units, pH 5.0) at 37oC, protease (10 units, pH 7.5) at 37oC, and amyloglucosidase (70 units, pH 4.8) at 60 oC. The
digested shiitake mushroom was mixed with 95% ethanol and the mixture was left at 4 oC for 12 h. The mixture was centrifuged at 10,000rpm for 10 min and water was added into the precipitates. Sulfuric acid was added (1:5) into the diluted precipitate. The mixture was left at room temperature for 20 min and the optical density was measured at 470 nm. Glucose solution was used as a standard.
2.2. Animals and ethics
2.3. Experimental design
A total of 40 Px rats were assigned randomly to the following four groups, which differed according to diet: 1) 1g dextrin/kg bw (negative-control) 2) 0.5 g AGM/kg bw, 3) 1g AGM/ kg bw, and 4) 120 mg /kg bw metformin (positive-control). Each group included 10 Px rats. The sham-operated rats were given 1 g dextrin/kg bw for normal-control (n=10). All experimental animals were given free access to water and a high-fat diet containing either the assigned extracts or dextrin for 12 weeks. The high-fat diet was a modified semi-purified AIN-93 formulation for experimental animals [14] that consisted of 42% carbohydrate, 15% protein, and 43% fat. The major carbohydrate, protein, and fat sources were starch and sugar, casein (milk protein), and lard (CJ Co., Seoul, Korea), respectively.
2.4. Body composition measurement
After calibrating a dual-energy X-ray Absorptiometer (DEXA; Norland pDEXA Sabre; Norland Medical Systems Inc., Fort Atkinson, WI, USA) with a phantom supplied by the manufacturer, the body compositions of the rats were measured at the 7th week of the experimental period. The animals were anesthetized with ketamine and xylazine (100 and 10 mg/kg bw, respectively), and laid in a prone position, with the posterior legs maintained in external rotation with tape. The hip, knee, and ankle articulations were in 90° flexion. Upon the completion of scanning, lean mass was determined in the leg and hip using the DEXA instrument equipped with the appropriate software for the assessment of bone density in small animals (17). Similarly, the fat mass was measured in the leg and abdominal areas using the DEXA instrument.
2.5. Glucose homeostasis
every week. An oral glucose tolerance test (OGTT) was performed at the 7th week in overnight-fasted animals by orally administering 2 g glucose/kg body weight [15]. Blood samples were taken by tail bleeding at 0, 10, 20, 30, 40, 50, 60, 70, 80, 90, and 120 min after glucose loading. The serum insulin levels were determined at 0, 20, 40, 90, and 120 min. The averages of the total areas under the curves for the serum glucose and insulin concentrations were calculated using the trapezoidal rule. At 3 days after OGTT, an intraperitoneal insulin tolerance test (IPITT) was conducted after the food was removed for 6 h. The serum glucose levels were measured every 15 min for 90 mins after an intraperitoneal injection of insulin (0.75 U/kg body weight). Serum glucose and insulin levels were analyzed with a Glucose Analyzer II (Beckman-Coulter, Palo Alto, CA, USA) and rat Ultrasensitive insulin kit (Crystal Chem), respectively.
2.6. Hyperglycemic clamp
determined using the homeostasis model assessment estimate of insulin resistance (HOMA-IR) and calculated using the following equation: HOMA-IR = fasting insulin (µIU/mL) × fasting glucose (mM) / 22.5. Lipid profiles in the circulation were measured using colorimetry kits from Asan Pharmaceutical (Seoul, Korea).
2.7. Immunohistochemistry
Five rats from each group were injected with BrdU (100 µg/kg body weight) after 6 weeks of treatment. The rats were anesthetized intraperitoneally 6 h post-injection with a mixture of ketamine and xylazine, and the brain and pancreas was dissected immediately, perfused with saline and a 4% paraformaldehyde solution (pH 7.2) sequentially, and post-fixed with the same fixative overnight at room temperature [18].
Two serial 5-μm paraffin-embedded tissue sections were selected from the seventh or eighth sections to avoid counting the same islets twice when measuring β-cell area, BrdU incorporation, and apoptosis, as described previously using an immunohistochemistry method [18]. Endocrine β-cells were identified by applying guinea pig insulin and rabbit anti-glucagon antibodies to the sections. Pancreatic β-cell area was measured by examining all non-overlapping imagesin two insulin-stained sections from each rat at 10× magnification with a Zeiss Axiovert microscope (Carl Zeiss Microimaging, Thornwood, NY, USA). Pancreatic β -cell mass, individual -cell size, -cell proliferation by BrdU incorporation, and apoptotic
β-cell were measured as described previously [18].
2.8. Next Generation Sequencing of the gut microbiome
manufacturer’s instructions. Each library was prepared using polymerase chain reaction (PCR) products according to the GS FLX plus library prep guide. The emPCR, corresponding to clonal amplification of the purified library, was carried out using the GS-FLX plus emPCR Kit (454 Life Sciences, Branford, CT). Libraries were immobilized onto DNA capture beads. The library-beads were added to the amplification mix and oil, and the mixture was vigorously shaken on a Tissue Lyser II (Qiagen, Valencia, CA) to create "micro-reactors" containing both amplification mix and a single bead. The emulsion was dispensed into a 96-well plate and the PCR amplification program was run with 16S universal primers in the FastStart High Fidelity PCR System (Roche, Basel, Switzerland) according to the manufacturer's recommendations. Sequencing of bacterial DNA in the feces was performed by the Macrogen Ltd. (Seoul, Korea) by a Genome Sequencer FLX plus (454 Life Sciences) as previously reported.
2.9. Statistical analyses
All data are expressed as means ± standard deviations, and all statistical analyses were performed using SAS ver. 9.1 (SAS Institute, Cary, NC, USA). Significant differences among the control, AGM-L, AGM-H, Px-control and normal-control animal groups were identified with one-way analyses of variance. Significant differences in the main effects among the groups were detected using post-hoc Tukey’s tests. A p-value < 0.05 was considered significant.
3. Results
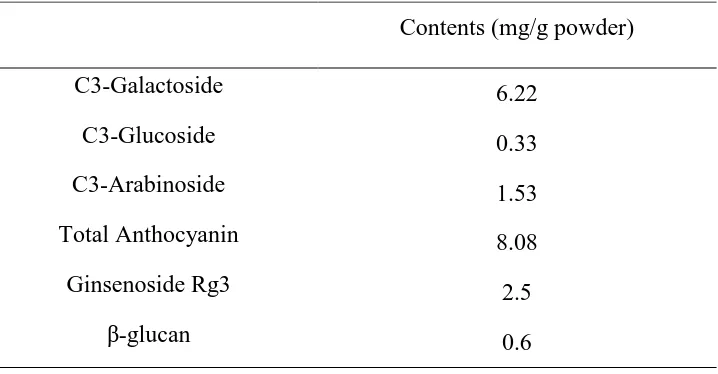
3.1. Contents of anthocyanins and ginsenoide Rg3
3.2. Body composition
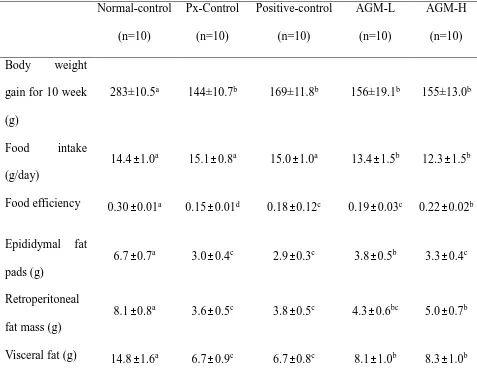
Body weight gains for 11 weeks were higher in the normal-control group than the control group whereas the positive-control and AGM-H increased body weight more than the control group but less than the normal-control (P<0.05). Unlike body weight gain, food intake was not significantly different among the groups. Food efficiency decreased in the control group compared to the normal-control group and its reduction was prevented by AGM-H the most (P<0.05). Epididymal and retroperitoneal fat contents and visceral fat mass, were much lower in the control group than the normal-control group (Table 2). The visceral fat mass was higher in the AGM-L and AGM-H groups than the positive-control group (P<0.05), but it was not significantly different between the control and positive-control groups (Table 2). Thus, less increase of body weight and fat mass might be associated with urinary glucose loss.
BMD in the lumbar spine and femur was much lower in the control-group than the normal-control group whereas AGM-L and AGM-H prevented the decrease of BMD as much as the positive-control group (P<0.05; Fig. 1A). LBM showed a similar pattern of BMD. LBM exhibited a lower value in the control group than the normal-control and AGM-L and AGM-H protected against the decrease of LBM as much as the positive-control group (P<0.05; Fig. 1B). Fat mass also showed the similar tendency to LBM (Fig. 1C).
3.3. Glucose metabolism
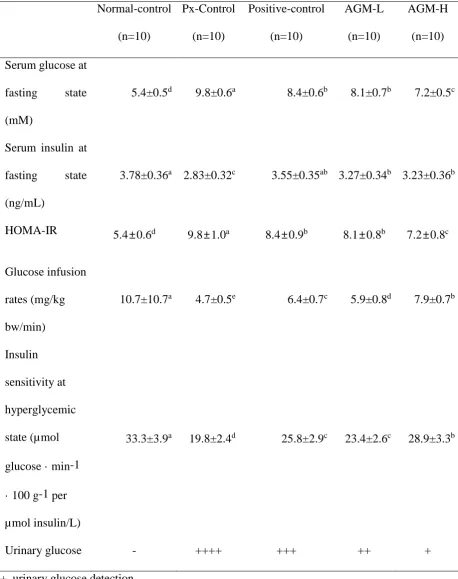
insulin levels were lower in the control group than in the normal-control group. As calculated from serum glucose and insulin levels at fasting state, HOMA-IR, an index of insulin resistance, was higher in the control group than in the normal-control (Table 3). AGM-L and positive-control group showed a similar HOMA-IR, and AGM-H was lowered the most (P<0.05).
The OGTT revealed that glucose tolerance was highly impaired in the control group compared to the normal-control group and it was improved by metformin in the positive-control group (Fig. 1A). AGM-L and AGM-H improved the glucose tolerance better than the positive-control but the improvement did not return it to normal-control group values (P<0.05; Fig. 1A). AUC of serum glucose levels during OGTT in the first phase was much higher in the control group than the normal-control group whereas AGM-L and AGM-H decreased the AUC of serum glucose levels (P<0.05; Fig. 1B). In the second phase of OGTT, AUC of serum glucose concentrations were much higher in the control group than in the normal-control group and AGM-L prevented the increase (Fig. 1B). AGM-H increased the 2nd part of the serum
insulin levels in comparison to the control but it was not significantly different.
3.4. Insulin tolerance
3.5. Hyperglycemic clamp
Serum insulin levels were much lower in the control group than normal control group for 90 min after glucose challenge (P<0.05; Fig. 4A). Serum insulin levels exhibited the 1st (0-10 min) and 2nd (60-90 min) phases in all groups. The AUC of 1st and 2nd phases of serum insulin levels increased in AGM-L the most whereas AGM-H elevated the AUC 1st and 2nd phases more than the control but less than the AGM-L (P<0.05; Fig. 4B). Glucose infusion rates during hyperglycemic clamp were much lower in the control group than the normal-control group whereas AGM-H prevented the decrease in Px rats, but the levels were less than the normal-control (P<0.05; Table 3). AGM-H showed a higher glucose infusion rates and the levels were higher than the positive-control group (P<0.05). Insulin sensitivity in the hyperglycemic state markedly decreased in the control group than the normal-control group and it was higher in the ascending order of control, AGM-H, positive-control and AGM-L (P<0.05; Table 3).
3.6. Pancreatic β-cell mass, proliferation, and apoptosis
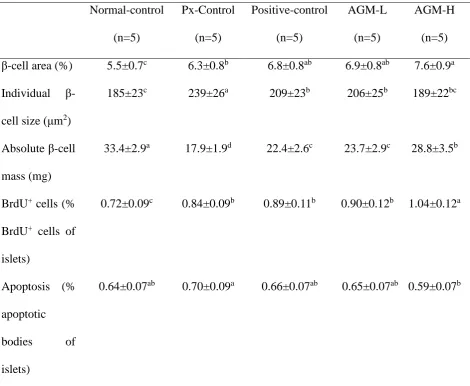
Pancreatic β-cell area is calculated by the number and individual size of β-cells. The increased number of β-cells improves diabetic status. However, individual β-cell size increases with β-cell hypertrophy that is associated with increased insulin resistance. Pancreatic β-cell
area was higher in the Px-control group than the normal-control group but individual β-cell size was higher in the control group than in the normal-control group (P<0.05; Table 4). AGM-H increased pancreatic β-cell area with smaller individual sized beta-cells, demonstrating that
AGM-H increased β-cell number (Table 4). Pancreatic β-cell mass, calculated by multiplying β-cell area by pancreatic weight, was much lower in the control group than the normal-control
AGM-L, and AGM-H (P<0.05; Table 4).
The β-cell number is balanced by β-cell proliferation and β-cell apoptosis. The Px-control rats exhibited a higher β-cell apoptosis than the positive-control rats and AGM-H decreased β -cell apoptosis (P<0.05; Table 4). The β--cell proliferation was lower in control group than the
normal-control group. AGM-H increased the β-cell proliferation (P<0.05; Table 4). Therefore, AGM-H increased β-cell mass by elevating β-cell proliferation and decreasing β-cell apoptosis.
3.7. Gut microbiome
Community composition of the gut microbiota was compared with both total and shared operational taxonomic units among the groups by analysis of molecular variance (AMOVA). The AMOVA test revealed significant differences between the fecal bacterial communities among the groups (P<0.01). Principal coordinate analysis (PCoA) illustrates the clustering of gut bacterial community (Fig. 5A). Normal-control and Px-control showed a significant separation of gut microbiota. AGM-L and AGM-H also had separate gut microbiota clustering from Px-control but they overlapped with the normal-control. However, positive-control exhibited a similar pattern to that of the Px-control group (Fig. 5A). These results indicated that diabetes modulated the composition of gut microbiome and AMG prevented the modulation of gut microbiome.
by diabetic status and AMG supplementation (Fig. 5B). The bacteria community was different among the groups in order level more than the phylum level. The percentage of Bacteroidales was much lower in the control than the normal-control and it was increased by AGM-L and AMG-H (Fig. 5C). The percentages of Erysipelotrichales and Clostridiales were higher in the control than the normal-control and they were decreased by AGM-L and AGM-H. AGM-L increased the percentage of Desulfovibrionales (P<0.05; Fig. 5C). Thus, AGM-L modulated gut microbiome to make it similar to the normal-control.
4. Discussion
Aronia, red ginseng and ultraviolet-irradiated shiitake mushroom have been reported to influence glucose metabolism. Based on a previous study, freeze-dried aronia, red ginseng and ultraviolet-irradiated shiitake mushroom were mixed at the ratio of 3.4: 4.1: 2.5 and the anti-diabetic activity was examined by assessing its efficacy for improving insulin sensitivity and potentiating insulin secretion in non-obese type 2 diabetic rats (Px rats). Px rats fed high fat diets, a well-established model of Asians type 2 diabetes, were used as the animal model for investigating the efficacy of the mixture in the present study. The Px rats had hyperglycemia due to increased insulin resistance and decreased insulin secretion. We used whole food not extracts since the gut microbiome is influenced by dietary fiber in the ingredients and antocyanins can be easily degraded due to high temperature during extraction. Aronia, red ginseng and ultraviolet-irradiated shiitake mushroom contain different effective components such as anthocyanins, ginsenoside and β-glucan with vitamin D [19-21]. The major ingredients are known to be beneficial for alleviating type 2 diabetic symptoms and they are not overlapped between the plants. Thus, the efficacy of the mixture was examined for anti-diabetic activity in the present study.
insulin resistance. Insulin resistance is due to the impairment of insulin signaling by inflammation, oxidative stress and other factors. Elevated reactive oxygen species (ROS) and proinflammatory cytokines are associated with impaired insulin signaling and β-cell function, with increasing β-cell apoptosis [22]. The decrease in ROS and proinflammatory cytokines
alleviates the diabetic symptoms [21,23]. The mixture of Aronia melanocarpa, ginseng and mushroom is a good combination for anti-diabetic activity. Aronia melanocarpa extracts are rich in anthocyanins that suppress the production of ROS and proinflammatory cytokines [24,25]. Furthermore, aronia extracts prevent hyperglycemia by inhibiting α-glucosidase activity in the small intestines, by their scavenging in humans and animal models [26,27]. Ginseng can complement the anti-diabetic activity of aronia. Ginsenosides in ginseng are known to prevent insulin resistance by activating insulin signaling in cells, animals and humans [20,28-30]. Ginseng enhances insulin secretion and increases the pancreatic β-cell mass, which has hypoglycemic effects [31]. A systematic review and meta-analysis of randomized controlled clinical trials demonstrates that ginseng modestly, but significantly, improved fasting blood glucose in non-diabetic and diabetic patients but it does not change hemoglobin A1c and plasma insulin levels [32]. However, Reeds et al. [20] reported that ginseng and ginsenoside Re do not improve insulin sensitivity and β-cell function in obese type 2 diabetic
anti-diabetic activity of the combination treatment in Px rats. The present study showed that AGM-L and AGM-H improved glucose tolerance by improving insulin resistance in a dose-dependent manner, but AGM-L potentiated glucose-stimulated insulin secretion more than AGM-H. Thus, the combination supplementation alleviated the diabetic symptoms in Px rats. The present study also showed that Px changed the body composition in comparison to the normal-control rats: Body weight and body fat were lower in Px rats compared to the normal-control rats due to increased urinary glucose loss. Fat mass was lower in the Px rats than the normal-control rats and both AGM-L and AGM-H suppressed the decrease in fat mass, but the fat mass of the AGM-L and AGM-H groups was still much lower than that of the normal-control. The suppression of fat mass loss was associated with the reduction of urinary glucose loss. The decrease of fat mass was not prevented as much as the urinary glucose loss. That may be associated with the properties of aronia and ginseng to suppress body fat synthesis and to increase skeletal muscle mass [37-39]. Furthermore, Px rats had lower BMD in the lumbar spine and femur and lower LBM in the hip and leg in comparison to the normal-control. BMD is associated with insulin sensitivity and insulin secretion. These results suggested that Px rats had diabetic symptoms of low insulin secretion and high insulin resistance. Sufficient insulin secretion increases osteoblast activity by binding to insulin receptors [40]. When osteoblasts are activated, osteocalcin is released from the bone and it binds to osteocalcin receptors that are highly expressed in pancreatic β-cells [40]. The activation of osterocalcin
receptor by binding with osteocalcin potentiates insulin secretion and also promotes insulin sensitivity. In addition, BMD is associated with peroxisome proliferator-activated receptor (PPAR)-γ activation [41]. Skeletal muscle mass is reduced by decreasing anabolic signaling in
of insulin sensitivity and potentiating insulin secretion.
The involvement of the gut microbiome in the development and progression of metabolic diseases is recognized. Qin et al. has reported that several Clostridium species are increased in type 2 diabetes, and butyrate-producing bacteria are decreased [44]. The present study also showed Clostridales and Erysipelorichales including in Fircumicultes was higher in the control than the normal-control but AMG decreased them. However, metformin treatment, the positive-control, did not alter the Fircumicultes although it improved glucose tolerance in the present study. Previous studies have shown that metformin modulates the gut microbiota composition by increasing the growth of some bacteria, such as Akkermansia muciniphila, Escherichia spp. or Lactobacillus and by decreasing the levels of some other ones like Intestinibacter [45]. However, metformin treatment has adverse effects such as diarrhea, nausea, heartburn and gas and it may negatively influence the gut microbiome. Further study is needed to elucidate the metformin effect on gut dysbiosis.The present study showed that AGM had a beneficial effect on gut dysbiosis caused by type 2 diabetes: AGM inhibited the increase of Clostridales and increased Bacterioidales in type 2 diabetes. Therefore, AMG improved glucose metabolism and prevented gut dysbiosis.
5. Conclusions
Hyperglycemia caused gut dysbiosis by increasing Fircumicultes, and AGM protected against gut dysbiosis. AGM improved glucose metabolism and lipid profiles in insulin insufficient type 2 diabetic rats, with Asian type 2 diabetes. The improved glucose metabolism protected against the decrease in BMD. Thus, AGM may be useful for preventing type 2 diabetes in Asians.
SP, MHK, and KSK participated in designing the study and writing the manuscript. BRM, MJK, HJY and HC conducted biochemical experiments. MJK and HJY quantified individual components of herbs. SK and JEK participated by conducting the animal study.
Acknowledgement
This work was supported by "Food Functionality Evaluation program" under the Ministry of Food, Agriculture, Forestry and Fisheries and the Korea Science and Engineering Foundation in Korea in 2017.
Conflicts of interest
The authors declare that they have no competing interests.
References
1. Yuan, H.; Li, X.; Wan, G.; Sun, L.; Zhu, X.; Che, F.; Yang, Z. Type 2 diabetes epidemic in east asia: A 35-year systematic trend analysis. Oncotarget 2018, 9, 6718-6727.
2. DeFronzo, R.A.; Ferrannini, E.; Groop, L.; Henry, R.R.; Herman, W.H.; Holst, J.J.; Hu, F.B.; Kahn, C.R.; Raz, I.; Shulman, G.I., et al. Type 2 diabetes mellitus. Nat Rev Dis Primers 2015, 1, 15019.
3. Kim, D.S.; Kim, B.C.; Daily, J.W.; Park, S. High genetic risk scores for impaired insulin secretory capacity doubles the risk for type 2 diabetes in asians and is exacerbated by western-type diets. Diabetes Metab Res Rev 2018, 34.
4. Yang, H.J.; Kim, M.J.; Kwon, D.Y.; Kim, D.S.; Lee, Y.H.; Kim, J.E.; Park, S. Anti-diabetic activities of gastrodia elata blume water extracts are mediated mainly by potentiating glucose-stimulated insulin secretion and increasing beta-cell mass in non-obese type 2 diabetic animals. Nutrients 2016, 8, 161.
5. Park, S.; Kim, D.S.; Kang, S. Vitamin d deficiency impairs glucose-stimulated insulin secretion and increases insulin resistance by reducing ppar-gamma expression in nonobese type 2 diabetic rats. J Nutr Biochem 2016, 27, 257-265.
hippocampal cell death and beta-cell apoptosis by decreasing pro-inflammatory cytokines in gerbils with transient artery occlusion. Exp Biol Med (Maywood) 2016, 241, 296-307. 7. Lyu, M.; Wang, Y.F.; Fan, G.W.; Wang, X.Y.; Xu, S.Y.; Zhu, Y. Balancing herbal medicine
and functional food for prevention and treatment of cardiometabolic diseases through modulating gut microbiota. Front Microbiol 2017, 8, 2146.
8. Wen, L.; Duffy, A. Factors influencing the gut microbiota, inflammation, and type 2 diabetes. J Nutr 2017, 147, 1468s-1475s.
9. Brunkwall, L.; Orho-Melander, M. The gut microbiome as a target for prevention and treatment of hyperglycaemia in type 2 diabetes: From current human evidence to future possibilities. Diabetologia 2017, 60, 943-951.
10. Parzonko, A.; Naruszewicz, M. Cardioprotective effects of aronia melanocarpa anthocynanins. From laboratory experiments to clinical practice. Curr Pharm Des 2016, 22, 174-179.
11. Grotto, D.; Bueno, D.C.; Ramos, G.K.; da Costa, S.R.; Spim, S.R.; Gerenutti, M. Assessment of the safety of the shiitake culinary-medicinal mushroom, lentinus edodes (agaricomycetes), in rats: Biochemical, hematological, and antioxidative parameters. Int J Med Mushrooms 2016, 18, 861-870.
12. Hosokawa, Y.A.; Hosokawa, H.; Chen, C.; Leahy, J.L. Mechanism of impaired glucose-potentiated insulin secretion in diabetic 90% pancreatectomy rats. Study using glucagonlike peptide-1 (7-37). J Clin Invest 1996, 97, 180-186.
13. Islam, M.S.; Wilson, R.D. Experimentally induced rodent models of type 2 diabetes. Methods Mol Biol 2012, 933, 161-174.
14. Reeves, P.G.; Nielsen, F.H.; Fahey, G.C., Jr. Ain-93 purified diets for laboratory rodents: Final report of the american institute of nutrition ad hoc writing committee on the reformulation of the ain-76a rodent diet. J Nutr 1993, 123, 1939-1951.
15. Park, S.; Kim da, S.; Kang, S. Gastrodia elata blume water extracts improve insulin resistance by decreasing body fat in diet-induced obese rats: Vanillin and 4-hydroxybenzaldehyde are the bioactive candidates. Eur J Nutr 2011, 50, 107-118.
16. Choi, S.B.; Jang, J.S.; Park, S. Estrogen and exercise may enhance beta-cell function and mass via insulin receptor substrate 2 induction in ovariectomized diabetic rats. Endocrinology 2005, 146, 4786-4794.
in rats. Diabetes 2002, 51, 1825-1833.
18. Park, S.; Hong, S.M.; Lee, J.E.; Sung, S.R. Exercise improves glucose homeostasis that has been impaired by a high-fat diet by potentiating pancreatic beta-cell function and mass through irs2 in diabetic rats. J Appl Physiol (1985) 2007, 103, 1764-1771.
19. Kamweru, P.K.; Tindibale, E.L. Vitamin d and vitamin d from ultraviolet-irradiated mushrooms (review). Int J Med Mushrooms 2016, 18, 205-214.
20. Reeds, D.N.; Patterson, B.W.; Okunade, A.; Holloszy, J.O.; Polonsky, K.S.; Klein, S. Ginseng and ginsenoside re do not improve beta-cell function or insulin sensitivity in overweight and obese subjects with impaired glucose tolerance or diabetes. Diabetes Care 2011, 34, 1071-1076.
21. Banjari, I.; Misir, A.; Savikin, K.; Jokic, S.; Molnar, M.; De Zoysa, H.K.S.; Waisundara, V.Y. Antidiabetic effects of aronia melanocarpa and its other therapeutic properties. Front Nutr 2017, 4, 53.
22. Newsholme, P.; Cruzat, V.F.; Keane, K.N.; Carlessi, R.; de Bittencourt, P.I., Jr. Molecular mechanisms of ros production and oxidative stress in diabetes. Biochem J 2016, 473, 4527-4550.
23. Pahwa, R.; Jialal, I. Hyperglycemia induces toll-like receptor activity through increased oxidative stress. Metab Syndr Relat Disord 2016, 14, 239-241.
24. Rugina, D.; Diaconeasa, Z.; Coman, C.; Bunea, A.; Socaciu, C.; Pintea, A. Chokeberry anthocyanin extract as pancreatic beta-cell protectors in two models of induced oxidative stress. Oxid Med Cell Longev 2015, 2015, 429075.
25. Zhu, W.; Jia, Q.; Wang, Y.; Zhang, Y.; Xia, M. The anthocyanin cyanidin-3-o-beta-glucoside, a flavonoid, increases hepatic glutathione synthesis and protects hepatocytes against reactive oxygen species during hyperglycemia: Involvement of a camp-pka-dependent signaling pathway. Free Radic Biol Med 2012, 52, 314-327.
26. Yamane, T.; Kozuka, M.; Konda, D.; Nakano, Y.; Nakagaki, T.; Ohkubo, I.; Ariga, H. Improvement of blood glucose levels and obesity in mice given aronia juice by inhibition of dipeptidyl peptidase iv and alpha-glucosidase. J Nutr Biochem 2016, 31, 106-112. 27. Simeonov, S.B.; Botushanov, N.P.; Karahanian, E.B.; Pavlova, M.B.; Husianitis, H.K.;
Troev, D.M. Effects of aronia melanocarpa juice as part of the dietary regimen in patients with diabetes mellitus. Folia Med (Plovdiv) 2002, 44, 20-23.
viability in min6 cells via pka-dependent pathways. Biosci Biotechnol Biochem 2008, 72, 2815-2823.
29. Lee, H.J.; Lee, Y.H.; Park, S.K.; Kang, E.S.; Kim, H.J.; Lee, Y.C.; Choi, C.S.; Park, S.E.; Ahn, C.W.; Cha, B.S., et al. Korean red ginseng (panax ginseng) improves insulin sensitivity and attenuates the development of diabetes in otsuka long-evans tokushima fatty rats. Metabolism 2009, 58, 1170-1177.
30. Park, S.H.; Oh, M.R.; Choi, E.K.; Kim, M.G.; Ha, K.C.; Lee, S.K.; Kim, Y.G.; Park, B.H.; Kim, D.S.; Chae, S.W. An 8-wk, randomized, double-blind, placebo-controlled clinical trial for the antidiabetic effects of hydrolyzed ginseng extract. J Ginseng Res 2014, 38, 239-243.
31. Kim, H.Y.; Kim, K. Regulation of signaling molecules associated with insulin action, insulin secretion and pancreatic beta-cell mass in the hypoglycemic effects of korean red ginseng in goto-kakizaki rats. J Ethnopharmacol 2012, 142, 53-58.
32. Shishtar, E.; Sievenpiper, J.L.; Djedovic, V.; Cozma, A.I.; Ha, V.; Jayalath, V.H.; Jenkins, D.J.; Meija, S.B.; de Souza, R.J.; Jovanovski, E., et al. The effect of ginseng (the genus panax) on glycemic control: A systematic review and meta-analysis of randomized controlled clinical trials. PLoS One 2014, 9, e107391.
33. Maschio, B.H.; Gentil, B.C.; Caetano, E.L.A.; Rodrigues, L.S.; Laurino, L.F.; Spim, S.R.V.; Jozala, A.F.; Dos Santos, C.A.; Grotto, D.; Gerenutti, M. Characterization of the effects of the shiitake culinary-medicinal mushroom, lentinus edodes (agaricomycetes), on severe gestational diabetes mellitus in rats. Int J Med Mushrooms 2017, 19, 991-1000.
34. Jeong, S.Y.; Kang, S.; Hua, C.S.; Ting, Z.; Park, S. Synbiotic effects of beta-glucans from cauliflower mushroom and lactobacillus fermentum on metabolic changes and gut microbiome in estrogen-deficient rats. Genes Nutr 2017, 12, 31.
35. Lee, B.K.; Park, S.; Kim, Y. Age- and gender-specific associations between low serum 25-hydroxyvitamin d level and type 2 diabetes in the korean general population: Analysis of 2008-2009 korean national health and nutrition examination survey data. Asia Pac J Clin Nutr 2012, 21, 536-546.
36. Park, S.; Ham, J.O.; Lee, B.K. A positive association of vitamin d deficiency and sarcopenia in 50 year old women, but not men. Clin Nutr 2014, 33, 900-905.
38. Shin, S.S.; Yoon, M. Korean red ginseng (panax ginseng) inhibits obesity and improves lipid metabolism in high fat diet-fed castrated mice. J Ethnopharmacol 2018, 210, 80-87. 39. Sikora, J.; Broncel, M.; Markowicz, M.; Chalubinski, M.; Wojdan, K.; Mikiciuk-Olasik, E. Short-term supplementation with aronia melanocarpa extract improves platelet aggregation, clotting, and fibrinolysis in patients with metabolic syndrome. Eur J Nutr 2012, 51, 549-556.
40. Liang, J.; Lian, S.; Qian, X.; Wang, N.; Huang, H.; Yao, J.; Tang, K.; Chen, L.; Li, L.; Lin, W., et al. Association between bone mineral density and pancreatic beta-cell function in elderly men and postmenopausal women. J Endocr Soc 2017, 1, 1085-1094.
41. Lecka-Czernik, B. Diabetes, bone and glucose-lowering agents: Basic biology. Diabetologia 2017, 60, 1163-1169.
42. Gao, Y.; Yang, M.F.; Su, Y.P.; Jiang, H.M.; You, X.J.; Yang, Y.J.; Zhang, H.L. Ginsenoside re reduces insulin resistance through activation of ppar-gamma pathway and inhibition of tnf-alpha production. J Ethnopharmacol 2013, 147, 509-516.
43. Mollah, M.L.; Kim, G.S.; Moon, H.K.; Chung, S.K.; Cheon, Y.P.; Kim, J.K.; Kim, K.S. Antiobesity effects of wild ginseng (panax ginseng c.A. Meyer) mediated by ppar-gamma, glut4 and lpl in ob/ob mice. Phytother Res 2009, 23, 220-225.
44. Forslund, K.; Hildebrand, F.; Nielsen, T.; Falony, G.; Le Chatelier, E.; Sunagawa, S.; Prifti, E.; Vieira-Silva, S.; Gudmundsdottir, V.; Pedersen, H.K., et al. Disentangling type 2 diabetes and metformin treatment signatures in the human gut microbiota. Nature 2015, 528, 262-266.
45. Rodriguez, J.; Hiel, S.; Delzenne, N.M. Metformin: Old friend, new ways of action-implication of the gut microbiome? Curr Opin Clin Nutr Metab Care 2018.
Figure legends
Fig. 1. Bone mineral density (BMD), lean body mass (LMB) and fat mass (FM) at the end of experiment
positive-control) for 12 weeks. Sham rats fed the same diet of Px-control. BMD (A) in the lumbar spine and femurs, LBM (B) of the hip and legs and FM of the abdomen and legs (C) were measured by DEXA.
Each bar and error bar represents the mean ± SD (n=10).
a,b
Different superscripts on the bars represent significant differences at p < 0.05.
Fig. 2. Serum glucose and insulin levels and area under the curve (AUC) of serum glucose and insulin during oral glucose tolerance test (OGTT)
Px rats fed a high fat diet supplemented with aronia, red ginseng, shiitake mushroom, and natokinase powders 1) 0.5 g mixture/kg bw/day L), 2) 1g mixture/kg bw/day (AGM-H), 3) 1 g dextrin /kg bw/ day (Px-control), or 4) metformin (120 mg/kg body weight; positive-control) for 12 weeks. Sham rats fed the same diet of Px-control. Changes of serum glucose levels (A) were measured after orally giving 2 g of glucose/kg body weight. The average of the area under the curve (AUC) of glucose (B) and insulin (C) during the first part (0-40 min) and second part (40-120 min) of OGTT.
Each dot and bar and error bar represent the mean±SD (n=10). *Significantly different among the groups at P<0.05.
a,b,c
Different superscripts on the bars represent significant differences at p < 0.05.
Fig. 3. Changes of serum glucose concentrations during the intraperitoneal insulin tolerance test (IPITT)
positive-control) for 12 weeks. Sham rats fed the same diet of Px-control. IPITT was conducted with intraperitoneal injection of 0.75 IU insulin/kg body weight and measured serum glucose concentrations in blood collected from the tail every 15 min for 90 min. Changes of serum glucose levels were measured during IPITT (A). The average of the area under the curve (AUC) of glucose (B) during the first part (0-45 min) and second part (45-120 min) of IPITT. Each dot and bar and error bar represents the mean±SD (n=10).
*Significantly different among the groups at P<0.05.
a,b,c
Different superscripts on the bars represent significant differences at p < 0.05.
Fig. 4. Insulin secretion during hyperglycemic clamp
Px rats fed a high fat diet supplemented with aronia, red ginseng, shiitake mushroom, and natokinase powders 1) 0.5 g mixture/kg bw/day L), 2) 1g mixture/kg bw/day (AGM-H), 3) 1 g dextrin /kg bw/ day (Px-control), or 4) metformin (120 mg/kg body weight; positive-control) for 12 weeks. Sham rats fed the same diet of Px-control. Hyperglycemic clamp was conducted in conscious, free moving, and overnight fasted rats to measure glucose-stimulated insulin secretion. As exogenous glucose was infused into jugular vein to make approximately 5.5 mM above overnight fasted serum glucose levels, serum insulin levels were measured at 0, 2, 5, 10, 30, 60, 90 and 120 mins.
Each dot and bar and error bar represents the mean±SD (n=10). *Significantly different among the groups at P<0.05.
a,b,c
Different superscripts on the bars represent significant differences at p < 0.05.
Fig. 5. The profiles of gut microbiomes
Table 1. The contents of ingredients in the mixture
Contents (mg/g powder)
C3-Galactoside 6.22
C3-Glucoside 0.33
C3-Arabinoside 1.53
Total Anthocyanin 8.08
Ginsenoside Rg3 2.5
Table 2. Glucose metabolism during hyperglycemic clamp
Food efficiency: daily energy intake/daily weight gain *100.
Values are means±standard deviation. The test product was the mixture of free-dried aronia, red ginseng, mushroom and natokinase. Px rats fed a high fat diet supplemented with 1) 0.5 g mixture/kg bw/day (AGM-L), 2) 1g mixture/kg bw/day (AGM-H), 3) 1 g dextrin /kg bw/ day (Px-control), or 4) metformin (120 mg/kg body weight; positive-control) for 12 weeks. Sham-operated rats (normal-control) fed the same diet of Px-control.
a,b,c
Values on the same row with different superscripts were significantly different at p < 0.05. Normal-control (n=10) Px-Control (n=10) Positive-control (n=10) AGM-L (n=10) AGM-H (n=10) Body weight
gain for 10 week (g)
283±10.5a 144±10.7b 169±11.8b 156±19.1b 155±13.0b
Food intake (g/day)
14.4±1.0a 15.1±0.8a 15.0±1.0a 13.4±1.5b 12.3±1.5b
Food efficiency 0.30±0.01a 0.15±0.01d 0.18±0.12c 0.19±0.03c 0.22±0.02b
Epididymal fat pads (g)
6.7±0.7a 3.0±0.4c 2.9±0.3c 3.8±0.5b 3.3±0.4c
Retroperitoneal fat mass (g)
8.1±0.8a 3.6±0.5c 3.8±0.5c 4.3±0.6bc 5.0±0.7b
Table 3. Glucose metabolism during hyperglycemic clamp
+, urinary glucose detection.
Values are means±standard deviation. The test product was the mixture of free-dried aronia, red ginseng, mushroom and natokinase. Px rats fed a high fat diet supplemented with 1) 0.5 g
Normal-control (n=10) Px-Control (n=10) Positive-control (n=10) AGM-L (n=10) AGM-H (n=10) Serum glucose at
fasting state (mM)
5.4±0.5d 9.8±0.6a 8.4±0.6b 8.1±0.7b 7.2±0.5c
Serum insulin at fasting state (ng/mL)
3.78±0.36a 2.83±0.32c 3.55±0.35ab 3.27±0.34b 3.23±0.36b
HOMA-IR 5.4±0.6d 9.8±1.0a 8.4±0.9b 8.1±0.8b 7.2±0.8c
Glucose infusion rates (mg/kg bw/min)
10.7±10.7a 4.7±0.5e 6.4±0.7c 5.9±0.8d 7.9±0.7b
Insulin sensitivity at hyperglycemic state (µmol glucose · min-1 · 100 g-1 per µmol insulin/L)
33.3±3.9a 19.8±2.4d 25.8±2.9c 23.4±2.6c 28.9±3.3b
mixture/kg bw/day (AGM-L), 2) 1g mixture/kg bw/day (AGM-H), 3) 1 g dextrin /kg bw/ day (Px-control), or 4) metformin (120 mg/kg body weight; positive-control) for 12 weeks. Sham-operated rats (normal-control) fed the same diet of Px-control.
a,b,c,d
Table 4. The modulation of islet morphometry in the pancreas section
Values are means±standard deviation. The test product was the mixture of free-dried aronia, red ginseng, mushroom and natokinase. Px rats fed a high fat diet supplemented with 1) 0.5 g mixture/kg bw/day (AGM-L), 2) 1g mixture/kg bw/day (AGM-H), 3) 1 g dextrin /kg bw/ day (Px-control), or 4) metformin (120 mg/kg body weight; positive-control) for 12 weeks. Sham-operated rats (normal-control) fed the same diet of Px-control.
a,b,c,d
Values on the same row with different superscripts were significantly different at p < 0.05. Normal-control (n=5) Px-Control (n=5) Positive-control (n=5) AGM-L (n=5) AGM-H (n=5)
β-cell area (%) 5.5±0.7c 6.3±0.8b 6.8±0.8ab 6.9±0.8ab 7.6±0.9a
Individual β -cell size (μm2)
185±23c 239±26a 209±23b 206±25b 189±22bc
Absolute β-cell mass (mg)
33.4±2.9a 17.9±1.9d 22.4±2.6c 23.7±2.9c 28.8±3.5b
BrdU+ cells (% BrdU+ cells of islets)
0.72±0.09c 0.84±0.09b 0.89±0.11b 0.90±0.12b 1.04±0.12a
Apoptosis (% apoptotic
bodies of islets)