20th International Conference on Structural Mechanics in Reactor Technology (SMiRT 20) Espoo, Finland, August 9-14, 2009 SMiRT 20-Division 6, Paper 3140
A new device for the study of early-age cracking in massive concrete structures
Briffaut Matthieu
a,b, Benboudjema Farid
a, Nahas Georges
a,b, and Torrenti Jean-Michel
ca
LMT Cachan/ENS Cachan/CNRS UMR8535/UPMC/PRES UniverSud Paris, Cachan, France, e-mail: [email protected]
b Institut de radioprotection et de sûreté nucléaire, Fontenay-aux-Roses, France c
LCPC, Université Paris Est, Paris, France
Keywords: restrained ring test, endogenous and thermal shrinkage, massive concrete structures, early age concrete.
1
ABSTRACT
At early-age in massive concrete structures, cracking may occur during hardening. Indeed, hydration is an exothermic chemical reaction. Therefore, if endogenous and thermal strains are restrained, compressive stresses and then traction stresses rise, which can exceed the concrete strength and cause crossing crack.
The restrained shrinkage ring which is a good method to determine the concrete behaviour (strain and cracking) due to the endogenous and drying shrinkage showed that at 20°C and without drying, the endogenous shrinkage amplitude of our mix is not high enough to cause cracking. Therefore, a new test has been developed to study cracking due to restrained thermal shrinkage. With this new test, crack has effectively been obtained and a chemo-thermo-mechanical model can correctly predict the cracking time if the basic creep is taken into account.
2
INTRODUCTION
At early-age in massive concrete structures, cracking may occur during hardening. Indeed, hydration is an exothermic chemical reaction (temperature in concrete may overcome 60°C). Therefore, if endogenous and thermal strains are restrained, compressive stresses and then traction stresses rise, which can exceed the concrete strength (in an elastic finite element calculation). This cracking may increase significantly the concrete wall permeability.
The restrained shrinkage ring is a good method to determine the mortar behaviour (strain and cracking) due to the endogenous and drying shrinkage. In this study, a concrete mix which is representative of nuclear power plant containment is tested. This test showed that at 20°C and without drying (cf. figure1), the amplitude of endogenous shrinkage is not high enough to cause cracking. Indeed, in this configuration, thermal shrinkage does not occur. Therefore, a new device needs to be developed to study cracking due to restrained thermal shrinkage.
3
NEW TEST PRESENTATION
This new test is an evolution of the restrained shrinkage ring test which allows to take into account the endogenous shrinkage and also the thermal shrinkage.
3.1 “Classical” restrained shrinkage ring test presentation
Figure 1:Ring test geometry
3.2 New restrained shrinkage ring test presentation
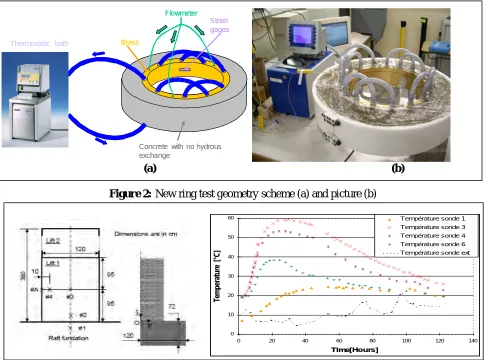
The new test aims to predict the behaviour and the cracking at early age of massive structures (especially the nuclear power plant containment). The new test principle is to increase the temperature of the brass ring in order to expand it. In this case, expansion of ring is restrained by the extern concrete layer, which induced compressive stresses in the ring and therefore tensile stresses in concrete. The temperature evolution of the brass ring is piloted by a fluid circulation into the ring (fig.2). The new test objectives are to reproduce similar stress rate that can occur in a “real’ massive wall (calculated by finite element simulations from experimental temperature data, cf. figure 3).
Thermostatic bath
Flowmeter
Concrete with no hydrous exchange
Brass
Strain gages
Thermostatic bath
Flowmeter
Concrete with no hydrous exchange
Brass
Strain gages
(a) (b)
Figure 2:New ring test geometry scheme (a) and picture (b)
0 10 20 30 40 50 60
0 20 40 60 80 100 120 140
Time[Hours]
T
em
p
er
at
u
re
[
°C
]
Température sonde 1
Température sonde 3
Température sonde 4 Température sonde 6
Température sonde ext
50cm
7cm
7cm
Brass : width 2cm
Concrete without hydrous
exchange
Stress profile
Ris Ros
EW TEST NUMERICAL VALIDATION
4.1 Numerical model
In order to verify that cracking will really occur, the new test has been modelled with a finite element code (Cast3M, developed by the French atomic energy commission). We use a model developed by Benboudjema and Torrenti (2008). This one is a thermo-chemo-elastic-damage model.
The prediction of cracking needs a numerical resolution due to the complexity of the behaviour of concrete at early-age. In our model, the following phenomena are taken into account:
The evolution of hydration: this is achieved here by the use of a chemical affinity Ulm and Coussy, (1998):
( )
!
"
#
$
%
&
'
=
RT
E
A
aexp
~
(
(
&
(1)where Ea is the activation energy, R is the perfect gaz constant, T is the temperature,
!
is the
hydration degree and
A
~
( )
!
is the chemical affinity
The evolution of temperature: The energy balance equation, which includes the release of heat due to the hydration reaction, is solved:
(
)
!
&
&
k
T
L
T
C
=
"
"
+
(2)where C is the volumetric heat capacity, T is the temperature, L the latent hydration heat and k is the thermal conductivity
The evolutions of endogenous and thermal strains; 1
å&au =#
"
!
& for!
>!
0(3)
Where åau is the endogenous strain and
!
a coefficientand
å
&
th=
"
!
T
&
1
(4)
Where
å
th is the endogenous strain and!
the thermal dilation coefficientThe evolution of Young modulus and tensile strength with respect to the hydration degree by the use of De Schutter laws (1996, 1997):
( )
B
aB
!!
"
#
$$
%
&
'
'
=
( (
0 0
)
)
)
)
)
where B is the mechanical variable and a coefficient (5)The description of cracking in tension: elastic damage model developed by Mazars, (1986) slightly modified:
(
)
ó
ó
=
1
!
D
~
(6)Where óis the apparent stress and D is the damage
and ó~& =E
( )
"
å&el =E( )(
"
å&!å&au!å&th)
(7)
where ó~is the effective stress, Eis the concrete young modulus, åelis the elastic strain and
å
is the total strain4.2 Numerical results
For a first approach, a bilinear evolution of the temperature was taken. At the beginning the ring temperature is maintained at 20°C. Then, at 25 hours (when the peak of temperature is attempted; see figure 2), the brass ring temperature increases linearly with a rate of 0.35°C/h.
Figure 4 :
example of damage map ( local model ; mesh size : 7mm)
Although we didn’t take into account the creep in this model, the first numerical results seem to show that cracking will effectively be obtain with our new test (for suitable values of temperatures) and that the early-age behaviour and cracking evolution due to restrained endogenous and thermal shrinkage will be study.
5
EXPERIMENTAL RESULTS
5.1 Mechanical characteristics
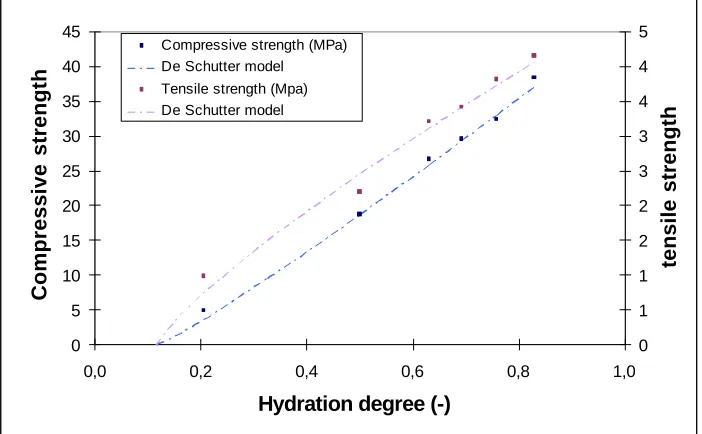
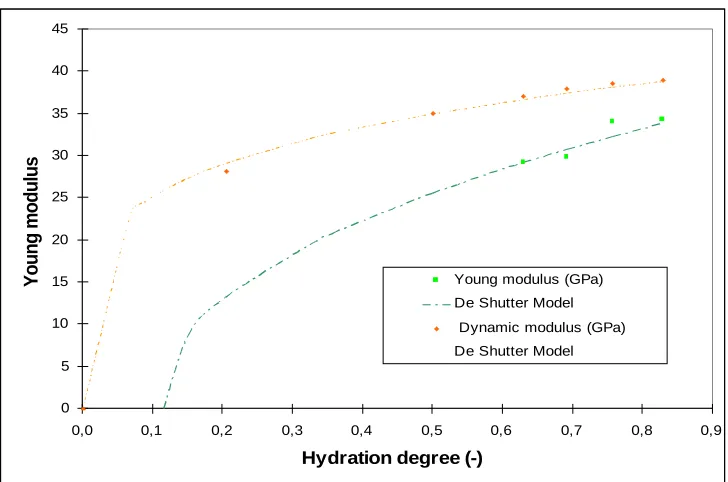
To take into account these phenomena, several parameters have to be identified. Therefore, several tests were performed and some results from the literature were used. The results of the mechanical tests are shown in figure 3 and table 1 (the tensile strength is determined by a Brazilian test). These tests show us that the compressive strength and the tensile strength versus the hydration degree are quite linear. Moreover, the dynamic Young modulus (determined by ultra-sonic test) cannot be use for a predictive value of the static Young modulus because it gives an overestimated value. Note that the ratio between the static and dynamic Young modulus is not a constant value during the concrete hydration (Byfors,1980). The De Schutter laws coefficients and mechanical threshold value are given in the table 1 (the mechanical threshold is assumed to be the same for the three evolution).
0 5 10 15 20 25 30 35 40 45
0,0 0,2 0,4 0,6 0,8 1,0
Hydration degree (-)
C
o
m
p
re
s
s
iv
e
s
tr
e
n
g
th
0 1 1 2 2 3 3 4 4 5
te
n
s
il
e
s
tr
e
n
g
th
0 5 10 15 20 25 30 35 40 45
0,0 0,1 0,2 0,3 0,4 0,5 0,6 0,7 0,8 0,9 Hydration degree (-)
Y
o
u
n
g
m
o
d
u
lu
s
Young modulus (GPa) De Shutter Model Dynamic modulus (GPa) De Shutter Model
Figure 5: Mechanicals characteristics evolutions
Table 1. De Schutter laws parameters
Estat Rc Rt
ξ0 0.115
A 0.449 1.105 0.806
5.2 Chemo –thermal characteristics
The description of concrete hydration is obtained by a semi-adiabatic test (QAB test figure 6, LCPC). In this test the temperature evolution of a concrete specimen in an insulated box is measured. Then, with a correction to take into account the heat losses, the adiabatic evolution of the concrete is calculated .This
evolution is the base of the chemical affinity (
A
~
( )
!
) and total hydration heat release (L) calculation (for the implementation in the finite element code Cast3m, we use a polynomial fit of the chemical affinity).(a)
(b)
Figure 6:QAB test picture (a) and chemical affinity evolution (b)
Chemical affinity evolution
0 200 400 600 800 1000 1200 1400
0,00 0,10 0,20 0,30 0,40 0,50 0,60 0,70 0,80 0,90
hydration degree
C
h
e
m
ic
a
l
a
ff
in
it
y
(
1
/s
) Affinité QAB
5.3 New ring test results
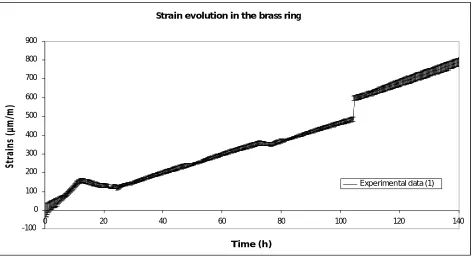
The outputs of the new test are the brass ring and the concrete temperature measured by thermocouple (figure 7) and the brass ring deformation measured by three strain gages on the internal radius of the ring (figure 8).
20 25 30 35 40 45 50 55 60
0 20 40 60 80 100 120
Time (h)
T
e
m
p
e
ra
tu
re
(
°
C
)
External temperature
Concrete temperature
Brass temperature ( 2 TC average)
Figure 7:New ring test temperature evolution
Although the temperature is punctually imposed by the fluid circulation in this test, the figure 7 shows that a quite homogeneous temperature in the ring is obtained (the two temperature probes are placed on the same diameter). At the beginning of the test (first 24h), the temperature evolution is due to the hydration reaction. Then, the temperature rise is imposed by the thermostatic bath with a rate of 0,35°C/h. Near the middle of the test, a stable period at 42,8°C permit us to verify that the device doesn’t have too much inertia.
Strain evolution in the brass ring
-100 0 100 200 300 400 500 600 700 800 900
0 20 40 60 80 100 120 140
Time (h)
St
ra
in
s
(µ
m
/m
)
test which is translated on the strain evolution by a gap. Crack occurs for a brass ring temperature value of 51,5°C (experimental crack width was about 650µm). Moreover, the brass ring solicitations seem to be uniform because the three strain gages measures are quite similar.
At the beginning of the test, the strain is due to the temperature evolution of the system. Then, when the brass ring temperature is imposed by the fluid circulation, the ring strain is a combination of the brass ring and the concrete ring thermal dilatation. Like the thermal dilatation coefficient of the brass is about 3 times higher than the concrete one, the expansion of the brass ring is restrained by the concrete ring which induces tensile stress in the ring. When the concrete tensile strength exceeds the concrete tensile strength, crack occurs.
In this test, it is really interesting to note that only one crack is obtained and that it is a crossing crack. Effectively, the crack crosses the entire concrete specimen section but furthermore the crack crosses the concrete aggregate.
6
COMPARISON BETWEEN EXPERIMENTAL AND NUMERICAL RESULTS
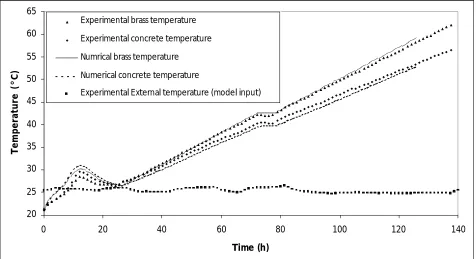
The figure 9 and 10 compare the experimental data and the numerical results for respectively the thermal and strain evolutions. A good global accordance between experimental thermal data and thermal model is obtained. Nevertheless, the temperatures predicted by the model due to the hydration (first 24h) are slightly overestimated probably due to the convective coefficient which has not been experimentally determined. Note that is the simulation the external temperature data is an input of the model.
20 25 30 35 40 45 50 55 60 65
0 20 40 60 80 100 120 140
Time (h)
T
e
m
p
e
ra
tu
re
(
°
C
)
Experimental brass temperature
Experimental concrete temperature
Numrical brass temperature
Numerical concrete temperature
Experimental External temperature (model input)
20 120 220 320 420 520 620 720 820 920
0 20 40 60 80 100 120 140
Time (h)
T
em
p
er
at
u
re
(
°
C
)
Experimental brass strain
Numrical brass strain (visco-elastic)
Numerical brass strain (Elastic)
Numerical brass strain (Elastic-Damage)
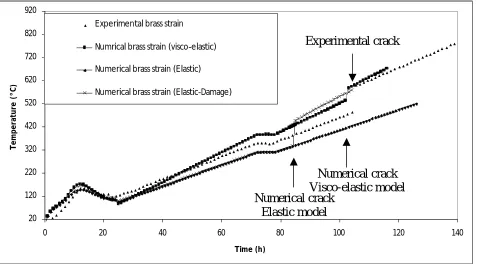
Figure 10:New ring test strains evolution comparison
Like temperatures are slightly overestimated during the first 24h of the test, the strains predicted by the model are also overestimated. The elastic model predicts a crack of the concrete ring earlier than the experimental results. But the addition of a basic creep model implemented by Benboudjema and Torrenti (2008) which relax the concrete stress gives a better accuracy of the cracking time. This model uses a Kelvin-Voigt chain which depends on the hydration degree which was an idea proposed by De Schutter (1999).The basic creep parameters are determined from test performed by Granger (1996) in compression.
7
CONCLUSION AND OUTLOOK
In this study, a new device for the early age behaviour and cracking has been developed. This new test was needed because the classical restrained ring test which didn’t take into account the thermal strains was not able with our mix to reproduce the real stress which can occurs in massive structures and didn’t allowed us to study early age concrete cracking.
The new device is an evolution of the restrained shrinkage ring test. The thermal strain effects are created by an expansion of the brass ring the reproduce the stresses rate of a real massive structure The expansion of the ring is done the a fluid circulation into the ring.
Firstly, a numerical validation of the test was done and shows that we effectively obtained crack for suitable value of temperature (about 50°C). Then, the new test was performed and crack was experimentally obtained. Mechanical simulation with elastic damage model predicts a too earlier cracking but with an addition of a basic creep model, the cracking time can be correctly predicted.
To improve the strains model evolution, a campaign to study the early age tensile creep has to be performed. Finally, in this study, it was really important to obtain cracking because the outlook of the new test is to study the permeability evolution of a massive structure due to the early age cracking.
8
REFERENCES
Benboudjema, Torrenti, 2008 Early-age behaviour of concrete nuclear containments
Experimental crack
Numerical crack
Elastic model
Commissariat à l'Energie Atomique CEA - DEN/DM2S/SEMT, Cast3m finite element code, available at http://www-cast3m.cea.fr/
De Schutter G, Taerwe L (1996), Degree of hydration based description of mechanical properties of early-age concrete, Materials and Structure, 29, pp335-344
De Schutter G., Taerwe L. (1997), Fracture energy of concrete at early ages, Materials and Structures, 30, p. 67-71
De Schutter G. (1999), Degree of hydration based Kelvin model for the basic creep of early age concrete, Materials and Structures,32, p. 260-265.
Grzybowski, Shah, (1989) Model to predict cracking in fiber reinforced concrete due to restrained shrinkage. Mag Concrete Res, 41 :125–135
Mazars J. (1986) A description of micro and macroscale damage of concrete structures, Engineering Fracture Mechanics, 25(5:6), p. 729-737.
Paillère, Serrano, (1976). Appareil d’étude de la fissuration du béton. Bulletin de liaison du Laboratoire Centrale des Ponts et Chaussées n.83, Laboratoire Centrale des Ponts et Chaussées
Swamy, Starvides, (1979) Influence of fibber reinforcement on restrained shrinkage and cracking. ACI Journal proceedings, 76[3] :443–460