Application of the Leak Flow Rate Calculation Program FLORA to
Real Cracks in Piping
O. Herbst l), N. Huber 2) and W. Kastner l)
1) Framatome ANP GmbH, Dept. Thermal Hydraulics and Fluid Dynamics, Erlangen, Germany 2) Siemens AG, Corporate Technology, Erlangen, Germany
A B S T R A C T
Detecting the presence of subcritical cracks in reactor coolant pressure boundaries is essential for the Leak-Before-Break concept. The selection and the optimal design of the leakage monitoring system for this task requires the pre-calculation of the leakage rates to be anticipated. In the case of fluid release the failure analysis based on a post-calculation of the leakage rates is of importance, too.
Framatome ANP, formerly Siemens Nuclear Power, uses the program FLORA (FLOw RAte) to calculate the mass flux through the crack by thermal-hydraulic analysis. This program which is based on experimental, analytical and numerical investigations enables flow rate calculations covering
• discharge rates over the entire thermodynamic range,
• discharge opening geometries from finest cracks up to complete pipe breaks, and
• leak flow rates from single droplets up to critical discharge (sonic velocity through cracks/pipe breaks).
The applicability for laminar and turbulent conditions in cracks both in the cases of continuous leakages and of dropping leakages has been validated with the aid of measured leakages through real cracks in power plant piping. Due to safe design and intensive non-destructive testing activities, only few cases of through-wall cracking failures causing leakage in German nuclear power plant systems have occurred in the past. From the Siemens data base, which collects failure data of nuclear power systems, five cases which are characteristic for the most frequent occurring failure mechanisms were chosen. Two cases led to significant leakage rates, the other three cases resulted in the discharge of only droplets. In this paper the evaluation concept for leakage rates is introduced, and the features of the current version of FLORA are demonstrated.
I N T R O D U C T I O N
Design, material selection, manufacture and operation of reactor coolant pressure boundaries at German nuclear power plants must comply with the requirements which are set down, for example, in the guidelines of the German Reactor Safety Commission (RSK) for pressurized water reactors (3 rd edition dated Oct. 14, 1981). If these criteria are met, failure due to manufacturing defects can be ruled out, i.e. the components are designed according to the "basis safety" concept. Since any incipient cracks would grow only very slowly, taking several years to reach a critical size that could lead to complete failure of the component concerned, the reactor coolant pressure boundary must be continuously monitored for leakage to detect the presence of subcritical cracks. The selection and the optimal design of the leakage monitoring system for this task requires the pre-calculation of the leakage rates to be anticipated. In the case of fluid release contaminating the environment the failure analysis based on a post-calculation of the leakage rates could be of importance, too.
For the calculation of leakage rates, as a first step the crack geometry and leakage area of such subcritical cracks have to be evaluated. This can be done by fracture mechanics analyses which are detailed in [ 1], [2]. In a second step Framatome ANP uses the program FLORA (FLOw RAte) to calculate the mass flux through the crack by thermal-hydraulic analysis. Finally the knowledge of leakage area and mass flux yields to the leakage rate.
C O N C E P T F O R L E A K A G E R A T E C A L C U L A T I O N
In the case of a through-wall crack in a pressurized component caused b y , for example, cyclical thermal loads or fatigue due to stresses or vibrations, a certain mass flow (leakage rate) discharges from the fluid reservoir. The flow out of the discharge opening is essentially determined by the stagnation conditions, namely pressure and temperature of the fluid, and by the hydraulic resistance coefficient related to the flow path and the leakage geometry. If the ratio of the stagnation pressure to the ambient pressure would exceed a certain limit, critical discharge takes place. In this case the fluid reaches sonic velocity. In addition, a change from single-phase water flow to two-phase steam/water flow can occur due to the pressure drop along the flow path through the crack.
SMiRT 16, Washington DC, August 2001 Paper # 1919
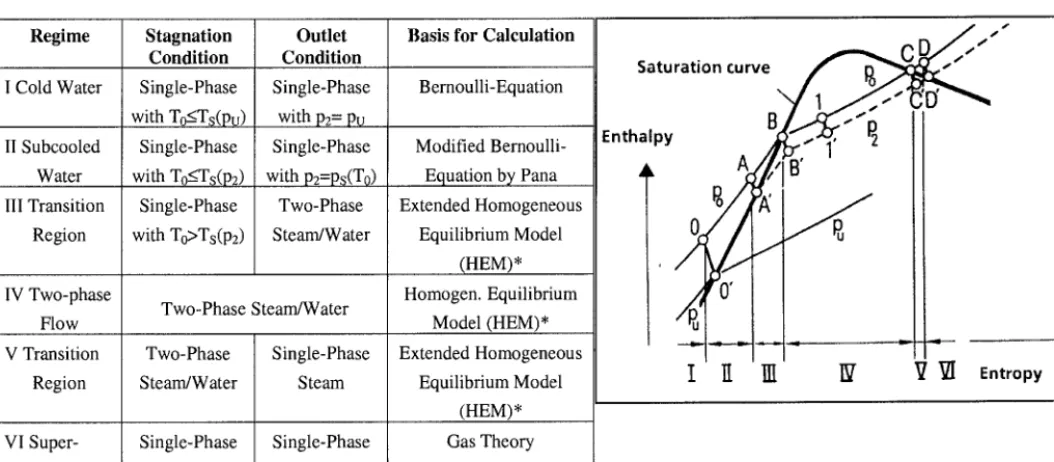
These different fluid conditions are taken into account by e.g. the Pana model (GRS), which enables discharge rates to be determined over the entire thermodynamic range by selecting relevant correlations for each special condition (see Figure 1). The Pana model is described in [3], [4]. However, one feature of it should be pointed out here:
Two different calculation methods can be used in the two-phase steam/water flow region. The model proposed by Moody [5] which is implemented in FLORA considers separated water and steam phases with different flow velocities. Such a separation is expected particularly for large leakage areas. The Moody model leads to correspondingly high leakage rates in the region of low fluid subcooling or low steam qualities. In contrast to that, no separation of water and steam phase is possible in the homogeneous equilibrium model according to, for example, Linzer [6]. This condition can be expected for leakages through narrow cracks and slits, and leads in the region just below or just above the enthalpy of saturated water to leakage rates which are lower than those ones resulting from the Moody model.
According to extensive investigations in the discharge of two-phase flow by Kt~rner [7] and Friedel [8], the homogeneous model is an appropriate approach for the evaluation of leakage rates through narrow cracks in power plant piping.
Regime
I Cold Water
II Subcooled Water III Transition
Region
IV Two-phase Flow V Transition
Region
VI Super- heated Steam
Stagnation Condition
Single-Phase with To___Ts(ptj)
Single-Phase with To_<Ts(P2)
Single-Phase with To>Ts(P2)
Outlet Condition
Single-Phase with p2 = Pu Single-Phase with p2=Ps(T0)
Two-Phase Steam/Water
Two-Phase Steam/Water
Two-Phase Steam/Water
Single-Phase Steam
Single-Phase Steam
Single-Phase Steam
Basis for Calculation
Bernoulli-Equation
Modified Bernoulli- Equation by Pana Extended Homogeneous
Equilibrium Model (HEM)* Homogen. Equilibrium
Model (HEM)* Extended Homogeneous
Equilibrium Model (HEM)* Gas Theory
* An alternative model (Moody-model) can be implemented
s , I
Saturation curve
.. ~ ~ .Enthalpy
S ~ ~
J
I
I ]~
IN I~ r 7 ~IEntropy
Fig. 1 Calculation Concept by Pana (GRS)
V
NECESSARY INPUT P A R A M E T E R S
In most cases the fluid stagnation conditions necessary for the calculation of leakage rates are given or can be determined in a simple manner and with sufficient accuracy. On the contrary, the correct input of the hydraulic resistance coefficient of the flow path and the discharge opening geometry is not that easy. In general, the values of crack length, maximum crack opening displacements and the shape of the crack contour respectively according to fracture mechanics methods are not sufficient to describe the complete crack geometry relevant for the leakage. Additional data concerning the geometrical characteristics of the leakage path particularly for the crack flanks topography are required, since these have an essential influence on the hydraulic resistance.
For the calculation of the hydraulic resistance coefficient the correlation
(total = (inlet + (crack + (outlet
(1)t
(crack = d , . ~ (2)
d h
where A represents the friction factor, t the length of the flow path (i.e. the wall thickness of the cracked pipe), and d h the hydraulic diameter of the discharge opening
A L
d h = 4 . (3)
eL
with A L as the leakage area and PL as the perimeter.
Clnlet
COutlet
C O D ~ k = 0 . 2 =r
COD~k= 18
" - - - - , ,
, -- ~ : _ .
COD~k=80
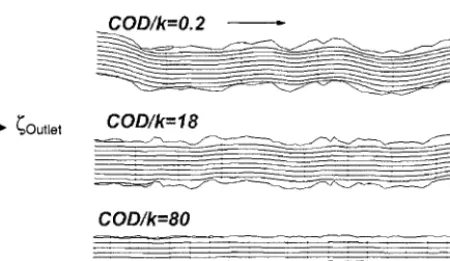
Leakage path through crack Flowlines in cracks with different size and roughness
Fig. 2 Crack Geometry, Parameters
For the evaluation of friction factors both extensive investigations have been performed at Framatome ANP, formerly Siemens Nuclear Power, and a collection of all data concerning real cracks which are available in the worldwide literature has been completed. In addition, for some cases numerical calculations have been performed with the finite volume program CFX-TASCflow [ 11]. Two of the programs applications to real cracks in power plants are introduced in the following:
For a crack with higher leakage rate the roughness shape of the top and bottom side crack surface was scanned and digitized for a 2-D crack flow simulation. The distance between both crack sides corresponds to the crack opening displacement (COD). Since real cracks are highly irregular, an appropriate spatial resolution was used for the computational grid generation. Additionally large inlet and outlet regions were chosen for an accurate consideration of both the acceleration in front of the crack and the outlet free jet. These regions as well as the velocity distributions are shown in Figure 3.
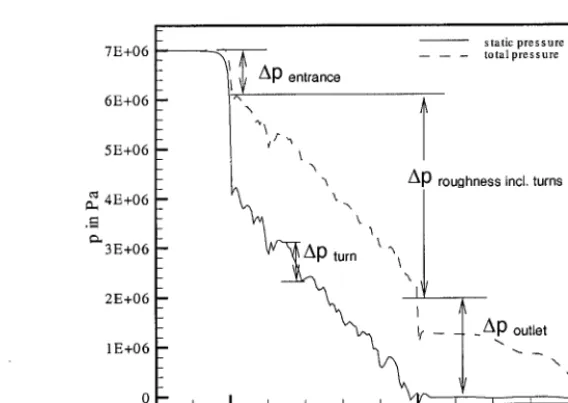
For characterization of the total pressure drop the computed pressure distribution along the flow path from inlet to outlet of the crack is considered (see Figure 4). Friction factor and hydraulic resistance coefficient can be determined from the computational results.
For the case of a dropping leakage the required computational grid was generated from a photograph of a normal view on the crack surface, see Figure 5. The structure similar to a maple-leaf (Fig. 5 left) corresponds to the real crack. After scanning the crack photograph, see Figure 5 right side, an image analysis program was used to calculate the detailed roughness topography which has been scaled to be in agreement with the results of a quantitative analysis of metallographic micrographs. Combined with the discharge opening geometry and the perimeter of the crack the final 3-D computational grid was developed.
Fig. 3 Inlet and Outlet Region of a Numerical Crack Flow Simulation (Case 1). Acceleration, Vena Contracta, Laminar Profile as well as Outlet Free Jet Appear in the Crack of Rough Wall Confinement.
Fig. 4
7E+06
6E+06
5E+06
4E+06
3E+06
2E+06
1E+06
_:---~, ~, tso'taailW::Tr; °
_ ' Ap entrance
_ \,'/" ~\
- "
-,.,.
A p roughness incl. turns_ Ap turn \ ~\ [
" >
, t ou, e,
_ , , , , , , ~ , , , , ~ _
0 0.005
xinm
Computed Pressure Distribution Through the Crack (Case 1). Contributions like Inlet, Turns in the Flow Path or Outlet can be Evaluated.
. . . A
' !
''OW--I
" direction ,?~:~ ... .,~:!~ ....
Photograph of normal view Processed Image
Fig. 5 Surface of Real Crack (Case 2)
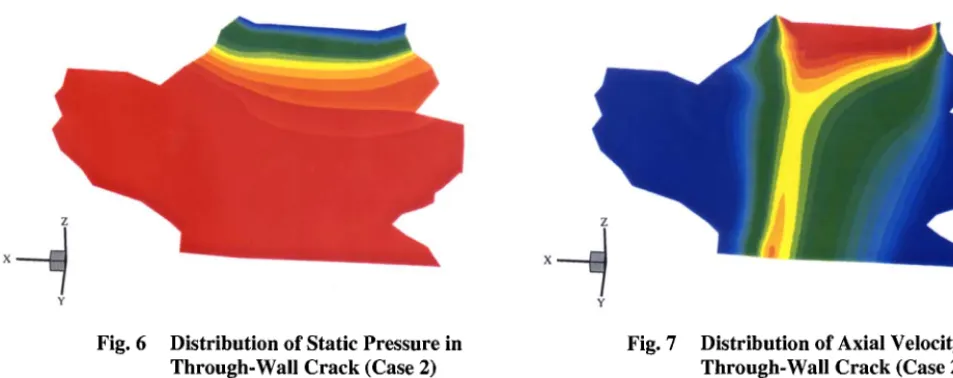
P: 7.30E+04 1.11E+06 2.16E+06 3.20E+06 4.24E+06 5.28E+06 6.32E+06 i n P a
v: 3.85E+00 1.74E+01 3.11E+01 4.47E+01 5.83E+01 7.19E+01 8.55E+01
in m/s
x
Y Y
Fig. 6 Distribution of Static Pressure in Fig. 7
Through-Wall Crack (Case 2)
Distribution of Axial Velocity in Through-Wall Crack (Case 2)
According to the performed experimental, analytical and numerical investigations a new correlation for the evaluation of the friction factor A was developed
E
dh 1-2
A - 2. log 1+3.71. k (4)
which can be applied for laminar and turbulent conditions in cracks and slits both in the cases of continuous leakages and of dropping leakages.
Based on the calculation model of Pana and on the investigations described in this chapter the current version of the
program FLORA was developed.
L E A K A G E R A T E C A L C U L A T I O N P R O G R A M F L O R A
The leakage calculation concept detailed above connects correlations for all possible fluid conditions, i.e. discharge of single-phase water, two-phase steam/water mixture and single-phase steam. With respect to this
• for cold water the Bernoulli equation
• for moderate subcooled water a modification of the Bernoulli equation
• for saturated water and two-phase mixtures the homogeneous equilibrium model, modified for a flow affected by friction or the model proposed by Moody and
• for saturated and superheated steam the gas theory, modified for a flow affected by friction
were selected and linked together, see Figure 1. This method of calculation of flow discharge under steady-state condition implemented in the FLORA program has two noteworthy advantages:
It determines discharge rates over the entire thermodynamic range
It is easy-to-handle, i.e. as input parameters only stagnation conditions (pressure P 0 ' temperature T O or steam quality 2 0 ) and the geometry of the discharge opening have to be known. The hydraulic resistance coefficient ~ of the discharge opening is calculated automatically.
FLORA enables flow rate calculations covering
• discharge opening geometries from finest cracks up to complete pipe breaks, and
• leak flow rates from single droplets up to critical discharge (sonic velocity through cracks/pipe breaks)
The program runs under Windows NT ®, Windows 95 ® or 98 ® and uses easy-to-handle masks for entering and editing stagnation conditions and flow paths (Figure 8), as well as crack geometries (Figure 9). Beneath single data sets complete data bases with a variety of both stagnation conditions and flow paths or crack geometries can be handled by the program. The results are stored in Excel®-sheets which can be used for further data analyses.
~;FiI~/!E~:II?:::'::~ :.::. " .. . , : " : " : . i : " : : .: . • : ' . . . " . : ": " ...
................... . .. . . .. . . . .. . . . .. . . .. . . . .. . . .. . . . • . . . . ~: C r ~ k , ~ . ~ : - - - - . . . : : . : ... . '::::::::-::i: ... :-::-:-- i-iV '-~ ... ' - - : - : " ~ ~
• : I ........................ , c':~c~-
~:..::.. . : " ' • _ : _ .... ~ ~III~I~ : - ~ ,,
• -,- - - - -- i I ~oo ~ ' . ~': , .. . : . :I,
~ - : 7 - - - ~ :n:::.~i::,_~:_.:~: u ,:~.;=1:~;::~:::
; . . : . . . : . . . : . . . •., . . .
200 ~ 1.701764.. ~
250 1.701764..
250 0 1.701764. 1
300 0 1 701764 .. 1
300 0 1 701764_ 2
... ... I ~ : _ d ... ' ... : .... I ~
11
1 1 ~ 1 z
.:[ 2 I00 I 21
:13 loo 1 2!
/ 4 I00 1 2!
!
/
/
t U i:::::3i~l+- a - - -' ' ...
... ._.: ... : . ~ _ : . ::- ., i . , : - :
. ~ , - - - 2 c - - - ~ - ! : ~ . . : T ! ~ ~- ....
I b , ,.-- • :, ,
~ ) , ~ U I , ... : ,::U. J = ~ • ,- 7 7 7 7 ~ ,, ]2 n:i.:.::-: :.:,:-:?U - ~ " " . . . . • : , ,
/ - ~
niii-, ?,~ ,~u
\ ) ~ U i : : : , : U :i
Fig. 8 Mask for Editing Stagnation Conditions and Flow Path Fig. 9 Mask for Editing Crack
Geometry
P R O G R A M VALIDATION
The program FLORA was validated at first with the aid of extended experimental studies performed by Framatome ANP, formerly Siemens Nuclear Power, and with data bases found in the literature. However, more important are comparisons with leakages through real cracks in, for example, power plant piping.
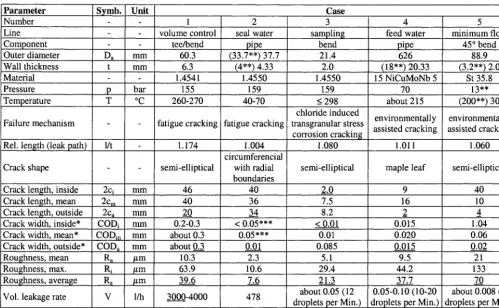
Due to safe design and intensive non-destructive testing activities, only few cases of through-wall cracking failures causing leakage in nuclear power plant systems have occurred in the past. From the Siemens SDM-data base, which collects failure data of nuclear power systems, five cases which are characteristic for the most frequent occurring failure mechanisms were chosen. Two cases led to significant leakage rates, three cases resulted in the discharge of only droplets [ 10]. The cases are described in brief as follows:
Case 1"
Case 2"
Case 3"
Case 4"
Case 5'
High cycle fatigue crack in an austenitic tube (material 1.4541). The crack originated in longitudinal direction at the inner surface and was oriented slightly bowed in axial direction. Due to (unexpected) additional torsional stresses the crack propagation through the wall was considerably bowed.
High cycle fatigue crack in a small diameter austenitic tube weld (1.4550). The crack originated at the inner surface along the root notch of a circumferential weld to a flange. The crack propagation through the wall was very straight and the cracking was oriented in circumferential direction.
Transgranular stress corrosion cracking in a small diameter austenitic tube bend (1.4550) caused by chloride contamination and humidity at the outer surface of the tube. The cracking originated at the outer surface and was oriented longitudinally.
Environmentally assisted cracking in the weld metal of a ferritic feed water line (material 15 NiCuMoNb5). The cracking originated at the inner surface and was oriented longitudinally to the tube axis. As the cracking was restricted to the weld metal the shape of the crack was somewhat atypic ("maple-leaf'), see also numerical calculations above (figures 5 to 7).
Low-cycle fatigue cracking in the neutral phase of a ferritic tube bend (material St 35.8). The cracking originated at the inner surface, the orientation of the crack was longitudinal and the crack propagation was enhanced by corrosion.
Parameter Symb. Unit
Number - -
Line - -
Component - -
Outer diameter D a mm
Wall thickness t mm
Material - -
Pressure p bar
Temperature T °C
Failure mechanism
Rel. length (leak path) 1/t -
Crack shape
Crack length, inside 2Ca mm
Crack length, mean 2c m mm
Crack length, outside 2Ca mm
Crack width, inside* CODa mm
Crack width, mean* COD m mm
Crack width, outside* COD a mm
Roughness, mean R, /zm
Roughness, max. R t ~m
Roughness, average R z /.tm
Vol. leakage rate V l/h
* Without load
Table 1: E x a m p l e s of Failures in N P P s
Case
1 2 3 4 5
volume control tee/bend 60.3 6.3 1.4541 seal water pipe (33.7**) 37.7 (4**)4.33 1.4550 sampling bend 21.4 2.0 1.4550 feed water pipe 626 (18**) 20.33 15 NiCuMoNb 5
minimum flow 45 ° bend
88.9 (3.2**) 2.0
St 35.8
155 159 159 70 13"*
260-270 40-70 < 298 about 215 (200**) 30
chloride induced transgranular stress
corrosion cracking fatigue cracking
1.004
fatigue cracking environmentally
assisted cracking 1.011 maple leaf 1.174 semi-elliptical circumferencial with radial boundaries 1.080 semi-elliptical environmentally assisted cracking 1.060 semi-elliptical
46 40 , 2.0 9 40
40 36 7.5 16 10
20 34 8.2 2 4
0.2-0.3 < 0.05*** <0.01 0.015 1.04
about 0.3 0.05*** ! 0.01 0.020 1 0.06
0.085
0.01 0.015
about 0.3 0.02
10.3 2.3 , 5.1 9.5 [ 21
63.9 10.6 29.4 44.2 133
39.6 21.3
about 0.05 (12 droplets per Man.) 3000-4000
7.6 37.7
0.05-0.10 (10-20 droplets per Man.) *** Estimated dimensions 478
** Design values
70 about 0.008 (2 droplets per Man.)
To obtain numerical data for the description of the geometrical characteristics of real leakage paths, e.g. formed by cracking with different failure mechanisms, a quantitative analysis of metallographic or fractographic micrographs was performed with respect to the microscopic roughness, the length of the crack path through the wall, the macroscopic dimensions, the shape of the crack contour, and the crack opening displacement under no-load conditions. As real cracks often do not run perpendicular through the wall, a semiautomatic image analysis system was used to measure the length of
the shortest leakage path through the wall in a metallographic section. The result is expressed in terms of l/t-ratio, where l
corresponds to the length of the leakage path and t to the wall thickness.
For the evaluation of the microscopic roughness, the crack path was digitized in x/y coordinates with the x-direction corresponding to the direction of cracking and the y-direction perpendicular to x and the crack surface. Depending on the magnification of the photomicrograph, the method is sensitive in the roughness range from 10 to about 500 #m. The
numerical description of the roughness of the leakage path was performed by the use of the parameters R a (mean
roughness), R t (maximum peak value) and R z (floating average).
R E S U L T S
i
Comparisons between leakage rates evaluated/observed in these real cracks of power plants and the post-calculations using the current version of FLORA are shown in Figure 10.
The correlations for determining the friction factor implemented in the former version of FLORA and described in [ 10] were not applicable for cases 3 to 5, since their lower limit assessed by experiments lay in the range of 0.01 kg/s or 30 l/h, respectively. But the cases 3 to 5 show the most common behavior of very small leakages (only some droplets per minute). The new correlation for the evaluation of the friction factor (see above) allows for the calculation of the cases with dropping leakages, too.
From Figure 10 good agreement between calculation and measurement can be observed. Even the calculated leakages of cases 3 and 4 are very close to the measured ones, whereas case 5 is somewhat overestimated. Admittedly the design value of the stagnation pressure only and no measured actual value is available for this case (see Table 1).
0 . J u . "o
m
o
100
10
0.1
0.01
Case
5Case
3I ICase4
Fig. 10: FLORA Calculation Results for Real Cracks (Cases I to 5)
SUMMARY
The leak rate program FLORA developed at Siemens Nuclear Power has been used to evaluate leak rates for several real crack events in power plant piping. Two of these have relatively large leak rates, the others show very small dropping leakages.
The real cracks were investigated in detail with respect to the geometric characteristics of the crack paths and the microscopic roughness. To get reasonable agreement of measured and calculated leak rates, it is necessary to use these detailed informations on the crack topography.
The comparisons between calculation and measurements show satisfactory agreement even in the cases of dropping leakages and therefore demonstrate the applicability of the new FLORA version for the complete leak flow range from single droplets up to critical discharge.
REFERENCES
.
.
.
.
6.
.
.
10.
11.
E. Keim, G. Senski, R. Wellein, W. Kastner, "Strategy for fracture assessment of pipings in the ductile regime",
Transaction of the SMIRT-14, Lyon, France, August 17-22, 1997
G. Bartholom6, E. Keim, W. Kastner, W. Knoblach, R. Wellein, "Application of LBB in German NPP", Specialist Meeting on Leak-Before-Break in Reactor Piping and Vessels, LBB '95, Lyon, France, Oct. 9-11, 1995
P. Pana, "A modified Bernoulli-equation for the critical flow discharge in the subcooled region", CSNI-Paper, Paris, May 16-17, 1974
P. Pana, M. MUller, "Subcooled and two-phase critical flow states and comparison with data", Nucl. Engng. And Design 45 (1978), pp. 117-125
F.J. Moody, "Maximum two-phase vessel blowdown from pipes", General Electric APED-4827, 1965
V. Linzer, "Das Ausstr(Smen von Siedewasser und Sattdampf aus Behfiltern", Brennstoff-Wiirme-Krafl 22 (1970) 10 S. 470-476
St. K6rner, L. Friedel, "Phase distribution and bubble velocity in two-phase slit flow", Int. J. of Multiphase Flow 25
(1999), pp. 1181-1194
St. K~Srner, L. Friedel, "Assessment of the maximum possible superheating of fluids during leakage flow", Chem. Eng. Technol. 21 (3), pp. 267-271
Fachverband Dampfkessel-, Behfilter und Rohrleitungsbau e.V. (FDBR), "FDBR-Handbuch Wiirme- und Str6mungstechnik", FDBR, Mai 1972
H. Grebner, W. Kastner, A. H6fler, G. Maugner, "Experiences with Leak Rate Calculation Methods for LBB