ABSTRACT
NOOSHAFARIN, MOHAMMADZADEH. An Optimization Approach for Integrating Different Roof Functions with Environmental Impacts Constraint: “A Hybrid Framework”. (Under the direction of Dr. Soolyeon Cho)
The roof, as part of the building envelope, is one of the most important areas in sustainable
building development. Various roof design strategies have been developed for reducing
building energy usage, generating energy, improving water retention, and waterproofing.
These strategies are actively utilized due to a vast amount of interest in maximizing the
utilization of building spaces, including roof area. However, challenges to finding integral
optimal solutions include sustainability, funding, and environmental recognition.
Although sustainable roof design technologies have been utilized and improved in prior roof
design efforts, they are mostly focused on a single technology, such as green roof, cool roof,
or solar energy generation by PV panel installation. It is quite obvious that if more than one
sustainable roof design strategy can be applied in a contingent way, additional valuable effects
can be achieved. This requires creating a quantitative relationship among the spectrums of roof
performance factors.
Integrating different roof functions is of interest to building practitioners in order to meet
certain criteria in terms of energy efficiency, cost effectiveness, and environmental impact.
This research presents an enhanced roof system and framework that integrates multiple roof
functions and optimizes desired roof performance.
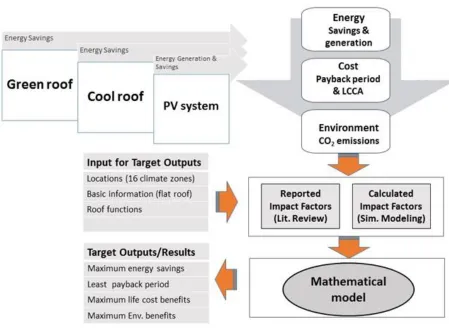
The proposed framework contains a mathematical optimization model as a core, with inputs
measurements. Energy analysis, which was carried out through roof energy simulations, plays
a major role in this framework. The proposed framework incorporates various roof design technologies’ quantitative analysis results on energy and cost savings with respect to
environmental impacts. The findings of this research have been implemented in a
computational engine developed in the Excel/VBA environment. From a theoretical
standpoint, a set of diverse inputs have been fed into the model to validate the resulting outputs.
These further tests verify the framework’s faithful implementation. To explore the climate
impact and identify design parameters that significantly impact energy and environment,
simulations of a prototype office building are conducted for U.S. cities in different climate
conditions. In all buildings, energy simulations for different roof functions and conventional
© Copyright 2016 Nooshafarin Mohammadzadeh
An Optimization Approach for Integrating Different Roof Functions with Environmental Impacts Constraint: “A Hybrid Framework”
by
Nooshafarin Mohammadzadeh
A dissertation submitted to the Graduate Faculty of North Carolina State University
in partial fulfillment of the requirements for the Degree of
Doctor of Philosophy
Design
Raleigh, North Carolina 2016
APPROVED BY:
Dr. Soolyeon. Cho, Committee Chair
Dr. Jianxin Hu,
ii
DEDICATION
I dedicate this dissertation to my beloved parents, Soheila Lashani and Hossein
Mohammadzadeh and my beloved sisters Nilufar & Nazanin Mohammadzadeh, for their
unwavering love, support and encouragement.
I also dedicate this dissertation to my lovely family who have supported me throughout this
long-term study process.
I would also like to thank my best friends in Raleigh, Dr. Hamid Kazem, Farshad Ramizi,
Dr. Behzad Aghdashi, Samaneh Fakhimi, Adele Moatti, Mahboubeh Ameri, Simin Imanirad,
Dr. Morteza Ashouri, Dr. Aliashghar Marjani, Pegah Pooya and Amir Ghanbari. They
encouraged and supported me during period of my PhD studies, and I have lots of good
memories with them.
iii
BIOGRAPHY
Nooshafarin Mohammadzadeh received her Master’s degree in Architecture from International
University of Ghazvin and Bachelor’s degree in Architectural engineering from Esfahan Azad
University, Iran. She joined Building Energy Technology Lab (BETlab) at North Carolina
State University (NCSU) at 2012. As a graduate research assistant, she contributed in
high-performance building design, energy-efficient systems design, renewable energy systems
integration, thermal comfort analysis and building energy optimization. Noosha has conducted
extensive research on the integration of roof systems and energy analysis in buildings
iv
ACKNOWLEDGMENTS
I would like to thank my advisor and committee chair Dr. Soolyeon Cho for the extensive
guidance, expertise, constant support and advice he has given me throughout my graduate
program. A special thank you goes to Professor Art Rice for kindly accepting to be a member
of my advisory committee. Thank you to Dr. Timothy Johnson for his guidance valuable
support and expertise in many facets of this research program. Thanks you to Dr. Jianxin Hu
for his constructive comments.
Thank you to my family and friends for giving me support and encouragement in all that I do.
Finally, I extend my heartfelt gratitude to my parents for all that they have done for me.
v
TABLE OF CONTENTS
LIST OF TABLES ... vii
LIST OF FIGURES ... viii
LIST OF SYMBOLS ... xii
Chapter 1 INTRODUCTION...1
Research Overview ... 1
Research Questions ... 2
Research Goal ... 3
Objectives of Research ... 4
Chapter 2 LITERATURE REVIEW ...5
State of The Art ... 5
Integrated Roof Systems ... 5
Definition of terms ... 5
Energy Performance ... 5
Building Simulation programs ... 8
Spectral Properties of Solar Radiation ... 10
Cost Analysis ... 13
Environmental Performance ... 14
Roof system technologies ... 15
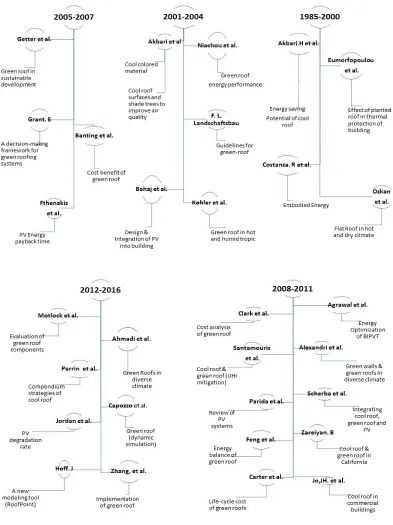
Literature Review on Roof systems ... 36
Details of Findings from Previous Work ... 39
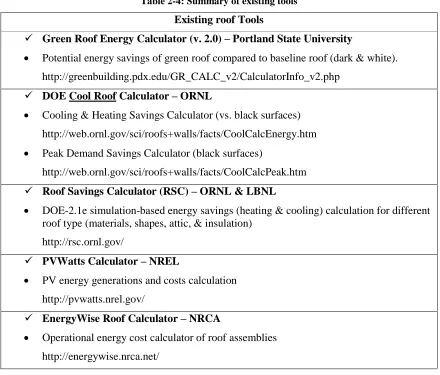
Studies of Existing tool for Roof Functions ... 43
Findings about existing tools: ... 49
Summary of literature review ... 50
Chapter 3 METHODOLOGY ... 52
Conceptual Framework ... 52
Assumptions ... 55
Theoretical Aspects of Engineering Economic Analysis ... 56
NPV Analysis ... 56
Optimization Model ... 61
Decision variables: ... 61
Objective Function ... 61
Variables Definitions ... 63
vi
Mathematical Model’s Parameters Estimation ... 70
Chapter 4 VERIFICATION AND VALIDATION ... 100
Implementation (Tool Development) ... 100
Preliminary Energy Simulation ... 103
Maximum necessary percentage of PV system ... 109
Numerical Results: ... 123
Numerical results for a one-story building (Fairbanks, Las Vegas, Los Angeles) ... 124
Case Study: Duke Environment Hall ... 149
Environment Hall green Features... 150
Numerical Results of Environment Hall: ... 153
Sensitivity analysis ... 163
Chapter 5 SUMMARY, CONCLUSIONS, AND FUTURE WORK ... 169
REFERENCES ... 174
APPENDICES ... 187
Appendix 1: TOOL DEVELOPMENT ... 188
Appendix 2: ANALYSIS RESULTS OF 16 REPRESENTATIVE CITIES: ... 195
1 Story Building: ... 195
vii
LIST OF TABLES
Table 2-1: Typical minimum cool roof requirement, California energy commission ... 19
Table 2-2: Standard course depths for different types of roof-greening [65] ... 23
Table 2-3: Different types of green roof based on LAI and soil depth [66] ... 24
Table 2-4: Summary of existing tools... 45
Table 2-5: Different roof functions ... 48
Table 3-1: Different types of green roof based on LAI and soil depth [66] ... 73
Table 3-2: Different types of Cool roofs ... 74
Table 3-3: Different types of PV systems [77] ... 74
Table 3-4: Summary of recent solar PV installed system costs [77] ... 75
Table 3-5: Business Energy Investment Tax Credit [146] ... 77
Table 3-6: PV installation cost ... 78
Table 3-7: Installation costs, maintenance costs, energy reduction obtained from literature ... 79
Table 3-8: CO2 emissions from U.S. electricity generation by source, 2014, [158] ... 95
Table 3-9: Gas Carbon Equivalent [39] ... 96
Table 3-10: Carbon footprint calculator ... 97
Table 3-11 Emission Factor ... 98
Table 4-1: Energy per conditioned building area– 1 story building (Albuquerque to Helena) ... 105
Table 4-2: Energy per conditioned building area– 1 story building (Houston to Seattle) ... 106
Table 4-3: Energy per conditioned building area– 2 story building (Albuquerque to Helena) ... 107
Table 4-4: Energy per conditioned building area– 2 story building (Houston to Seattle) ... 108
Table 4-5: 16 representative cities ... 123
Table 4-6: Percentage of different roof types as a function of different environmental impacts ... 132
Table 4-7: Percentage of different roof types as a function of different environmental impacts ... 140
Table 4-8: Percentage of different roof types as a function of different environmental impacts ... 148
Table 4-9: Percentage of different roof types as a function of different environmental impacts ... 161
viii
LIST OF FIGURES
Figure 2-1: Atmospheric solar spectra [36] ... 11
Figure 2-2: Grid-connected photovoltaic system [40]... 13
Figure 2-3: a) Spectral solar power distribution, (b) Solar spectral reflectance of cool and standard brown surfaces [51] ... 20
Figure 2-4: Temperature distribution of the green roof at a given diurnal time [68] ... 26
Figure 2-5: PV systems Components [75] ... 31
Figure 2-6: PV Arrays Are Composed of Modules that Are Composed of Cells [75] ... 32
Figure 2-7: PV Material [77] ... 34
Figure 2-8: Intensity of sunlight in mid-day in June and December [86] ... 36
Figure 2-9 : Summary of key findings from previous studies ... 38
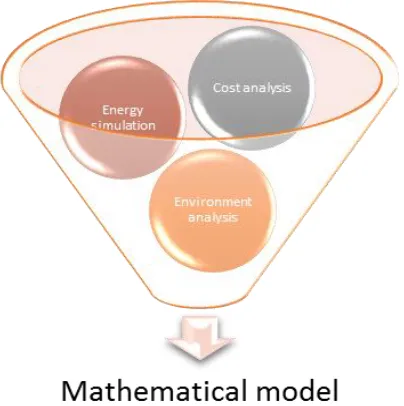
Figure 3-1: Conceptual framework ... 53
Figure 3-2: High level analysis framework... 54
Figure 3-3: Uniform series of cash flow [135] ... 57
Figure 3-4: Cash flow diagram involving a positive uniform gradient [136] ... 58
Figure 3-5: Geometric Gradient based cash flows [137] ... 58
Figure 3-6: Future to present value [138] ... 59
Figure 3-7: Average Electricity Cost to the Ultimate Customers (Cents per Kilowatt hour) [141] ... 71
Figure 3-8: energy profile of Florida [142] ... 72
Figure 3-9: PV power costs ($/Wp) as function of module efficiency and areal cost [144] ... 75
Figure 3-10: Cost of PV panel from 1995 to 2020 [77, 145] ... 76
Figure 3-11: Cell efficiencies improvement ... 82
Figure 3-12: Calculation procedure for EnergyPlus simulation ... 84
Figure 3-13: Annual heat balance of a green roof for varying leaf albedos [73] ... 86
Figure 3-14: Heat gain through roof for varying Leaf Area Index [73] ... 88
Figure 4-1: The main page of RFO in Excel/VBA environment... 100
Figure 4-2: Second page of RFO in Excel/VBA environment ... 101
Figure 4-3: Third page of RFO in Excel/VBA environment ... 102
Figure 4-4: Optimization calculation MATLAB script ... 103
Figure 4-5: Electricity need and electricity generation for San Francisco ... 111
Figure 4-6: Electricity need and electricity generation for San Francisco ... 111
Figure 4-7: Electricity need and electricity generation for San Francisco ... 111
ix
Figure 4-9: Electricity need and electricity generation for Minneapolis ... 112
Figure 4-10: Electricity need and electricity generation for Miami ... 112
Figure 4-11: Electricity need and electricity generation for Los Angeles ... 113
Figure 4-12: Electricity need and electricity generation for Las Vegas ... 113
Figure 4-13: Electricity need and electricity generation for Helena ... 113
Figure 4-14: Electricity need and electricity generation for Fairbanks ... 114
Figure 4-15: Electricity need and electricity generation for Duluth ... 114
Figure 4-16: Electricity need and electricity generation for Denver ... 114
Figure 4-17: Electricity need and electricity generation for Chicago ... 114
Figure 4-18: Electricity need and electricity generation for Baltimore ... 115
Figure 4-19: Electricity need and electricity generation for Atlanta ... 115
Figure 4-20: Electricity need and electricity generation for Houston ... 115
Figure 4-21: Electricity need and electricity generation for Albuquerque ... 116
Figure 4-22: Electricity need and electricity generation for Seattle ... 116
Figure 4-23: Electricity need and electricity generation for San Francisco (100% PV system) ... 117
Figure 4-24: Electricity need and electricity generation for San Francisco (80% PV system) ... 117
Figure 4-25: Electricity need and electricity generation for San Francisco (60% PV system) ... 117
Figure 4-26: Electricity need and electricity generation for Atlanta ... 118
Figure 4-27: Electricity need and electricity generation for Baltimore ... 118
Figure 4-28: Electricity need and electricity generation for Denver ... 118
Figure 4-29: Electricity need and electricity generation for Helena ... 119
Figure 4-30: Electricity need and electricity generation for Los Angeles ... 119
Figure 4-31: Electricity need and electricity generation for Seattle ... 119
Figure 4-32: Electricity need and electricity generation for Albuquerque ... 119
Figure 4-33: Electricity need and electricity generation for Chicago ... 120
Figure 4-34: Electricity need and electricity generation for Duluth ... 120
Figure 4-35: Electricity need and electricity generation for Fairbanks ... 120
Figure 4-36: Electricity need and electricity generation for Houston ... 121
Figure 4-37: Electricity need and electricity generation for Las Vegas ... 121
Figure 4-38: Electricity need and electricity generation for Miami ... 121
Figure 4-39: Electricity need and electricity generation for Minneapolis ... 122
Figure 4-40: Electricity need and electricity generation for Phoenix... 122
Figure 4-41: DOE climate zone classification... 123
x
Figure 4-43: Life-time energy cost savings ... 125
Figure 4-44: Annual energy generation ... 126
Figure 4-45: Lifetime energy generation costs ... 126
Figure 4-46: Life-Cycle cost analysis, green roofs ... 127
Figure 4-47: Life-Cycle Cost Analysis, Cool roofs ... 128
Figure 4-48: Life-Cycle Cost Analysis, PV Systems ... 129
Figure 4-49: Estimated payback periods ... 130
Figure 4-50: Avoided CO2 emissions (kg/lifetime) ... 131
Figure 4-51: Percentage of different roof types as a function of different environmental impacts ... 133
Figure 4-52: Annual energy savings kWh.ft2.yr ... 134
Figure 4-53: Energy cost savings ($/ft2.yr) ... 134
Figure 4-54: Annual energy generation ... 135
Figure 4-55: Energy generation costs ... 135
Figure 4-56: Life-cycle cost analysis of different green roofs ... 136
Figure 4-57: Life-cycle cost analysis of different cool roofs ... 137
Figure 4-58: Life-cycle cost analysis ... 138
Figure 4-59: Estimated payback periods ... 138
Figure 4-60: Avoided CO2 emissions (kg/lifetime) ... 139
Figure 4-61: Percentage of different roof types as a function of different environmental impacts ... 141
Figure 4-62: Annual energy savings (kWh/ft2.yr) ... 142
Figure 4-63: Energy Cost savings ($/ft2.yr)... 142
Figure 4-64: Annual energy generation (kWh/ft2.yr) ... 143
Figure 4-65: Energy generation costs ($/ft2.yr) ... 143
Figure 4-66: Life-cycle cost analysis of different types of green roofs ... 144
Figure 4-67: Life-cycle cost analysis of different types of cool roofs ... 145
Figure 4-68: Life-cycle cost analysis of different types of PV systems ... 146
Figure 4-69: Avoided CO2 emissions ... 146
Figure 4-70: Estimated payback periods ... 147
Figure 4-71: Percentage of different roof types as a function of different environmental impacts ... 149
Figure 4-72: Duke Environment Hall ... 150
Figure 4-73: The Rooftop Garden, Environment Hall [166] ... 151
Figure 4-74: Photovoltaic Rooftop Panels [166]... 152
Figure 4-75: Solar PV cells ... 152
xi
Figure 4-77: Total electricity consumption [165] ... 153
Figure 4-78: Environment Hall model [164] ... 154
Figure 4-79: Electricity produced by photovoltaic system, Environment Hall ... 154
Figure 4-80: Annual building’s electricity consumption, Environment Hall ... 155
Figure 4-81: Annual energy savings, Environment Hall ... 156
Figure 4-82: Energy cost savings for green roof and cool roof, Environment Hall ... 156
Figure 4-83: Annual energy generation, Environment Hall ... 157
Figure4-84: Net cost savings for green roofs, Environment Hall ... 158
Figure4-85: Net cost saving for cool roofs, Environment Hall ... 158
Figure 4-86: Net cost saving for PV systems, Environment Hall ... 159
Figure 4-87: Estimated payback periods, Environment Hall ... 159
Figure 4-88: Percentage of different roof types as a function of different environmental impacts, Environment Hall ... 162
Figure 4-89: The sensitivity of different roof systems based on environmental impacts... 165
Figure 4-90: The sensitivity of different PV systems based on installation costs ... 166
Figure 4-91: The sensitivity of different PV systems, 50% reduction in installation costs ... 166
Figure 4-92: The sensitivity of different PV systems based on considered analysis horizon (40 years) .... 167
xii
LIST OF SYMBOLS
No. Symbol Description
1 𝑿𝒓 𝐏𝒓𝒆𝒔𝒆𝒏𝒕𝒈𝒓𝒆𝒆𝒏𝒓𝒐𝒐𝒇𝒘𝒊𝒕𝐡𝒓𝒐𝒐𝒇𝒕𝒚𝒑𝐞𝒓
2 𝒀𝒔 𝐏𝒓𝒆𝒔𝒆𝒏𝒕𝒄𝒐𝒐𝒍𝒓𝒐𝒐𝒇𝒘𝒊𝒕𝐡𝒓𝒐𝒐𝐟𝒕𝒚𝒑𝒆𝒔
4 𝒁𝒕 𝐏𝒓𝒆𝒔𝒆𝒏𝒕𝑷𝑽𝒔𝒚𝒔𝒕𝒆𝒎𝒘𝒊𝒕𝐡𝒓𝒐𝒐𝒇𝒕𝒚𝒑𝒆𝒕
5 𝑰𝑴𝑿𝒓𝟏
𝐈𝒎𝒑𝒂𝒄𝒕𝒐𝒇𝒈𝒓𝒆𝒆𝒏𝒓𝒐𝒐𝒇𝒕𝒚𝒑𝒆𝒓𝒐𝒏𝑨𝒏𝒏𝒖𝒂𝒍𝑬𝒏𝒆𝒓𝒈𝒚𝑺𝒂𝒗𝒊𝒏𝒈𝒔(𝑬𝑼𝑰 = 𝐤𝐖𝐡/𝐟𝒕𝟐∗ 𝒚𝒓)
6 𝑰𝑴𝒀𝒔𝟏
𝐈𝒎𝒑𝒂𝒄𝒕𝒐𝒇𝒄𝒐𝒐𝒍𝒓𝒐𝒐𝒇𝒕𝒚𝒑𝒆𝒔𝒐𝒏𝑨𝒏𝒏𝒖𝒂𝒍𝑬𝒏𝒆𝒓𝒈𝒚𝑺𝒂𝒗𝒊𝒏𝒈𝒔 (𝑬𝑼𝑰 = 𝐤𝐖𝐡/𝒇𝒕𝟐∗ 𝒚𝒓)
7 𝑰𝑴𝒁𝒕𝟏
𝐈𝒎𝒑𝒂𝒄𝒕𝒐𝒇𝑷𝑽𝒔𝒚𝒔𝒕𝒆𝒎𝒕𝒚𝒑𝒆𝒕𝒐𝒏𝑨𝒏𝒏𝒖𝒂𝒍𝑬𝒏𝒆𝒓𝒈𝒚𝑺𝒂𝒗𝒊𝒏𝒈𝒔 (𝑬𝑼𝑰 = 𝐤𝐖𝐡/𝒇𝒕𝟐∗ 𝒚𝒓)
8 𝑰𝑴𝑿𝒓𝟐 𝐈𝒎𝒑𝒂𝒄𝒕𝒐𝒇𝒈𝒓𝒆𝒆𝒏𝒓𝒐𝒐𝒇𝒕𝒚𝒑𝒆𝒓𝒐𝒏𝑬𝒏𝒗𝒊𝒓𝒐𝒏𝒎𝒆𝒏𝒕(𝒌𝒈/𝒇𝒕 𝟐
∗ 𝒚𝒓𝑪𝑶𝟐)
9 𝑰𝑴𝒀𝒔𝟐
𝐈𝒎𝒑𝒂𝒄𝒕𝒐𝒇𝒄𝒐𝒐𝒍𝒓𝒐𝒐𝒇𝒕𝒚𝒑𝒆𝒔𝒐𝒏𝑬𝒏𝒗𝒊𝒓𝒐𝒏𝒎𝒆𝒏𝒕 (𝒌𝒈/𝒇𝒕𝟐 ∗ 𝒚𝒓𝑪𝑶𝟐)
10 𝑰𝑴𝒁𝒕𝟐 𝐈𝒎𝒑𝒂𝒄𝒕𝒐𝒇𝑷𝒀𝒔𝒚𝒔𝒕𝒆𝒎𝒕𝒚𝒑𝒆𝒕𝒐𝒏𝑬𝒏𝒗𝒊𝒓𝒐𝒏𝒎𝒆𝒏𝒕 (𝒌𝒈/𝒇𝒕
𝟐
∗ 𝒚𝒓𝑪𝑶𝟐)
11 𝑪𝑿𝒓 𝐂𝒐𝒔𝒕𝒐𝒇𝒊𝒏𝒔𝒕𝒂𝒍𝒍𝒂𝒕𝒊𝒐𝒏𝒐𝒇𝒐𝒏𝒆𝒖𝒏𝒊𝒕𝒈𝒓𝒆𝒆𝒏𝒓𝒐𝒐𝒇𝒕𝒚𝒑𝒆𝒓
12 𝑪𝒀𝒔 𝐂𝒐𝒔𝒕𝒐𝒇𝒊𝒏𝒔𝒕𝒂𝒍𝒍𝒂𝒕𝒊𝒐𝒏𝒐𝒇𝒐𝒏𝒆𝒖𝒏𝒊𝒕𝒄𝒐𝒐𝒍𝒓𝒐𝒐𝒇𝒕𝒚𝒑𝒆𝒔
13 𝑪𝒁𝒕 𝐂𝒐𝒔𝒕𝒐𝒇𝒊𝒏𝒔𝒕𝒂𝒍𝒍𝒂𝒕𝒊𝒐𝒏𝒐𝒇𝒐𝒏𝒆𝒖𝒏𝒊𝒕𝑷𝑽𝒔𝒚𝒔𝒕𝒆𝒎𝒕𝒚𝒑𝒆𝒕
14 𝑪′𝑿𝒓 𝐅𝒊𝒙𝒆𝒅𝒊𝒏𝒔𝒕𝒂𝒍𝒍𝒂𝒕𝒊𝒐𝒏𝒄𝒐𝒔𝒕𝒇𝒐𝒓𝒈𝒓𝒆𝒆𝒏𝒓𝒐𝒐𝒇𝒕𝒚𝒑𝒆𝒓
15 𝑪′𝒀𝒔 𝐅𝒊𝒙𝒆𝒅𝒊𝒏𝒔𝒕𝒂𝒍𝒍𝒂𝒕𝐢𝒐𝒏𝒄𝒐𝒔𝒕𝒇𝒐𝒓𝒄𝒐𝒐𝒍𝒓𝒐𝒐𝒇𝒕𝒚𝒑𝒆𝒔
16 𝑪′𝒁𝒕 𝐅𝒊𝒙𝒆𝒅𝒊𝒏𝒔𝒕𝒂𝒍𝒍𝒂𝒕𝒊𝒐𝒏𝒄𝒐𝒔𝒕𝒇𝒐𝒓𝑷𝑽𝒔𝒚𝒔𝒕𝒆𝒎𝒕𝒚𝒑𝒆𝒕
17 𝑹𝑿𝒓 𝐑𝒆𝒑𝒍𝒂𝒄𝒆𝒎𝒆𝒏𝒕 𝑪𝒐𝒔𝒕𝒐𝒇𝒐𝒏𝒆𝒖𝒏𝒊𝒕𝒈𝒓𝒆𝒆𝒏𝒓𝒐𝒐𝒇𝒕𝒚𝒑𝒆𝒓
18 𝑹𝒀𝒔 𝐑𝒆𝒑𝒍𝒂𝒄𝒆𝒎𝒆𝒏𝒕 𝑪𝒐𝒔𝒕𝒐𝒇𝒐𝒏𝒆𝒖𝒏𝒊𝒕𝒄𝒐𝒐𝒍𝒓𝒐𝒐𝒇𝒕𝒚𝒑𝒆𝒔
19 𝑹𝒁𝒕 𝐑𝒆𝒑𝒍𝒂𝒄𝒆𝒎𝒆𝒏𝒕 𝑪𝒐𝒔𝒕𝒐𝒇𝒐𝒏𝒆𝒖𝒏𝒊𝒕𝑷𝑽𝒔𝒚𝒔𝒕𝒆𝒎𝒕𝒚𝒑𝒆𝒕
20 𝑪𝑴𝑿𝒓 𝐌𝒂𝒊𝒏𝒕𝒆𝒏𝒂𝒏𝒄𝒆𝒄𝒐𝒔𝒕𝒐𝒇𝒐𝒏𝒆𝒖𝒏𝒊𝒕𝐠𝒓𝒆𝒆𝒏𝒓𝒐𝒐𝒇𝒕𝒚𝒑𝒆𝒓
21 𝑪𝑴𝒀𝒔 𝐌𝒂𝒊𝒏𝒕𝒆𝒏𝒂𝒏𝒄𝒆𝒄𝒐𝒔𝒕𝒐𝒇𝒐𝒏𝒆𝒖𝒏𝒊𝒕𝒄𝒐𝒐𝒍𝒓𝒐𝒐𝐟𝒕𝒚𝒑𝒆𝒔
xiii
No. Symbol Description
23 𝑪𝑴′𝑿𝒓 𝐅𝒊𝒙𝒆𝒅𝒎𝒂𝒊𝒏𝒕𝒆𝒏𝒂𝒏𝒄𝒆𝒄𝒐𝒔𝒕𝒇𝒐𝒓𝒈𝒓𝒆𝒆𝒏𝒓𝒐𝒐𝒇𝒕𝒚𝒑𝒆𝒓
24 𝑪𝑴′𝒀𝒔 𝐅𝒊𝒙𝒆𝒅𝒎𝒂𝒊𝒏𝒕𝐞𝒏𝒂𝒏𝒄𝒆𝒄𝒐𝒔𝒕𝒇𝒐𝒓𝒄𝒐𝒐𝒍𝒓𝒐𝒐𝒇𝒕𝒚𝒑𝒆𝒔
25 𝑪𝑴′𝒁𝒕 𝐅𝒊𝐱𝒆𝒅𝒎𝒂𝒊𝒏𝒕𝒆𝒏𝒂𝒏𝒄𝒆𝒄𝒐𝒔𝒕𝒇𝒐𝒓𝑷𝑽𝒔𝒚𝒔𝒕𝒆𝒎𝒕𝒚𝒑𝒆𝒕
26 L 𝐭𝒐𝒕𝒂𝒍𝒔𝒖𝒓𝒇𝒂𝒄𝒆𝒂𝒓𝒆𝒂𝒐𝒇𝒓𝒐𝒐𝒇
27 𝑪𝒌𝑾𝐡 $𝒇𝒐𝒓𝟏𝒌𝑾𝐡
28 𝑰𝒓 𝐈𝒏𝒅𝒊𝒄𝒂𝒕𝒐𝒓𝒗𝒂𝒓𝒊𝒂𝒃𝒍𝒆𝒔𝒇𝒐𝒓𝒈𝒓𝒆𝒆𝒏𝒓𝒐𝒐𝒇𝒔
29 𝑰𝒔 𝐈𝒏𝒅𝒊𝒄𝒂𝒕𝒐𝒓𝒗𝒂𝒓𝒊𝒂𝒃𝒍𝒆𝒔𝒇𝒐𝒓𝒄𝒐𝒐𝒍𝒓𝒐𝒐𝒇𝒔
30 𝑰𝒕 𝐈𝒏𝒅𝒊𝒄𝒂𝒕𝒐𝒓𝒗𝒂𝒓𝒊𝒂𝒃𝒍𝒆𝒔𝒇𝒐𝒓𝑷𝑽𝒔𝒚𝒔𝒕𝒆𝒎𝒔
31 𝒈𝒙 𝐃𝒆𝒈𝒓𝒂𝒅𝒂𝒕𝒊𝒐𝒏 𝒓𝒂𝒕𝒆 𝒐𝒇 𝒈𝒓𝒆𝒆𝒏 𝒓𝒐𝒐𝒇 𝒔𝒚𝒔𝒕𝒆𝒎𝒔
32 𝒈𝒚 𝐃𝒆𝒈𝒓𝒂𝒅𝒂𝒕𝒊𝒐𝒏 𝒓𝒂𝒕𝒆 𝒐𝒇 𝒄𝒐𝒐𝒍 𝒓𝒐𝒐𝒇 𝒔𝒚𝒔𝒕𝒆𝒎𝒔
33 𝒈𝒛 𝐃𝒆𝒈𝒓𝒂𝒅𝒂𝒕𝒊𝒐𝒏 𝒓𝒂𝒕𝒆 𝒐𝒇 𝑷𝑽 𝒔𝒚𝒔𝒕𝒆𝒎𝒔
34 𝒏𝒙𝒓 𝐋𝒊𝒇𝒆𝒕𝒊𝒎𝒆 𝒐𝒇 𝒈𝒓𝒆𝒆𝒏 𝒓𝒐𝒐𝒇 𝒔𝒚𝒔𝒕𝒆𝒎𝒔
35 𝒏𝒚𝒔 𝐋𝒊𝒇𝒆𝒕𝒊𝒎𝒆 𝒐𝒇 𝒄𝒐𝒐𝒍 𝒓𝒐𝒐𝒇 𝒔𝒚𝒔𝒕𝒆𝒎𝒔
36 𝒏𝒛𝒕 𝐋𝒊𝒇𝒆𝒕𝒊𝒎𝒆 𝒐𝒇 𝑷𝑽 𝒔𝒚𝒔𝒕𝒆𝒎𝒔
37 𝒏′𝒙𝒓 𝐌𝒂𝒊𝒏𝒕𝒆𝒏𝒂𝒏𝒄𝒆 𝒑𝒆𝒓𝒊𝒐𝒅𝒔 𝒐𝒇 𝒈𝒓𝒆𝒆𝒏 𝒓𝒐𝒐𝒇 𝒔𝒚𝒔𝒕𝒆𝒎𝒔
38 𝒏′𝒚𝒔 𝐌𝒂𝒊𝒏𝒕𝒆𝒏𝒂𝒏𝒄𝒆 𝒑𝒆𝒓𝒊𝒐𝒅𝒔 𝒐𝒇 𝒄𝒐𝒐𝒍 𝒓𝒐𝒐𝒇 𝒔𝒚𝒔𝒕𝒆𝒎𝒔
39 𝒏′𝒛𝒕 𝐌𝒂𝒊𝒏𝒕𝒆𝒏𝒂𝒏𝒄𝒆 𝒑𝒆𝒓𝒊𝒐𝒅𝒔 𝒐𝒇 𝑷𝑽 𝒔𝒚𝐬𝒕𝒆𝒎𝒔
40 𝐢 𝐑𝒆𝒂𝒍 𝒊𝒏𝒕𝒆𝒓𝒆𝒔𝒕 𝒓𝒂𝒕𝒆
41 𝐢′ 𝐂𝒐𝒎𝒃𝒊𝒏𝒆𝒅 𝒊𝒏𝒕𝒆𝒓𝒆𝒔𝒕 𝒓𝒂𝒕𝒆 𝒇𝒐𝒓 𝐩𝒆𝒓𝒊𝒐𝒅 𝒐𝒇 𝒎𝒂𝒊𝒏𝒕𝒆𝒏𝒂𝒏𝒄𝒆
42 𝒏′′𝒙𝒓 𝐅𝒊𝒙𝒆𝒅 𝑴𝒂𝒊𝒏𝒕𝒆𝒏𝒂𝒏𝒄𝒆 𝒑𝒆𝒓𝒊𝒐𝒅𝒔 𝒐𝒇 𝒈𝒓𝒆𝒆𝒏 𝒓𝒐𝒐𝒇 𝒔𝒚𝒔𝒕𝒆𝐦𝒔
43 𝒏′′𝒚𝒔 𝐅𝒊𝒙𝒆𝒅 𝑴𝒂𝒊𝒏𝒕𝒆𝒏𝒂𝒏𝒄𝒆 𝒑𝒆𝒓𝒊𝒐𝒅𝒔 𝒐𝒇 𝒄𝒐𝒐𝒍 𝒓𝒐𝒐𝒇 𝒔𝒚𝒔𝒕𝒆𝒎𝒔
44 𝒏′′𝒛𝒕 𝐅𝒊𝒙𝒆𝒅 𝑴𝒂𝒊𝒏𝒕𝒆𝒏𝒂𝒏𝒄𝒆 𝒑𝒆𝒓𝒊𝒐𝒅𝒔 𝒐𝒇 𝑷𝑽 𝒔𝒚𝒔𝒕𝒆𝒎𝒔
45 𝒌𝑿𝒓 𝐍𝒖𝒎𝒃𝒆𝒓 𝒐𝒇 𝑹𝒆𝒑𝒍𝒂𝒄𝒆𝒎𝒆𝒏𝒕𝒐𝒇𝒈𝒓𝒆𝒆𝒏𝒓𝒐𝒐𝒇𝒕𝒚𝒑𝒆𝒓
46 𝒌𝒀𝒔 𝐍𝒖𝒎𝒃𝒆𝒓 𝒐𝒇 𝑹𝒆𝒑𝒍𝒂𝒄𝒆𝒎𝒆𝒏𝒕𝒐𝒇𝒄𝒐𝒐𝒍𝒓𝒐𝒐𝒇𝒕𝒚𝒑𝒆𝒔
1
Chapter 1
INTRODUCTION
R
ESEARCHO
VERVIEWPrimarily architects and designers make major design decisions regarding a building’s
sustainability during the early design stages. Improving thermal performance of building
envelops is widely considered in sustainable design from different points of view, i.e.
architecture, structure, and construction [1, 2]. Changing building design parameters such as
form, orientation, and envelope configurations leads to developing sustainable buildings.
The roof, as primary part of the envelope, is also an important area in the conceptual stage of
building design. Roof surfaces are designed and utilized as an extra space that can improve the
energy performance and economic aspects of a building [3]. The roof surface also offers a weatherproof barrier for the building’s interior [4]. Furthermore, the roof system is one of the
building’s elements requiring frequent replacement. Thus, changing the roof’s characteristics
and materials is relatively easier than other envelopes. The average lifetime of a conventional
roof is 15 to 20 years before it needs replacement [5-7].
This therefore gives rise to utilizing roof spaces in terms of different roof functions and
technologies for sustainable development [5]. These roof technologies are considered an
efficient measurement or strategy that serves as a benchmark for designers to improve the
performance of a building with regard to energy and environment.
Among different roof types’ technologies and functions, there are debates and challenges
2
financial aspect, energy performance, and environmental recognition, all of which are
considered in sustainable development [4].
In addition, integrating different roof functions in a contingent way can improve the efficiency
of the system and avoid single roof type deficiencies. However, this requires creating a
quantitative connection between the spectrums of roof function performance factors [8].
Therefore, this research develops a suitable methodology to consider these factors when
selecting integral optimal options for different roof functions. It primarily investigates the
combination of different roof functions in satisfying different needs, such as environmental
impact and energy consumption, while minimizing the project’s financial aspect.
R
ESEARCHQ
UESTIONSThis research attempts to address following question:
What are the best and/or optimal strategies of utilizing roof areas in commercial buildings to
achieve sustainability goals such as Net Zero Energy Buildings (NZEBs) or Carbon-Neutral
buildings?
In order to achieve this purpose, the followings need to be addressed:
1) Which parameters should be considered in sustainable roof design?
2) Of those parameters considered, which ones should be assumed to have common and
typical values, and which ones should be directly estimated, such as energy
3
3) How do Energy Efficiency & Renewable Energy (EERE) technologies like cool roofs,
green roofs, and PV systems impact building energy consumption and energy
production?
4) What are the environmental impacts of these technologies?
5) What are the relationships between EERE technologies in terms of installation,
operation cost, and environmental impact?
6) How can the energy, cost, and environmental impact of these strategies be assessed or
evaluated?
7) Is there any integration among different roof functions? If yes, should those be
considered in this research?
8) Can a framework provide a universal model for use in other climates and locations?
9) Ultimately, can a combined roof be evaluated for whether it can perform more
satisfactory compared to traditional ones with regard to sustainable development?
R
ESEARCHG
OALThe main goal of this research is to develop a framework that includes an optimization
mathematical model as a core that is fed by required data from energy, cost, and environmental
analyses in order to present the optimal combination of different roof functions. The core
optimization model attempts to maximize the cost savings associated with energy performance,
roof type installation costs, maintenance, and operational costs, while considering the
environmental impact of the overall combination of roof systems.
4
O
BJECTIVES OFR
ESEARCHThis study addresses the gap in existing roof technology research by applying energy and cost
analysis and environmental assessment. The research seeks to meet the following objectives:
1) Develop an optimization mathematical model, which can help designers optimize
technology implementation cost.
2) Evaluate energy characteristics for different roof functions using simulation modeling
technology.
3) Evaluate environmental impacts of roof function alternatives using simulation,
literature review, and existing data.
4) Develop a Cost Benefit Analysis (CBA) for different roof functions considering their
NPV value.
5) Develop an Excel/VBA tool or MATLAB to validate the proposed optimization model.
6) Develop a database to estimate the behavior of combining different roof types in
planning and preliminarily level analyses.
The dissertation is organized as follows: Following this introductory section, a review of the
studies and principles of different roof functions as found in the literature is presented,
followed by a summary and conclusion. Next is methodology section that details the proposed
mathematical framework and its components. Results of the evaluation of proposed methods
are highlighted next, followed by a conclusion section and recommendations for additional
5
Chapter 2
LITERATURE REVIEW
S
TATE OFT
HEA
RTIntegrated Roof Systems
Roof surfaces play significant roles in sustainable development on both the building and urban
scale. Roof designers have applied different roof technologies in order to decrease storm water
runoff, build energy consumption, create Urban Heat Island (UHI), and produce electricity.
Most roof designs are limited to a single technology or specific strategy, yet coupling various
roof systems can provide active and passive benefits in both energy and cost. [9, 10].
The integrated roof systems concepts incorporate multiple aspects and functions, such as green
roofs, cool roofs, various materials, daylighting, PV systems, and water harvesting systems.
The integration of roof systems is an ongoing discussion. There are several installed integrating
roof systems in the world; however, a comprehensive assessment of benefits and costs resulting
from the coupled configurations is still lacking. [10-14].
D
EFINITION OF TERMSThis section presents the definition of some terms used in the literature and content.
Energy Performance
The energy performance of a building is the energy-related characteristics of the building,
including the amount of energy consumption, energy savings potential, and energy generation.
6 Energy Performance Metrics
Energy Efficiency
The key concept of energy efficiency is to generate the same amount of output using less
energy. It has financial benefits for both customers and manufacturers. Bosseboeuf et al. have
two definitions for energy efficiency:
- Economic efficiency: more output or improved standards of living with the same or
less amount of energy.
- Techno-economic efficiency: reducing particular energy due to technical progress,
changes in behavior, better management, and so forth [16, 17].
Equation 2-1 shows the quantitative measure of energy efficiency based on selected energy
input and useful output [17]:
𝑈𝑠𝑒𝑓𝑢𝑙 𝑜𝑢𝑡𝑝𝑢𝑡 𝑜𝑓 𝑎 𝑝𝑟𝑜𝑐𝑒𝑠𝑠 𝐸𝑛𝑒𝑟𝑔𝑦 𝐼𝑛𝑝𝑢𝑡 𝑜𝑓 𝑎 𝑝𝑟𝑜𝑐𝑒𝑠𝑠
2-1
Energy Generation
Applying renewable energy to a building produces energy that can support the building’s
energy demands in terms of electricity, heating, and cooling. In 2015, U.S. power plants
utilized energy sources including water, wind, biomass, wood and waste, geothermal, and solar
to produce around 13% of the electricity consumed in the United States [18, 19]
Energy Quantity
7
Energy Use Intensity (EUI) represents the amount of energy used in a building. EUI is stated
as energy per year per square foot and is often given as [kBtu/ft2/yr]. It is estimated by dividing
the total annual energy usage of the building by the total gross floor area of the building, such
as in Equation 2-2. In general, a low EUI indicates good energy performance [20, 21].
𝑇𝑜𝑡𝑎𝑙 𝐸𝑛𝑒𝑟𝑔𝑦 𝑈𝑠𝑒 𝐼𝑛𝑡𝑒𝑛𝑠𝑖𝑡𝑦 (𝐸𝑈𝐼) = 𝑇𝑜𝑡𝑎𝑙 𝐴𝑛𝑛𝑢𝑎𝑙 𝐸𝑛𝑒𝑟𝑔𝑦 𝑈𝑠𝑒 𝐺𝑟𝑜𝑠𝑠 𝐹𝑙𝑜𝑜𝑟 𝐴𝑟𝑒𝑎
2-2
Energy Peak Demand
For industrial and commercial sectors, electricity consumption is based on two parameters:
actual energy usage (kWh) and penalty fee, which is based on the highest level of demand
(peak) during a specific period (week, month, or year). This charge is based on a price per kW,
typically the peak kW of the billing period. Energy peak demand is one of the most important
variables that should be considered for estimating the amount of additional capacity required
to ensure an adequate supply of energy and the size of equipment [22].
Thermal Comfort
According to a definition produced by the American Society of Heating, Refrigerating and Air conditioning Engineers (ASHRAE), thermal comfort is “the condition of the mind in which
satisfaction is expressed with the thermal environment” [23]. Thermal comfort depends on
numerous parameters. Two main parameters are “personal factors” like occupant activity,
clothing level, age, and sex, and “environmental factors” including dry-bulb temperature and
mean radiant temperature, which refers to surrounding objects’ temperature, humidity, and air
8
Building Simulation programs
Building simulation programs are utilized to analyze buildings’ energy performance and
thermal comfort during the day, year, or life-cycle. There are various available tools that vary
in several aspects, such as their thermodynamic models, graphical user interface, and
application purpose. In 2010, the U.S. Department of Energy (DOE) Building Energy Software
Tools Directory (BESTD) website published a list of Building Performance Simulation (BPS)
programs, which consists of around 389 tools. Therefore, in order to facilitate the selection
process, it is critical to understand the limitations and capabilities of the desired tools and identify users’ needs [25, 26].
This section introduces a selection of energy simulation engines; the conclusion will compare
these programs.
Quite a bit of research has been conducted on the criteria and requirements of BPS tools. For
example, Crawly et al. compared the capabilities and features of 20 main building energy
simulation tools such as BLAST, BSim, DOE-2.1E, ECOTECT, EnergyPlus, EQUEST, and
HEED based on 18 categories including reporting, validation, user interface, and links to other
programs [27]. Attia and De Herde compared 10 Building Performance Simulation (BPS) tools
including HEED, e-Quest, ENERGY-10, DesignBuilder, ECOTECT, Vasari, Solar Shoebox,
Open Studio Plug-in, IES-VE-Ware and BEopt [28]. Lam et al. studied five tools based on four
main criteria: usability, functionality, reliability, and prevalence [26, 29].
From the review of previous studies, five major criteria can be considered for BPS tool
9
1- Usability and information management
2- Integration of intelligent design knowledge-base
3- Accuracy
4- Interoperability
5- Integration with design process [26].
This study used the EnergyPlus program [30] to evaluate the impact of multiple roof parameters on a building’s energy performance. The EnergyPlus simulation program was
selected due to its high accuracy level, wide application ranges, and other features as described
below.
EnergyPlus program
EnergyPlus is a new generation of simulation tool support by the U.S. Department of Energy.
This program combines the main features and capabilities of both BLAST and DOE-2 and
includes new features. EnergyPlus is a modular, structured code that is easy to maintain,
update, and extend. All input and output data files are in sample format, which can be utilized
by other programs and databases. EnergyPlus is a simulation engine with a variable time step
to analyze the heating system, cooling system, and plant and electrical system. Integrated
simulation offers a more accurate calculation of space temperature, building loads, heat gain,
and other energy flows [24, 27, 31].
Building Geometry and Climate Data
In order to perform the energy analysis in EnergyPlus, two input files are needed: a building
10
weather data file, which in our case is the Typical Meteorological Year (TMY), and default
parameters for each specific roof [32].
To examine the energy performance of various roof systems, the prototype model was
developed using Google SketchUp7 program with the OpenStudio program plugged into it [33,
34].
Open Studio is an open source analysis platform that leverages EnergyPlus and Radiance
simulation engines. It was developed by the National Renewable Energy Laboratory (NREL)
and facilitates an integrated whole-building energy analysis. A plug-in to Google SketchUp
allows users to build geometry with other required EnergyPlus input data [24, 35].
Spectral Properties of Solar Radiation
The properties of solar spectra need to be understood in order to study the effect of solar
radiation on roof surfaces with different functions. When sunlight arrives on the earth, three
distinct spectrums of solar radiations are identified as illustrated in Figure 2-1. They range
11 Figure 2-1: Atmospheric solar spectra [36]
Figure 2-1 presents the solar distributions based on a pre-wavelength unit basis. As shown,
52% of the solar spectrum arrives in the visible region, 43% is in the near-infrared region, and
a small portion (5% ) is ultraviolet [36, 37].
When solar energy arrives on any surface, it may result in various outcomes. It may be
transmitted, reflected, or absorbed by the surface. In most cases, these three options occur to a
larger or less extent.
The solar radiation spectral is affected by the radiated materials’ type and thickness. How the
materials transmit, reflect, and absorb the solar radiation vary for different roof functions.
Solar Reflectance
Solar reflectance is defined as the ratio of the reflected solar radiation to the incoming solar
radiation, which arrives on the surface from all surrounding directions. It covers wavelengths
12 Thermal Emittance of Solar Radiation
Thermal emittance is the ability of a surface to release the absorbed heat. It measures how well
a surface emits energy compared to a blackbody surface at the same temperature [38, 39].
Absorbance
Solar absorbance is the portion of arrived solar radiation that is absorbed by the surface of
materials. Some amount of solar radiation that arrives to the surface is absorbed and increases the materials’ temperature.
If the solar reflectance (or reflectivity) data is available, then absorbance is equal to 1.0 minus
reflectance (for opaque materials). The values for solar reflectance range from 0.0 to 1.0.[38,
39].
Grid-connected PV systems
A grid connected system provides the ability for the PV system to transfer extra electricity
demands to the power line. When the electricity demands are lower than PV output, the excess
electricity can be sold back into the grid-connected system. Figure 2-2 demonstrates the
13 Figure 2-2: Grid-connected photovoltaic system [40]
Cost Analysis
Net Present Value Analysis
The net present value (NPV) analysis prices future costs in terms of current dollars. It allows
for a comparison of the total costs over a specific time period [42] .
Interest Rate
The nominal interest rate per year (r) is the annual interest rate without considering the effect
of compounding, such as inflation rate. When other periods of time are used, it is called
effective interest rate.
Inflation Rate
Inflation rate is an occurrence that causes purchasing power reduction, and as result, revenue
and cost escalation. Inflation rate influences the value of future cash flow and should be
14 Real Interest Rate
The real interest rate is an interest rate that has been adjusted considering inflation rate effects.
The concept of real interest rate is useful when accounting for the impact of inflation in order
to achieve an accurate estimation of real cost. The difference between real interest rate and
nominal interest rate is summed up in Equation 2-3[44, 45].
𝑁𝑜𝑚𝑖𝑛𝑎𝑙 𝑖𝑛𝑡𝑒𝑟𝑒𝑠𝑡 𝑟𝑎𝑡𝑒 – 𝐼𝑛𝑓𝑙𝑎𝑡𝑖𝑜𝑛 = 𝑅𝑒𝑎𝑙 𝑖𝑛𝑡𝑒𝑟𝑒𝑠𝑡 𝑟𝑎𝑡𝑒 2-3
Degradation Rate
Decreasing the power output over time due to the decreasing efficiency of the system is known
as degradation rate. Degradation rate is an important economic factor because it is directly
related to power generation and occurs as result of future cash flows [46].
Environmental Performance
Environmental Impact Assessment
The Environmental Impact Assessment (EIA) definition adopted by the International Association for Impact Assessment (IAIA, 2009) is “the process of identifying, predicting,
evaluating, and mitigating the biophysical, social and other relevant effects of proposed development proposals prior to major decisions being taken and commitments made” [47].
All types of energy have some harmful effect on the environment; however, the effect of
renewable energy is less than with other sources. Understanding the environmental effects
associated with different types and sources of energy is critical for sustainable development
15
Greenhouse gas emission
While the entire world is tackling global warming concerns, greenhouse gas (GHG) reduction
remains one of the most interesting parameters for environmental protection. More than 80%
of U.S. greenhouse gas emissions is associated with energy-related carbon dioxide. Carbon
dioxide emissions in the commercial sector are mostly related to energy consumption for
lighting, heating, and cooling. Using green technologies such as green roofs and cool roofs can reduce a building’s energy demands and reduce the amount of GHG emissions over their
lifecycle [49]. GHG emissions are also related to the energy source. For example, coal
combustion generates more greenhouse gas than natural gas or petroleum [39].
Roof system technologies
Applying various roof technologies such as cool roofs, several materials, daylighting, PV
systems, and water harvesting is an effective measurement for sustainable roof design. Roof
system technologies have been applied for various purposes including storm water
management, energy consumption reduction, urban heat island mitigation, and electricity
generation. In this study, three functions of roofing systems are selected based on the literature,
including green roofs, cool roofs, and Photovoltaic systems. The different types of systems,
materials, and their performance are explained below.
Cool Roofs
A cool roof is a roof that stays cool in the sun due to low solar absorption and high thermal
16
sun is the one that determines whether a roof is cool or not. The lower temperature of cool
roofs leads to reduced heat transfer into interior spaces and a resulting reduction in the cooling
load of the building. According to the U.S. Green Building Council, a roof is considered cool
if it has a solar reflectance value of at least 0.7 and thermal emittance value of at least 0.9 on a
scale of 0 to 1 [38, 50, 51].
Cool roof material:
With the recent development of new materials and techniques presenting advanced thermal
characteristics including high solar reflectance and infrared emittance, new cooler materials
are being generated. These are categorized in four phases including: Highly reflective and emissive light-colored materials
Cool-colored materials
Phase change materials
Dynamic cool materials [52]
Cool Roof Coating:
Roofs can receive a solar reflective coating that helps solar radiation reflections. Coatings are
thick paints containing reflective pigments that can reflect sunlight and keep roof surfaces from
chemical damage and ultra-violet (UV) incidence.
There are two types of coating:
White coating: White materials are a popular option for building surfaces that cannot
17
Color coating: Cool-colored roofs are designed to increase sun reflection while
maintaining the color and aesthetic of traditional nonwhite roofing products [53-56].
Roof mist cooling systems or evaporative cooling systems:
A roof misting system lowers surface temperatures by spraying an extremely small amount of
water across the roof, allowing the water to cool the roof as it evaporates [37, 53, 56].
The benefits of roof mist systems include reducing surface temperature, air-conditioning usage,
and cooling energy consumption, as well as improving air conditioning efficiency. However,
it is not sustainable in areas where water is valuable and scarce [57, 58].
Roofs that are covered by PV panels, vegetation, stone ballast or gravel (ballasted roof) can
reflect solar radiation and act like a cool roof. The different types of roof systems, along with
the methods of making them cool, are presented below:
1) Single-ply Membranes:
Single-ply membranes consist of pre-fabricated sheets of rubber polymers that are attached to
the roof with mechanical fasteners or chemical adhesives. They can also be held in place using
ballast such as gravel or stones. Some membranes are typically white and reflect sunlight, such
as TPO (thermoplastic polyolefin) and PVC (polyvinyl chloride). Other membranes are
typically black and should be formulated in the factory or coated to make them cool, such as
EPDM (ethylene propylene diene M-class) [54, 59] .
2) Built-Up Roofs:
Built up roofs consist of a base sheet, fabric reinforcement layers, and often a dark protective
18
can make the surface layer cool. Other options for cooling surfaces are embedding mineral
granules or factory-applied coating. Cool coating can be applied directly on top of the typical
dark roof.
3) Modified Bitumen Sheet Membranes:
These types of roof systems consist of one or more layers of plastic or rubber material using
reinforcing fabrics. The surface layer is covered with mineral granules or a smooth finish. The
modified bitumen sheet can be pre-coated at the factory.
4) Spray Polyurethane Foam roofs:
These roof systems are composed of two combined liquid chemicals. These materials react and
create one solid piece attached to the roof. Protective coatings are used to keep the foam surface
away from mechanical, moisture, and UV damage. These coatings can be reflective and can
cool the surface.
5) Shingled Roofs:
Shingled roofs contain overlapping panels. These panels consist of different materials such as
fiberglass asphalt, polymers, or metals. Asphalt shingles can be coated with granules for
protection and better solar reflectance. Other roof shingles materials including wood,
polymers, or metals can be coated at the factory or in the field. Metal shingles are explained in
19 6) Tile Roofs:
Tile roofs can be composed of clay, slate, or concrete. They vary in color and thermal
characteristics based on the earth’s composition. Some have good reflection amounts, while
others need to be glazed or coated to change from none-cool tiles into cool roof tiles.
7) Metal Roofs:
Metal roofs commonly have high solar reflectance, but low thermal emittance. Those that have
enough SRI (Solar Reflectance Index) are considered a cool roof. Painting metal roofs at the
factory or in the field can enhance their solar reflectance and thermal emittance [51, 53, 54,
56, 59].
Cool roof performance
A roof can be considered cool when it meets two requirements. First, it must have both the
minimum amount of solar reflectance and thermal emittance, as shown in Table 2-1. Second,
it must have the minimum Solar Reflectance Index (SRI), which permits roofs to meet the
minimum thermal emittance and solar reflectance requirement [54].
Table 2-1: Typical minimum cool roof requirement, California energy commission
Roof Type
Solar Reflectance [3-year aged]
AND
Thermal Emittance [New or aged]
OR
Solar Reflectance Index (SRI) [3-year aged]
Low Sloped 0.55 0.75 64
Steep Sloped 0.20 0.75 16
Cool roof materials in any color reflect solar radiations in the near infrared region, which
20 Figure 2-3: a) Spectral solar power distribution, (b) Solar spectral reflectance of cool and standard
brown surfaces [51]
Figure 2-3 demonstrates the spectral reflectance of a brown surface and cool color material.
They have similar reflectance value in the visible range of the solar spectrum, but the cool
material has higher reflectance in the near infrared range, which mainly causes thermal [51,
52]. Cool materials also emit radiation more efficiently than regular roofs due to higher thermal
emittance. Thus, the roof surface remains cool and reduces the building’s heat gain within the
envelope, which results in a cooling load reduction [14, 51]. Equation 2-4 demonstrates the
thermal balance of a horizontal surface under the sun:
(1 − 𝑅)𝐼 = ℇơ (𝑇𝑠4− 𝑇
𝑠𝑘𝑦4 ) + ℎ𝑐(𝑇𝑠− 𝑇𝑎) − ƛ
𝑑𝑇 𝑑𝑥
2-4
Where:
I is the insulation (W/m2),
21
ℎ𝑐is the convention coefficient (W/m2 K),
𝑇𝑠𝑘𝑦 is the sky temperature (K),
𝑇𝑎is the air temperature (k),
R is solar reflectance or albedo of the surface,
ℇ is the emissivity of the surface,
ƛ is the thermal conductivity of the surface (W/mk), and
𝑑𝑇
𝑑𝑥 is the temperature gradient( in the x axis) [60].
If the roof has enough insulation, then solar reflectance and infrared emittance are two major
parameters that impact the roof’s thermal performance. Solar reflectance is a more significant
factor affecting the surface temperature during the day, while emissivity has less impact. On
the contrary, thermal emittance becomes the main effective factor during the night due to the
thermal performance of the roof compared to solar reflectance [60]. Note that the thermal
emittance can be reduced due to high humidity, cloudiness, or thick fog.
Replacing cool roofing material with a typical dark roof reduces cooling demands and peak
demands due to reduced heat transfer from the cooler roof surface to indoor space. There are
numerous studies about cooling energy savings using cool roof surfaces. The amount of energy
22
features, HVAC systems, and location. The effectiveness of cool roof materials is more
considerable in older buildings with little or no insulation [37, 51, 52, 61].
Using cool roof materials can also enhance the roof’s lifetime due to less daily fluctuations in
surface temperature. In large scale application, cool roof materials can mitigate the ambient air
temperature and reduce heat island effect in urban scale. As a result, the advantages of cool
roof design can be accounted for buildings, city and global scale [37, 52].
Green roofs
A green roof, also known as a vegetative roof can be defined as “an assembly of interacting
components designed to waterproof and normally insulate a building’s top surface that
includes, by design, vegetation and related landscaping elements” [62]. A green roof consists
of a soil layer (growing media), vegetation layer, and typical construction materials including
a drainage layer, roof barrier, and waterproof membrane [63]. Green roofs generally are
categorized into three different types depending on use, construction, and methods used to
carry out the work.
- Intensive greening: Intensive greening roofs consist of all sizes and types of plants including
shrubs, coppices, grassed areas, even an occasional tree. These may be planted on the same
level, at different heights, or in separate plantings around the site. They are mostly used for
commercial buildings with large green spaces.
- Simple intensive greening: Simple intensive greening roofs consist of different plants like
23
is not as wide as intensive greening. They generally need little watering and feeding, and as a
result cost less than intensive greening.
- Extensive greening: Extensive greening roofs are more commonly used for residential and
commercial buildings. Extensive green roofs comprise vegetation cultivation, which requires
little maintenance and less costs compare to intensive and simple intensive greening [64, 65].
According to the FLL Guideline for the Planning, Execution, and Upkeep of Green Roof Sites
(2002), green roofs are categorized into different types ranging from ultra-extensive to
intensive based on plant type and vegetation depth as shown in Table 2-2 [65].
Table 2-2: Standard course depths for different types of roof-greening [65]
Depth of the vegetation support
course in cm 4 6 8 10 12 15 18 20 25 30 35 40 45 50 60 70 80 90 100 125 150 200
Moss-sedum
Sedum-moss- herbaceous plants
Sedum-herbaceous-grass plants
Grass- herbaceous plants
Grass- herbaceous plants
Wild shrubs, coppices
Coppices and shrubs
Coppices
Lawn
Low- lying shrubs and coppices
Medium-height shrubs and coppices
Tall shrubs and coppices
Large bushes and small trees
Medium- sizes trees
24
The Green Roof Calculator tool uses a matrix of green roofs based on Leaf Area Index (LAI)
and soil depth, which are the most important parts in green roof effectiveness [66].
The leaf area index (LAI) is a measure of canopy density and differs based on the types of
vegetation. It has an important impact on transpiration and radiative shading and as result
thermal performance of green roof. The range of LAI is between 1.0 for grasses to more than
10 for bushes and trees. Soil depth is another important parameter for green roof design. Depth
of the soil helps to keep moisture and increase thermal resistance to heat flow. Therefore, LAI
and soil depth are effective parameters for estimating the performance of green roof. Three
alternatives of LAI (0.5, 2.0, and 5.0) and three alternatives of growing media depth (5, 15,
and 30 cm) are considered for different types of green roof (Figure 2-3) [67].
Table 2-3: Different types of green roof based on LAI and soil depth [66]
Number (Type) LAI Soil Depth (cm)
1 5 30
2 2 30
3 0.5 30
4 5 15
5 2 15
6 0.5 15
7 5 5
8 2 5
9 0.5 5
We use these nine green roof types in our calculations for different climate zones in order to
25
5cm in out of range number for soil thickness in EnergyPlus, we changed the soil depth of
green roof types of 7, 8, and 9 to 6cm.
Green roofs performance
Similar to cool roof functions, green roofs also have some reflectance and emissivity. Various
types of vegetation have different reflectivity ranges from 0.15 to 0.5. Foliage also has a high
emissivity range from 0.8 to 0.85. These values can change based on the intensity and leaf area
index (LAI). However, in green roofs, convection and evaporation play an important role for
determining roof surface temperature. The growing media and plants with evaporative cooling
and thermal mass characteristics reduce the roof surface temperature and the temperature of
the area below the roof.
When solar radiation arrives on the green layers, the visible range of radiation is absorbed,
while the near infrared radiation that causes heating is reflected. Evapotranspiration is also an
important factor for heat reduction. Some energy is converted to latent heat or evaporative
cooling through both evaporation from the soil surface and transpiration from the plants. Any
solar energy that is not reflected or removed by evaporation or transpiration is transferred into
growing media by conduction. Energy that is not taken away from surface is conducted into
the growing media and then partly absorbed by the growing media and deposited in the soil.
26 Figure 2-4: Temperature distribution of the green roof at a given diurnal time [68]
In order to understand the heat flux through the vegetation roof, the green roof can be
considered a single vegetation layer on a soil surface. The foliage of the vegetation layer has
specific characteristics such as emissivity, albedo, height, and foliage fractional coverage,
which can affect the heat exchange between the soil layer and atmosphere. The soil layer also
can be considered a homogeneous layer, as sensible latent heat passes through it. The following
phenomena should be accounted for when considering thermal performance of a green roof:
Long wave and short wave radiative interchange through plants. In addition, there are
multiple reflections between plants and the soil layer. Convective heat transfer, which is affected by foliage layer.
Evapotranspiration from the soil and vegetation.
27
The most important benefits of the green roof which are related to solar radiation are the
reduction of energy demand and expansion of the roofing membrane’s lifetime. A green roof
can protect the roofing membrane against ultra-violet (UV) radiation and prevent physical
damage due to the degeneration of insulation and roofing materials. It can block solar radiation
and decrease daily temperature fluctuations and end thermal ranges during summer and winter.
All of these benefits extend the roof’s lifetime [72].
The heat-gain and heat-loss through a green roof is mainly defined by solar radiation. A green
roof is useful for reflecting solar radiation and reducing heat absorption by evapotranspiration.
In addition, it can minimize the amount of heat transmitted through the roof membrane due to
its extra insulation. Determination of green roof materials, foliage characteristic, and soil
features affecting the roof’s thermal performance is necessary for designers [73].
In order to compute the heat transfer through a green roof, two energy balance equations need
to be solved for the foliage layer (ɸf) and soil surface (ɸg). The energy balance at the foliage
level (Ff) is demonstrated in Equation 2-5.
𝐹𝑓 = ơ𝑓 [(𝐼𝑠(1 − 𝛼𝑓) + ℇ𝑓𝐼𝑎𝑖𝑟− ℇ𝑓ơ𝑇𝑓4) +
ơ𝑓ℇ𝑔ℇ𝑓ơ
ℇ1 (𝑇𝑔
4− 𝑇
𝑓4) + 𝐻𝑓+ 𝐿𝑓
2-5
Where:
ơ𝑓 is the foliage fraction coverage,
𝐼𝑠 is the total solar irradiance,
𝛼𝑓 is the shortwave albedo of the foliage layer,
28
ơ is the Stefan-Boltzmann constant (56,685* 10 -8 W/m2 K4),
𝑇𝑓is the foliage surface temperature,
ℇ𝑔is the ground emissivity,
ℇ1is a function both of the ground and the foliage emissivity,
𝐻𝑓 is the sensible heat flux and,
𝐿𝑓is the latent heat flux.
(Hf) is considered the convective heat exchange between the foliage and the nearby air, which
is sensible heat flux, and (Lf) is considered the heat exchange due to the evaporation at the foliage level. The energy balance equation at the soil level (Fg) is presented in Equation 2-6.
𝐹
𝑔 = (1 − ơ𝑓 )[𝐼𝑠(1 − 𝛼𝑔) + ℇ𝑔 𝐼𝑎𝑖𝑟 − ℇ𝑔 𝑇𝑔4]
+ơ𝑓ℇ𝑔ℇ𝑓ơ ℇ1 (𝑇𝑔
4− 𝑇
𝑓4) + 𝐻𝑔+ 𝐿𝑔+ 𝐾 ∗
Ə𝑇𝑔 Ə𝑧
2-6
Where:
𝛼𝑔 is the shortwave albedo of the ground,
𝐼𝑎𝑖𝑟 is the total infrared irradiance,
𝐻𝑔 is the sensible heat flux,
𝐿𝑔 is the latent heat flux,
K is the ground conductivity,
29 Figure 2-5: The Energy Balance for a Green Roof [39]
Based on the previous equations, the properties of the soil and vegetation layers influence the
thermal behavior of green roofs (Figure 2-5).
A green roof’s equivalent periodic thermal transmittance can be calculated considering the
equivalent outside temperatures (Θe,eq) and the heat flux (ɸ), as in Equation 2-7.
𝑌𝑖𝑒 =
(𝛷𝑐𝑜𝑛𝑑,𝑠𝑖,𝑚𝑎𝑥 −𝛷𝑐𝑜𝑛𝑑,𝑠𝑖,𝑚𝑖𝑛 ) 𝑠𝑖𝑑𝑦𝑛,𝐶𝑇𝐹 (𝜃𝑒,𝑒𝑞,𝑚𝑎𝑥 −𝜃𝑒,𝑒𝑞,𝑚𝑖𝑛 )
2-7
This equation takes into account the thermal inertia of green roof components, density and
specific heat of the soil, and outdoor temperature, which have more impact on the thermal
behavior of the green roof. According to research on the thermal behavior of green roofs, the
main parameters of components significantly affecting the Yie value are the LAI value and soil
thickness. In a roof with little or no insulation, the effectiveness of the design parameters are
30
The design parameters of software implementation in calculating green roofs’ heat flux are
presented below:
Height of plants: Limited to the value of 0.01m <height<1.0m.
Leaf area index: Leaf area per unit area of soil surface, ranging from 0.001<LAI<5.0.
Leaf reflectivity: Ratio of incident solar radiation reflected, ranging from 0 to 1.
Leas emissivity: Ratio of thermal radiation emitted from leaf surface compared to black
body at the same temperature, ranging from 0 to 1.
Minimum stomatal resistance: Plant’s resistance to transport moisture in units of s/m,
normally ranging from 50.0 to 300.0 s/m.
Roughness: Related to the roughness of a particular material layer. Possible options for
this characteristic are “Very Rough,” “Rough,” “Medium Rough,” “Medium Smooth,” “Smooth,” and “Very Smooth.”
Thickness: Depth of the growing media layer in meters.
Conductivity: Thermal conductivity of the growing media relating to the wet or dry
environment (W/(m-K).
Density: Density of the dry growing media (kg/m3).
Specific heat: Specific heat of growing media in units of kg/m3.
Absorbance: Ratio of long wave radiation absorbed by growing media (solar, thermal,
visible).
The software uses these parameters to calculate vegetation and soil temperature as well as the
31 Photovoltaic Systems
Renewable energy application has received a great deal of attention in recent years. Solar
photovoltaic systems convert sunlight directly into electricity and generate pollution-free
energy. They can be installed on the roof as well as on the wall of commercial buildings. The
solar cells of PV systems contain light-absorbing materials in the cell structure to absorb
photons and generate electricity through the photovoltaic effect.
PV Components:
PV systems consist of several core and optional components as shown in Figure 2-6.
Figure 2-6: PV systems Components [75]
Raking Systems:
Raking systems support the PV components and attach them to the roof or to ground- mounted
construction. They must be secure and hold the PV systems under wind or snow loading.
Tracking systems:
Tracking systems increase the efficiency of PV systems by rotating the PV arrays to track sun
direction throughout both the day and year. They typically are installed on ground-mounted
32 Battery Storage Systems:
Battery storage systems are used in off-grid facilities. The extra energy generated can be stored
and used when the grid is not available. The economic viability of battery storage systems are
based on various factors such as electricity price, weather conditions, and the size of PV
pr
![Table 2-2: Standard course depths for different types of roof-greening [65]](https://thumb-us.123doks.com/thumbv2/123dok_us/1216842.1152949/39.612.93.542.330.615/table-standard-course-depths-different-types-roof-greening.webp)
![Figure 2-5: The Energy Balance for a Green Roof [39]](https://thumb-us.123doks.com/thumbv2/123dok_us/1216842.1152949/45.612.172.458.90.292/figure-energy-balance-green-roof.webp)


![Figure 3-3: Uniform series of cash flow [135]](https://thumb-us.123doks.com/thumbv2/123dok_us/1216842.1152949/73.612.185.434.189.423/figure-uniform-series-cash-flow.webp)
![Table 3-1: Average Electricity Cost to the Ultimate Customers (Cents per Kilowatt hour) [141]](https://thumb-us.123doks.com/thumbv2/123dok_us/1216842.1152949/87.612.88.542.340.560/table-average-electricity-cost-ultimate-customers-cents-kilowatt.webp)
