ABSTRACT
STANDISH, III, WILLIAM RARIDEN. A Validation Study of Self-Reported Behavior: Can College Student Self-Reports of Behavior Be Accepted as Being Self-Evident? (Under the direction of Paul D. Umbach).
The dearth of institution-reported data describing college student behaviors forces higher education researchers to rely upon self-reported behaviors collected via surveys and summarized by the survey statistic. If bias is present and substantive, the invalid, self-reported input data threatens the validity of research conclusions that guide co-curricular and academic policies and best practices at institutions of higher education. This study evaluates the premise of self-reported data validity upon which survey research is based. Potential sources of bias include (1) response bias from inaccurate self-reporting and (2) nonresponse bias where characteristics of respondents differ from those of nonrespondents. The
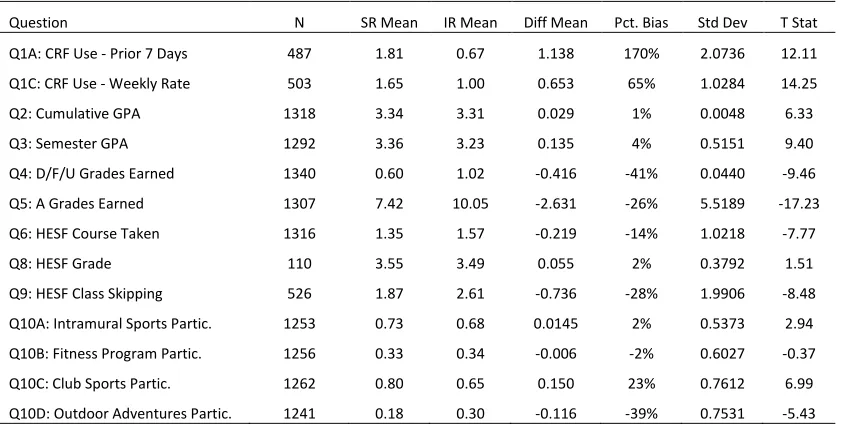
combine to misstate behavior by at least 20%. The behaviors most affected are CRF use, which is overstated by 112% to 248%; semester GPA self-reports of 3.36 versus an actual value of 3.04; and co-curricular participation that misstated by between -21% to +46%. This validation study sufficiently demonstrates that measurement error and nonresponse error are present in the self-reported data collected for the commonly studied topics in higher
A Validation Study of Self-Reported Behavior: Can College Student Self-Reports of Behavior Be Accepted as Being Self-Evident?
by
William Rariden Standish, III
A dissertation submitted to the Graduate Faculty of North Carolina State University
in partial fulfillment of the requirements for the degree of
Doctor of Philosophy
Educational Research and Policy Analysis
Raleigh, North Carolina 2017
APPROVED BY:
_______________________________ _______________________________
Dr. Paul D. Umbach Dr. Stephen Porter
DEDICATION
This work is dedicated to my family,
BIOGRAPHY
Trey Standish (more formally William Rariden Standish, III) was born in Indianapolis and raised in Charlotte and Glen Ellyn, Illinois. Since earning a Bachelor’s of Science in
Economics from North Carolina State University, he has remained dedicated to the idea of living in Raleigh where he has resided since 2006 with his wife Adrian and children Paige and Will. In between, he earned a Master’s of Arts in Higher Education Administration and a Master’s of Arts in Sports Management from Appalachian State University in Boone, NC, a Master’s of Arts in Applied Economics from The University of North Carolina – Greensboro in Greensboro, NC, and forecasted McDonald’s Happy Meal toys from Chicago, IL.
Values instilled by his family and experiences at North Carolina State University cause Trey to believe in the mission of public higher education as historically applied by the state of North Carolina. Students that attend the universities and the communities
surrounding them are incalculably improved by their investment. Trey’s career began in student affairs, and he continues his service as he quantitatively supports North Carolina State University as an institutional researcher, enrollment planner, and currently the Senior Research Data Analyst in the office of Enrollment Management and Services. In these roles, he forecasts student enrollment, evaluates the experiences of students, and assists university stakeholders with program development.
In his spare time, Trey enjoys spending time with his family and pursues several hobbies including woodworking, reading, gardening, and watching NC State basketball. He is particularly proud of earlier-in-life accomplishments including competitive chess,
ACKNOWLEDGMENTS
The process of writing this dissertation has challenged me in almost every way. Its completion is both a relief and a great reward. I could not have completed this this work without the support of my university, communities, and family whom I would like to acknowledge.
First, I would like to thank my committee for their insight and guidance. My chair, Dr. Paul Umbach, has an encyclopedic mastery of the literature and has efficiently guided me to the best references and resources to assist my studies. Dr. Stephen Porter has provided theoretically based direction that immensely improved this work. Dr. Carrie Zelna was among my first staff contacts as an undergraduate student and remains a valued mentor in my student and professional life. Dr. Michael Mullen is a continued voice of encouragement and inspiration for my professional pursuits. I would also like to thank all the faculty and staff from many academic units that contributed to my dissertation’s completion. The student support resources offered by North Carolina State University are invaluable and adaptive to student needs.
Division of Academic and Student Affairs has provided timely and accurate data without which I could not continue my study.
I would also like to thank my family and friends who maintained a supporting and understanding community from which I could work. Each in your own way have contributed to my dissertation’s completion. In particular, I would like to thank my mother for allowing
me to vent frustrations, and my parents, siblings, and other close relatives who have worked around my schedule. For many years, I remained hard to find and distracted from my relationships while I wrote the dissertation. I have missed you all and look forward to spending more time with you all.
Finally, I would like to thank my wonderful wife Adrian for all that she has done during the years I dedicated to this study. She has lived with and parented with a husband whose mind was constantly split between academics and being a husband and father. She has been a constant source of support, motivation, and encouragement throughout my studies, and I would not have been able to complete this project without her. She has
TABLE OF CONTENTS
LIST OF TABLES ...x
LIST OF FIGURES ... xii
CHAPTER 1: INRODUCTION ...1
Importance of Study ...1
Statement of Problem ...4
Purpose of Study ...5
Significance of Proposed Research ...7
Theoretical Framework ...9
Comprehension ...9
Retrieval ...9
Judgment ...10
Reporting ...10
Prior Research ...11
Overview of the Study ...15
Data ...16
Study sample...16
Validation data ...17
Survey instrument ...17
Quantitative Methods ...18
Definition of Terms ...19
Campus recreation facility (CRF) ...19
Campus recreation facility use ...19
Health/Exercise studies (HES) ...20
Physical education requirement ...20
CRF-based co-curricular program ...20
Limitations of Study ...21
Chapter Summary ...22
CHAPTER 2: LITERATURE REVIEW ...23
Theoretical Construct ...23
Comprehension ...26
Retrieval ...28
Judgment [For Factual Questions] ...29
Reporting and Response Selection ...31
Prior Research ...32
Survey Life Cycle ...34
Measurement Process of the Survey Life Cycle ...35
Measurement Error ...35
Processing Error ...36
Representation Process of the Survey Life Cycle...36
Coverage Error ...37
Nonresponse Error...37
Adjustment Error ...38
Response Bias and Measurement Error in Measurement Process ...38
Social Desirability Bias ...43
Marlowe Crown Social Desirability Scale ...47
Exercise Identity...49
Validation Studies ...51
Self-Reported Physical Activity ...53
Age ...55
Gender ...55
Ethnicity ...56
Body Type ...56
Skill Level and Interest ...56
Temporal Factors ...57
Social Desirability ...57
Self-Reported Class Absenteeism ...59
Nonresponse Bias and Nonresponse Error in Representation Process ...59
Nonresponse Research ...66
Survey Instrument Design ...70
Chapter Summary ...71
CHAPTER 3: METHODS ...75
Research Design ...75
Research Questions ...76
Institution Reported Data ...78
Student background data ...79
Validation data ...82
Survey Instrument ...86
Study Sample ...97
Data Storage ...101
Data Summary ...103
Methods ...103
RQ1: Validity Estimation ...105
Intergroup comparisons ...107
Estimates of bias ...108
RQ2: Social Desirability Bias ...109
Methods Summary ...115
Limitations, Ethical Considerations, and Other Concerns ...116
Limitations ...116
Ethical Considerations...117
Other Concerns ...117
Chapter Summary ...118
CHAPTER 4: RESULTS ...119
Institution Reported Data Summary ...121
Question 1A: Prior 7 Days of CRF Use ...122
Question 1C: Prior Academic Year of CRF Use ...123
Question 2: Cumulative GPA ...123
Question 3: Fall 2015 Semester GPA ...123
Question 4: Total D/F/Unsatisfactory Grades ...123
Question 5: Total A Grades Earned ...124
Question 6: Total PE/HES Courses Taken ...124
Question 7: PE/HESF 100 Level Course Taken ...124
Question 8: Grade Earned in PE/HESF 100 Level Course ...124
Question 9: PE/HESF Class Skips ...125
Question 10A, 10B, 10C, and 10D: Co-Curricular Participation ...125
Review of Research Questions ...128
Research Question 1 ...128
Research Question 1A...129
Respondent demographics ...130
Student cumulative grade point average ...133
SAT Score ...139
Satisficing behaviors ...143
Student participation in co-curricular activities ...147
Research Question 1B ...150
Reference period changes and CRF use...154
GPA self-reports...156
Recall of facts...157
Social desirability bias ...159
Research Question 1C...160
Question 1A: CRF use by prior 7 day count response options ...161
Question 1B: CRF use by Likert scale ...164
Question 1C: CRF use by rate based estimation...166
Response option comparison ...168
Response time comparison ...170
Research Question 1D...174
Nonresponse error ...175
Measurement error and nonresponse error interaction ...180
Research Question 2 ...183
Research Question 2A...184
Research Question 2B ...190
Conclusion ...195
CHAPTER 5: IMPLICATIONS AND CONCLUSION ...197
Theory, Previous Research, and Implications ...199
Research Question 1 ...200
Research Question 1A...200
Research Question 1B ...205
Implications ...206
Research Question 1C...208
Implications ...208
Research Question 1D...213
Implications ...213
Research Question 2 ...214
Research Question 2A...214
Implications ...217
Research Question 2B ...220
Implications ...221
Discussion, Implications, and Future Research ...222
Limitations and Advantages ...222
Limitations ...222
Advantages...224
Implications for Online College Student Survey Research ...225
Future Research ...227
Conclusions ...231
REFERENCES ...234
APPENDICES ...249
Appendix A: Question 1: CRF Use ...250
Appendix B: Question 2: Cumulative GPA ...254
Appendix C: Question 3: Fall 2015 Semester GPA ...256
Appendix D: Question 4: D/F/Unsatisfactory Grades Earned ...258
Appendix E: Question 5: A Grades Earned ...259
Appendix F: Question 6: PE/HES Courses Taken ...261
Appendix G: Question 7: Most Recent PE/HESF 100 Courses Taken ...262
Appendix H: Question 8: Grade Earned in Most Recent PE/HESF 100 Level Course ...263
Appendix I: Question 9: PE/HESF 100 Level Course Class Skipping ...264
Appendix J: Question 10: Co-Curricular Participation ...266
Appendix K: Questions 11 to 23: Shortened Marlowe-Crowne Social Desirability Scale ...270
Appendix L: Question 24: Belief Exercise is Important to Academic Success ...276
Appendix M: Question 25: Share of Physical Activity Occurring Inside CRF ...277
Appendix N: Question 27: Open Ended Question 1 ...278
LIST OF TABLES
Table 2.1 The Model Response Process ...26
Table 3.1 Survey Instrument to Prior Research Question Map ...94
Table 3.2 Data Summary ...99
Table 3.3 Sample Size Requirements ...102
Table 3.4 Over Reporting Ratios ...111
Table 3.5 Duncan Test Sample ...114
Table 4.1 T test on Unit Level Self-Reported Mean Equal to Institution Reported Mean .131 Table 4.2 Cumulative GPA by Question and Reporting Accuracy ...135
Table 4.3 Over Reporting to Underreporting Ratio by Respondents’ Cumulative GPA ...136
Table 4.4 SAT Score by Question and Reporting Accuracy ...140
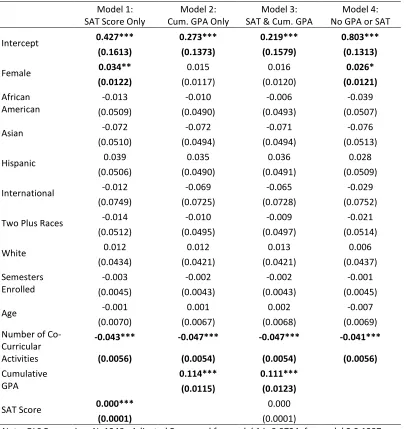
Table 4.5 Regression on Response Accuracy by SAT Score and Cumulative GPA ...143
Table 4.6 Satisficing Metrics and Response Accuracy by Cumulative GPA Quintile ...146
Table 4.7 Percentage of Questions Answered Correctly by Student Description ...149
Table 4.8 Years Enrolled by Question and Reporting Accuracy ...152
Table 4.9 Correlation of Self-reported and Institution-reported CRF Use Metrics ...155
Table 4.10 Career Length and Self-Reported GPA Accuracy ...158
Table 4.11 Correlation of Self-reported CRF Usage Metrics with Institution Reported. ...170
Table 4.12 Comparison of Response Options to Survey Responses Period ...173
Table 4.13 T Test on Respondent Mean Minus Nonrespondent Mean is Not Equal to Zero† ...176
Table 4.14 T Test for Differences Between Self-Reported Mean and Actual Sample Mean† ...182
Table 4.15 Over Reporting to Underreporting Ratio by Question ...187
Table 4.16 2015-16 CRF Use by Maximum Historical CRF Use Rate ...189
Table 4.17 Regression on MCSDS and Likelihood to Over Report ...193
Table A.1 Summary of Question 1A Results ...250
Table A.2 Duncan Groupings by Question 1A Response ...251
Table A.4 Summary of Question 1C Results ...252
Table A.5 Duncan Groupings by Question 1C Response ...252
Table B.1 Summary of Question 2 Results...253
Table C.1 Summary of Question 3 Results...256
Table D.1 Summary of Question 4 Results ...258
Table E.1 Summary of Question 5 Results ...259
Table F.1 Summary of Question 6 Results ...261
Table G.1 Summary of Question 7 Results ...262
Table H.1 Summary of Question 8 Results ...263
Table I.1 Summary of Question 9 Results ...264
Table J.1 Summary of Question 10A Results ...266
Table J.2 Summary of Question 10B Results ...267
Table J.3 Summary of Question 10C Results ...268
Table J.4 Summary of Question 10D Results ...269
Table K.1 MCSDS Scores by Demographics and Background ...270
Table K.2 Duncan Groupings by MCSDS Score ...271
Table K.3 Logistic Regression on Likelihood to Over Report 7 Days of CRF Use ...273
Table K.4 Logistic Regression on Likelihood to Over Report Prior Year CRF Use ...275
Table N.1 Open-ended Question Length by Demographics and Background...278
LIST OF FIGURES
Figure 2.1 The survey life cycle ...34
Figure 2.2 Alternative causal model ...61
Figure 3.1 Survey instrument ...86
Figure 3.2 Leniency Score Plot ...108
Figure 3.3 Ration of reporting by MCSDS score ...112
Figure 4.1 Percent of questions over reported and GPA ...137
Figure 4.2 Percentage of questions correctly reported by GPA and SAT score ...141
Figure 4.3 Percent of questions correctly reported by years enrolled ...153
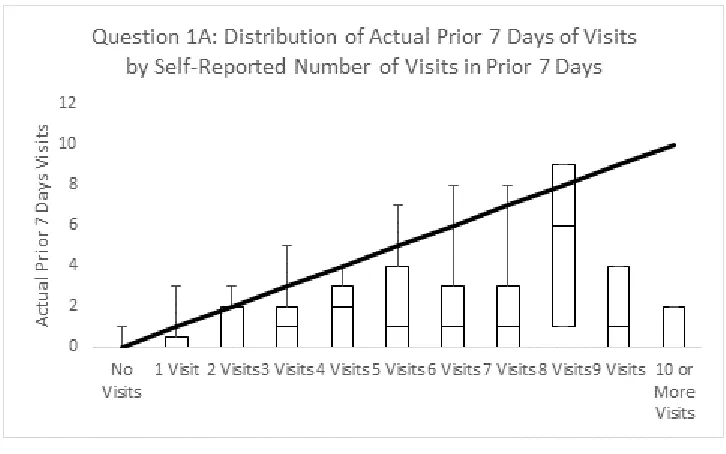
Figure 4.4 Question 1A: self-reported and institution-reported CRF use ...163
Figure 4.5 Question 1A by reference period ...163
Figure 4.6 Distribution of question 1B responses ...165
Figure 4.7 Distribution of question 1C results ...167
Figure 4.8 CDF by GPA and response status ...177
Figure 4.9 Over reporting to underreporting ratio by response rate ...188
Figure 4.10 Over reporting rates by MCSDS score ...194
Figure A.1 CDF of question 1A ...253
Figure A.2 CDF of question 1C ...253
Figure B.1 Self-reported and institution-reported cumulative GPA ...254
Figure B.2 CDF of question 2...255
Figure C.1 Self-reported and institution-reported semester GPA ...257
Figure C.2 CDF of question 3 ...257
Figure D.1 CDF of question 4 ...258
Figure E.1 Distribution of self-reported and institution-reported A grades earned ...260
Figure E.2 CDF of question 5...260
Figure F.1 CDF of question 6...261
Figure H.1 CDF of question 8 ...263
Figure I.1 Self-reported and institution-reported class skipping ...264
Figure J.1 CDF of question 10A ...266
Figure J.2 CDF of question 10B...267
Figure J.3 CDF of question 10C...268
Figure J.4 CDF of question 10D ...269
Figure K.1 MCSDS score and over reporting ...272
Figure L.1 CRF use by question 24 ...276
Figure M.1 Distribution of question 25 ...277
CHAPTER 1: INTRODUCTION
This validation study tests the validity of self-reported student behaviors using institution-reported validation data. A sample of North Carolina State University (NCSU) undergraduates received a survey instrument to self-report co-curricular participation, class attendance, and academic performance. Student self-reports are merged with corresponding institution reported records to test for the presence of biases and the suitability of the survey statistic as an estimate of actual sample and target population behavior. This topic is relevant to higher education research because it tests the assumption that self-reported data on college student behavior is a valid measure of actual behavior.
Importance of Study
recreational facility (CRF) use data has been archived since 2006 allowing an actionable amount of CRF use data to accrue. Each CRF transaction records the student who entered, the time of entry, and their purpose of entry. In the context of this study, there are no
technical barriers to using CRF transactional data to compare actual CRF use to self-reported student descriptions.
Survey methods are an indispensable tool in the study of higher education. The validity of self-reported, survey data is instrumental to interpreting research conclusions that describe the effect of behavior on student outcomes. Sampling and survey data collection are cost effective methods for estimating the occurrence of specific behaviors among the target population (Pike, 1999a). Higher education researchers estimate gains from curricular interventions by collecting baseline data and comparing them to subsequent reports (Pike, 1999a). Other researchers use survey data to measure institutional climate and conduct needs assessments that shape services to benefit their campus community. Survey methods can collect summative data for accountability and formative data to improve institutional programs. Whatever a researcher’s goal, customized survey instruments collect behavioral measures that specifically target the researcher’s questions (Kuh et al., 2001). For these
researchers, the validity of survey data is a meaningful issue that is rarely explored (Pike, 1995).
Institutional researchers, cross-institutional groups, and faculty researchers study psychological development, learning, and public policy by collecting survey data to describe student behavior (Pike, 1999a). For institutions of higher education, participant
evaluating curricula on improving student outcomes (Astin & Antonio, 2012; Eaton, 2012). Federal, accreditor, and state agencies are examples of cross institutional groups which rate and regulate institutions of higher education with ever-expanding scope and influence (Dougherty, Natow, Bork, Jones, & Vega, 2013; Eaton, 2012). To evaluate student safety and satisfaction, these agencies mandate campus climate surveys about sensitive behaviors; requirements to survey students about sexual assaults are a recent example (Koss, Wilgus, & Williamsen, 2014). Finally, public or institutional policy is guided by the work of ad hoc researcher teams’ aggregated individual surveys used to estimate the occurrence of behaviors theorized to impact outcomes. For example, universities may require students to live in campus residence halls if survey data suggests it improves the likelihood of degree
attainment. Collect direct measures of past behavior is prohibitively costly so researchers instead use survey samples to make inferences about target populations (Tourangeau, Rips, & Rasinski, 2000). The validity of self-reported behavioral data is germane to the use of
samples as substitutes for populations.
with circumstantial evidence rather than actual memory (Tourangeau, et al, 2000).
Additionally, respondents often intentionally misreport behavior for sensitive subjects, which is sometimes referred to as intentional misreporting. As Tourangeau, et al. (2000) explains, “This notion of sensitive questions presuppose that respondents believe there are norms
defining desirable attitudes and behaviors, and that they are concerned enough about these norms to distort their answers to avoid presenting themselves in an unfavorable light.” (p.
257). Social desirability bias describes the systematic phenomenon of respondents inflating the incidence of socially accepted behavior by lying or biasing their responses in the acceptable direction. Within the context of the Model of Response Process (Tourangeau, 1984, 1987), this study tests the validity of self-reporting behaviors with an emphasis on how accurately memories are retrieved, how social desirability bias distorts the survey statistic, and the generalizability of the survey statistic to the target population.
Statement of Problem
Though much research has addressed outcomes of co-curricular and academic experiences of college students, the premise upon which those studies have been conducted needs further validity study. Because researchers have been unable to collect original data participation records for such experiences, much reliance has been placed upon self-reported survey data. However, because participants may not provide reliable data when surveyed, this methodology needs further examination. This validation study uses institution reported data sets to tests the presumed validity of self-reported college grades, college class
Purpose of Study
The purpose of this study is to validate college student self-reported behaviors with an emphasis on social desirability bias and the accuracy of recent memories compared to those of months or years. Past validation studies are conducted neither for large numbers of students nor for behavioral topics often used to evaluate higher education outcomes. As such, the literature establishes an unmet need for this validation study.
Research Questions
The research questions use the Model of the Response Process by Tourangeau (1984, 1987) to evaluate the accuracy of self-reported survey data. Specifically, the research questions are:
1. To what extent can students accurately self-report past co-curricular and academic behaviors to researchers of higher education? Can higher education researchers presume students provide accurate self-reported behavioral information?
a. What student characteristics are associated with the most accurate and inaccurate self-reporters? Do demographic or background characteristics affect accuracy in self-reporting? Do students with high collegiate GPAs or standardized test scores more accurately self-report behaviors? Do
participatory students provide more accurate self-reported behavioral data? b. Does the passage of time affect the accuracy of self-reported behaviors? Are
c. Do vague qualifiers or excessively complex response options affect the validity of self-reported behavior?
d. Are sample means of self-reported behaviors valid estimates of target population means?
2. Does the perceived social desirability of a behavior being reported lead to systematically invalid bias from over reporting positive behaviors?
a. Do social norms cause students to systematically over report the incidence of socially desirable behaviors such as physical activity, class attendance, and high grades earned? Are self-reported respondent means of socially desirable behaviors less valid estimates of behaviors than those from more socially neutral behaviors?
b. Does the MCSDS score improve predictions for the probability that a student over reports socially desirable behavior and/or underreports a socially
undesirable behavior?
The first research question (RQ1) tests the retrieval and judgment components of the Model of the Response Process by testing the validity of self-reported data as a representation of actual behavior across the target population. Student characteristics are tested for a statistically significant correlation with the student’s accuracy in self-reporting, including
measures of student ability, observed co-curricular participation, and other institution
desirability of the behavior and the respondent’s propensity for self-monitoring (e.g., presenting one’s self more favorably than is actually true).
Finding systematic biases is generally cause for concern but not a prima fascia invalidation of the survey statistic. Random differences between the survey statistic and actual population means are inevitable in the sampling process and can be corrected with statistical techniques. In some cases, the systematic bias may improve the survey statistic because respondents make adjustments that more accurately measure the construct as
intended by the researcher (Kuncel, Crede, & Thomas, 2005). In other cases, the magnitude and direction of misreporting is consistent across all respondents, resulting in a level shift of the survey statistic that does not affect the correlative relationship (Kuncel et al., 2005). In most cases, however, systematic bias is a threat to the validity of a study’s findings, and the systematic biases in self-reporting must be identified and the degree of threat bias poses to the validity of the research conclusions determined.
Significance of Proposed Research
The validity of the survey statistic as an estimate of actual target population behaviors is theoretically well explored, but there remains an unmet need for validation studies on self-reported college student behavior (Porter, 2011). Despite this, the study of higher education has progressed onward because “the tacit agreement in postsecondary research seems to be that validity is assumed until proven otherwise” (Porter, 2011, p. 73). This study questions
behavior. This research is unique because it draws upon access to a directly measured validation data set, which describes student level co-curricular CRF use, Health/Exercise Sciences (HES) class attendance, and collegiate grades. The institution reported data allows for location of predictors of accurate reporting with an MCSDS score, characteristics of students, and behaviors of students. Though prior studies have isolated portions of the data available here, there are no known examples of validation studies utilizing such diverse data.
Tourangeau (1984, 1987) theorizes that taxing respondents’ memory causes less accurate
retrieval of information, particularly for memories of periods further in the past and for more detailed events; less accurate retrieval materializes as less accurate reporting. The current study tests Tourangeau’s theory by asking respondents to describe behaviors retrieved from
recent events (7 days) to distant events (months or years). Furthermore, Tourangeau et al. (2000) hypothesize that respondents tend to edit survey responses for questions on socially desirable items like class skipping and exercising regularly. This study tests the hypothesis by asking respondents to self-report behaviors that can be biased toward social norm
conformity. Confirmation of these theories may call into question the validity of complicated and/or socially desirable behaviors commonly self-reported in surveys.
to complete two HES academic courses, nearly all of which meet in the CRF. Offices for academic and student affairs professionals are located within the facility to enable frequent student to faculty/staff contact. Almost all prior CRF assessment uses surveys describing CRF facilities as assets for building community, wellness, and facilitating engagement (Bryant & Bradley, 1993; Lindsey & Sessoms, 2006; Hall, 2006; Haines, 2001; Miller, Noland, Rayens, & Staten, 2008). Finally, the CRF is capital intensive and implies
accountability from stakeholders (Mahoney, 2011; Upcraft & Schuh, 1996; Supiano, 2008). Theoretical Framework
The research in this study is conducted within the Model of the Response Process by Tourangeau (1984, 1987) as applied to factual questions (Tourangeau et al., 2000). Widely accepted among survey researchers, the Model of Response Process stratifies considerations of survey respondents into four components: comprehension, retrieval, judgment and
reporting, and response selection. A thorough understanding of these four components is critical to the current study (a more detailed discussion follows in chapter 2).
Comprehension. Comprehension describes respondent issues related to understanding the survey instructions, understanding the question, and understanding the information requested (Tourangeau et al., 2000). An example of a comprehension component threat to validity is the mismatch between information requested by the researcher and how the
request is understood by the respondent; this mismatch often occurs because word definitions are unknown or not commonly perceived.
inferential conclusions reached from partially recalled memories (Tourangeau et al., 2000). An example of a retrieval component threat to validity is a participant’s inability to
accurately recall events from long term memory; this is especially problematic if the request is complex or requires descriptions of long-past, day-to-day events.
Judgment. The judgment component for factual questions involves how a respondent merges various retrieved memories or supplements partially retrieved memories with imputed information (Tourangeau et al., 2000). Imputed information describes how a respondent uses retrieved information and estimation strategies that draw conclusions on aggregate behaviors by (1) recalling and counting memories; (2) making estimates of rates per time period multiplied by number of time periods; or (3) assigning total rates from vague impressions of past behavior (Groves, Fowler, Couper, Lepkowski, Singer, & Tourangeau, 2009). An example of a judgment component threat to validity occurs when respondents cannot retrieve a fact and instead describe their behavior based on an impression of their behavior compared to an arbitrary understanding of average behavior.
Reporting. Reporting and response selection describes how respondents map their best estimates of a behavior to the possible responses offered by the survey instrument
(Tourangeau et al., 2000). An example of a reporting and response component threat to validity is the desire to present oneself more favorably than the retrieved memory recalls (i.e. self-monitoring).
that influence responses in one component may cause responders to reconsider their response from a prior component. Respondents do not treat the components as linear steps and instead move iteratively between the components, often reconsidering their initial response in light of considerations developed in later components (Tourangeau et al., 2000). If respondents are comfortable with their answer or do not seriously consider the survey request, they may not use all four components when answering a survey. The layout of the survey instrument and question design affects the respondent’s navigation through the four components, making
the accuracy of the self-reported behaviors a function of interaction between the survey instrument and the respondent. While one component doesn’t exist in isolation, the research questions of this study focus on the retrieval, judgment, and response and reporting
components of the Model of Response Process. Prior Research
non-random errors because such errors do not offset and can bias the survey statistic, thereby threatening the validity of research conclusions.
The first focus of this study is on testing for measurement errors in self-reported
behaviors caused by the survey instrument. Systematic, non-random errors committed across large portions of the sample result in response bias in the survey statistic. Response bias occurs when the survey instrument causes significant portions of the sample to systematically deviate their self-reported measures from the true value in the same direction and/or
magnitude. The response bias is measured as the difference between the expected value of an individual’s response and the actual value across the target population of the survey.
Common causes for the response bias include an inability to retrieve the requested
information properly and intentional misreporting of the information to present one’s self in a
more favorable light (Groves et al., 2009). This study estimates the deviation between the expected value of a response (i.e. sample mean) and the mean of the measure across the target population and attempts to explain the differences by other factors. This is framed within the context of information retrieval problems and intentional misreporting. Researchers have debated the presence and effect of measurement error on the validity of research conclusions, but few have validated self-reported behaviors among college students.
Nonresponse bias is measured as the difference between the actual, aggregated measures of behavior among respondents and nonrespondents that distort survey means. Thus, the second focus of this study is testing for nonresponse errors in self-reported behaviors that result from differences in actual behavior among respondents and nonrespondents.
bias in the survey statistic. Nonresponse bias is a threat to validity when the characteristics that define nonresponse propensity are correlated with or caused by the surveyed behavior (Groves, 2006). This study estimates the deviation between the actual behavior of
respondents (i.e., sample mean) and the mean of the measure across the sample, including nonrespondents. Researchers have explored the theoretical aspects of nonresponse bias on the validity of research conclusions, but data availability constrains the analysis of
nonresponse error in self-reported behaviors among college students.
administers a survey instrument specifically designed to solicit responses about the available data.
Student development theory consistently finds evidence that co-curricular participation has a positive effect on grades and persistence (Torres, 2011), but the field remains wanting for direct institution reported measures of participation (Upcraft & Schuh, 1996). Surveys are often used to describe student behavior because the lack of institutional data forces higher education researchers to rely on self-reports of participation and participation intensity
(Porter, 2011). For example, many studies evaluate the impact of Living Learning Villages (LLV) on student outcomes but rely on survey data to discern the intensity of curricular participation and feelings of community inclusion (Stassen, 2003; Pike, 1999a; Pike,
Schroender, & Berry, 1997; Inkelas & Soldner, 2011). Meanwhile, institution-reported data typically describes participation as binary without regard to a number of a student’s
day-to-day participation intensity. This study uses institution-reported databases to compare actual behaviors with self-reported behaviors on the number of times a student attends CRF-based, and co-curricular participation in activities such as intramural sports, club sports, Outdoor Adventures, etc.
The presence of social desirability bias in self-reported data is well established. Respondents tend to over report socially desirable behaviors like seat belt use and voting while underreporting socially undesirable behaviors like smoking and illicit drug use
that exercise is extremely susceptible to social desirability bias with over reporting of exercise rates exceeding that of taboo sexual acts, drug use, cigarette smoking, drinking and driving, and abortions. Because students view learning and developmental gains as socially desirable, those topics are susceptible to social desirability bias as students over report or overestimate the impact of their curriculum (Bowman, 2014; Pike 1999b). Therefore, the validity of findings that extol the benefits from CRF programs and informal recreational activity (Rothewell & Theodore, 2006) require further evaluation using a validation data set to locate biases.
Overview of the Study
In all manner of settings, researchers collect survey data to describe respondents’ past
behaviors and to make subsequent conclusions about how behaviors affect outcomes. Rather than focus on responses to an individual survey, most survey research summarizes data from completed surveys to create the survey statistic or a concise description of behaviors within the target population. The survey statistic is an input to models estimating the effect of student behaviors on student outcomes; the validity of models is dependent on the validity of the survey statistic. Groves et al. (2009) describes a valid survey construct as one for which the survey instrument clearly articulates a question for which respondents accurately report information, as intended. The survey statistic also requires respondents to possess similar characteristics as Nonrespondents, or it will over represent behaviors correlated with
must be free from systematic bias. This validation study uses a large transactional data set to detect systematic bias in self-reported behavior described by a survey statistic.
Data
Data for this study is collected from several units at NCSU, including The Office of Institutional Research and Planning (OIRP), Division of Academic and Student Affairs (DASA), and data collected from a custom survey instrument. After obtaining Institution Review Board (IRB) approval, I requested data from the respective units and conducted my survey with a 6,000 student sample randomly selected from the target population of all NCSU bachelor’s degree students. OIRP uses student identification numbers to combine
data sets but protects student identities by stripping personally identifiable information from the research data set.
Study Sample. The target population is the “group of elements for which the survey investigator wants to make inferences by using sample statistics” (Groves et al., 2009, p. 69).
undercoverage. The sample is selected from the sample frame using a simple random sampling without replacement.
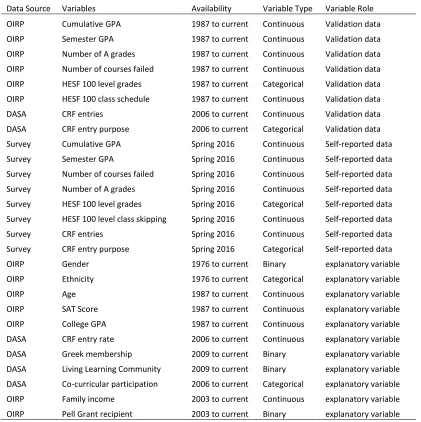
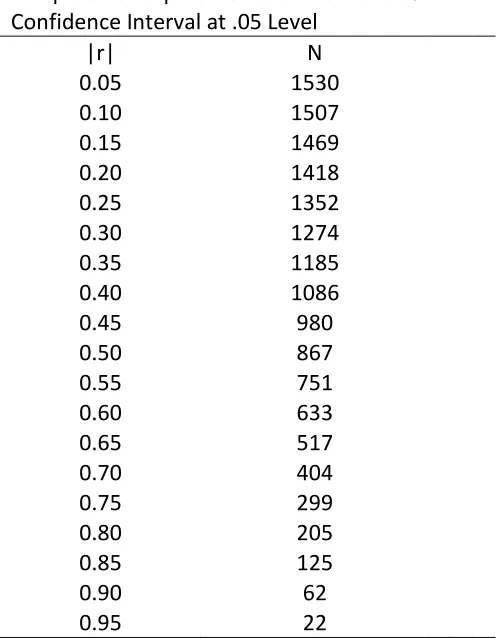
Validation data. OIRP provides the researcher with student level data in SAS flat files which describe (1) demographic data (including gender, ethnicity, and age); (2) measures of ability (including standardized test scores, high school GPA, collegiate GPA, and number of courses failed); and (3) external validation data (including collegiate GPA; number of courses failed; Health/Exercise Studies Fitness [HESF] course grades and attendance; number of CRF entries; and CRF-based co-curricular participation). The validation data provides both the actual self-reported and the actual population means and measures of variance. The sample size and respondent count provide enough observations for a 95% confidence level for the target population. Typical response rates for dissertation surveys and suggested required sample size of 1,150 is surpassed fivefold.
Survey instrument. This study uses a customized survey instrument to collect information on self-reported student behaviors with an emphasis on socially
to 9 years. Because this study informs the researchers on biases that may affect research findings, this study’s question design mimics survey questions from prior studies.
Quantitative Methods
This validation study uses Model of the Response Process by Tourangeau (1984, 1987) to evaluate the validity of self-reported behaviors described in a survey administered to a
random sample of undergraduate students at NCSU. To assess the accuracy of self-reported college student behavior, the self-reported, level survey data is merged with student-level validation data provided by OIRP and DASA. Among all respondents, I attribute the percentage of self-reported variance as being valid variance, systematic invalid variance, and random error. Valid variance is self-reported data associated with actual variance observed in the validation data set. Systematic invalid variance is variance in the self-reported data associated with other measured variables that is not observed in the validation data. Random error is variance in the self-reported data that is not observed in the validation data and not predictable using other measured variables. Correlation analysis describes the validity of self-reported behaviors as descriptors of actual behavior. Self-reported behavior may be more valid for specific questions or subgroups of the target population – high GPA students or participatory students, for example – and the correlations will be compared across groups of students. Identification of systematically invalid variance – specifically from social desirability bias – will be identified by estimating the incidence of over reporting socially desirable behaviors using the frequencies of errors, identifying the magnitude of bias, and establishing a relationship between intentional misreporting and MCSDS score.
nonrespondents. A more detailed discussion of the methods follows in the methodology section.
Definition of Terms
Campus recreation facility (CRF). The CRF is a college or university managed facility that meets the physically active/sport-based leisure needs of students through an intentional curriculum managed by student affairs professionals. In this study, the CRF refers only to the Carmichael Recreation Complex at NCSU with the Department of Health/Exercise Studies managing academic coursework and University Recreation managing co-curricular programming. The CRF hosts independent recreation activities, programmatic recreation activities, club sports for 44 team and individual sports, group fitness courses, intramural sports for 26 teams and individual sports, and for-credit
Heath/Exercise Studies courses. The CRF includes over 350,000 square feet of indoor and outdoor space with 6 fitness centers, 11 multi-purpose sport courts, a 25 yard and 50-meter Olympic-sized pool, 6 fitness studios, indoor climbing wall, racquetball courts, outdoor fields, outdoor basketball and tennis courts.
entry and class schedules. For informal recreation, the purpose of the CRF visit is not known.
Health/Exercise studies (HES) course. HES are for-credit courses offered by the Department of Health Science. Prior to 2014, the courses were labeled Physical Education (PE) and the department was called the Department of Physical Education. Almost all courses are based in the CRF with exceptions including Introduction to Bowling (Western Lanes in Raleigh) and Introduction to Downhill Skiing (Appalachian Ski Trail near Boone, NC). Most face-to-face courses meet entirely inside the CRF, but some – tennis for example – build skills for outdoor activities and often meet adjacent to, but not inside the CRF.
Distance education courses track course progress remotely and do not require regular class meetings in the CRF. Students are advised to wear athletic attire to HES class meetings, and prior to class, many students enter the CRF to change clothes in the facility’s locker room. Fitness courses (HESF) are 100 level courses that build a fitness baseline and teach wellness. Skill courses are HES 200 and 300 level courses that teach a specific skill.
Physical education requirement: All Bachelors level graduates of NCSU are required to pass one HESF fitness course and one HES skill course. There is no suggested time line for course completion. Students with registered disabilities must complete the Physical Education requirement but can enroll in special sections with accommodations.
attendance. In fall 2015, these programs included Aquatics, Challenge Course, Club Sports, Fitness, Intramural Sports, and Outdoor Adventures.
Limitations of Study
This single institution study tests the validity of a narrow segment of self-reported student behaviors. The institution-reported validation data describes academic participation through HESF course skipping, but the requirements of HESF courses are unlike those of academic courses in other disciplines. The institution-reported validation describes social participation using CRF entries and CRF-based co-curricular activities that require more physical activity than most other co-curricular programs on campus. As such, this study will forward the field, but the methodology and data limit the generalizability to other academic disciplines or co-curricular behaviors commonly reported in national surveys. The saliency of using HESF courses as a substitute for other academic subjects is debatable, but HESF courses remain the best available to measure class attendance across large groups at this institution. Further study may use computer login data for courses meeting in computer labs, academic building entry swipes for class meetings in other disciplines, electronic appointments at student services like tutoring, or wireless device connections to networks.
Finally, student data provided by the institution is presumed accurate but may describe instances of non-students borrowing student identification cards to enter the CRF at rates that are unknown.
Chapter Summary
Chapter 1 provided the purpose of the study, definitions to commonly used term, research questions, and research methods and briefly explored the existing literature,
theoretical context, and limitations to potential findings. Chapter 2 is a detailed exploration of the existing literature on Tourneau’s (1984, 1987) Model of Response Process, survey
CHAPTER 2: LITERATURE REVIEW
Chapter 2 reviews the literature relevant to the proposed validation study. First, I review the Model of Response Process by Tourangeau (1984, 1987) by exploring the four stage theoretical framework which processes how a survey respondent formulates and reports their past behaviors. Next, I review past validity studies that explore the accuracy of self-reported behaviors related to higher education and physical activity levels. I then explore the concept of social desirability bias and identify past validation studies that suggest that
exercise frequency, grade estimation, and class skipping are susceptible to social desirability bias. Finally, I review nonresponse bias and studies that compare behaviors of respondents and nonrespondents. This literature review discusses how researchers assess the validity of self-reported behavioral data. For the purpose of this study, survey validity is defined as evaluating the information reported by respondents as a representation of actual behavior across the target population.
Theoretical Construct
many time points, including prior 7 days, since the end of prior semester (3 months), since the beginning of the academic year (7 months), and further into the past. CRF use is further broken down into topic areas. Some topics, like informal recreation, are commonplace and club sports seasons are more noteworthy. Some other areas may be considered demanding (and often unpleasant) like NCSU’s required two course HES sequence that includes an infamously intense fitness class. All these topics are commonly included in surveys about higher education, so my survey instrument’s questions are modeled on questions found in
commonly cited publications on student behavior. What follows is a review of relevant literature.
compliant with societal norms that define socially accepted behavior. Each stage possesses threats to self-reported behavior validity that subsequently threaten the validity of findings bias on self-reported data. This study focuses on the retrieval, judgment, and social desirability-based reporting portions.
Tourangeau et al.’s (1984, 1987) model is a widely accepted tool for understanding
Table 2.1.
The Model of Response Process
Component Specific Process
Comprehension Attend to questions and instructions
Represent logical form of question
Identify question focus (information sought) Link key terms to relevant concepts
Retrieval Generate retrieval strategy and cues
Retrieve specific, generic memories Fill in missing details
Judgment Assess completeness and relevance of memories
Draw inferences based on accessibility Integrate material retrieved
Make estimate based on partial retrieval
Response Map judgment onto response category
Edit response
Comprehension
“Comprehension encompasses such processes as attending to the question and
accompanying instructions, assigning a meaning to the surface form of the question, and inferring the question’s point – that is, identifying the information sought” (Tourangeau et
basketball tournaments, Outdoor Adventure backpacking trips through the Andes Mountains, club sports travelling to out-of-state triathlons, etc. – describe complex behaviors and
demand too much specificity for Likert response options intended for broad audiences. These are relevant examples of common comprehension issues like vague question wording and/or use of terms without a common definition.
The first threat to validity from the comprehension stage of response stem from vaguely worded questions. Respondents cannot validly describe their behaviors if survey questions are understood in ways inconsistent with the researcher’s intent. Campus recreation
surveys also attempt to assess familiarity with preoperational activities, opinions about niche equipment, and baseline fitness to influence curricular design but are often surveying novices unfamiliar with the professional terms. Researchers and respondents have different
definitions of what a university owned facility is or how the concept of being physically fit is conflated with participating in campus recreation activities. For example, students and researchers may not mutually understand what the CRF facility describes in the case of a large, on campus field commonly used for Ultimate Frisbee games in no way affiliated with campus recreation. Similarly, respondents may believe researchers care about measuring physical activity and fail to report a CRF visit for static activities like drinks at the CRF cafe or checking out recreational equipment despite the researcher’s desire to capture all CRF-based interactions.
The second threat to validity stems from terminologies that all parties do not
specialized terms often leads to invalid responses. This is particularly problematic for novices who attend CRF instructional programs specifically to gain such operational knowledge but who have not yet done so. Using technical terms to describe techniques or equipment leads to invalid responses. Many institutions have significant international populations where recreation terms may have different meanings. For example, football describes an entirely different activity in the United States than in other nations. Even for those completing the survey in their native language, some campus recreation terms may be confusing. For example, disc golf is a relatively unknown, emerging sport that conjures images of pitching wedges among the unfamiliar.
Retrieval
“The retrieval component involves recalling relevant information from long-term
memory. This component encompasses such processes as adopting a retrieval strategy, generating specific retrieval cues to trigger recall, recollecting individual memories, and filling in partial memories through inference” (Tourangeau, et al., 2000, p. 9). The
traditional residential higher education process is complex and spans many years. The volume of higher education memories is immense. Because few students accurately recall events from the past, survey researchers invite validity threats when they ask students to recall daily events from years ago. This issue is compounded because cyclical academic schedules invite students to misreport events from one academic year as occurring in a different year.
early experiences formed later habits. Imagine a fourth year student passionate about
basketball; this person played basketball on teams in high school, intramural tournaments, on campus leagues, off campus leagues, informal pickup games (on and off campus), for-credit classes, formal instructional camps, and even attended intercollegiate games as a spectator. This student may accurately report significant events like an injury or a league championship game and may accurately describe themselves as an above average CRF user. But requesting them to accurately self-report common basketball occurrences like weekly participation rates from their freshman year or when they developed specific skills is unrealistic. This student is unlikely to differentiate from past games played inside the CRF versus outdoor courts or what percentages of games were played with friends they first met at the CRF versus preexisting friends. It is more unlikely that this student could recall past events that caused an interest in high levels of engagement with CRFs formal basketball programs (a common question for program evaluators). Commonly used surveys that ask such questions are inviting validity issues. Adding to the issues, national surveys do not ask campus recreation questions, so these researchers create customized questions relevant to their studies but without the extensive validation process.
Judgment [For Factual Questions]
“Retrieval often does not yield an explicit answer to survey questions” so the “judgment component comprises the processes that respondents use to combine or
supplement what they have retrieved [from memory]” (Tourangeau, et al., 2000, p. 10). The
of conclusions on aggregate behaviors. The cognitive load of questions varies and, for simple questions, most respondents can answer accurately by relying on their memories. For more complicated questions – how often they visit the CRF, for example – respondents must use their personal judgment to estimate the behaviors requested.
Respondents rely on several estimation strategies to impute missing information (Groves et al., 2009). First, respondents recall past experiences from memory and then total up occurrences of the behavior, sometimes with an upward adjustment for memories
assumed to be overlooked. The second strategy is rate-based estimation where the
respondent estimates the rate of occurrences over a finite time and then extrapolates the rate of incidence over the reference period. For example, a respondent reports their total CRF visits in a semester by estimating that they visit the CRF thrice per week and then
multiplying the rate by the number of weeks in a semester. The final strategy is impression based estimation where respondents use a vague impression of their incidence of a behavior and then match it to permissible survey responses. Most respondents integrate the product of all retrieved memories and estimation strategies to formulate their descriptions of past
behaviors. Prior research suggests high ability students (as measured by GPA and
standardized test scores) recall past behaviors with more accuracy (Dobbins, Farh, & Werbel, 1993; Kuncel et al., 2005; Porter & Umbach, 2006).
their career. The recall and count strategy for commonly occurring behaviors requires substantial cognitive ability (Tourangeau et al, 2000) so, with few exceptions, the students sampled will rely on estimation strategies. Prior research on CRF use focuses on the high volume users or the impact of use on long term outcomes; such requests increase the cognitive load of recalling and emphasize the importance of estimation strategies (Hall, 2006; Lindsey & Sessoms, 2006; Rothwell & Theodore, 2006; Todd, Czyszcson, Wallace Carr, & Pratt, 2009;). A student may meet friends to play basketball every Tuesday and Thursday and use a rate based estimation strategy that multiplies twice per week by the number of weeks in a semester. This strategy over estimates use when the respondent fails to consider missed meetings for holidays, illness, inclimate weather, final exams, or other unusual events. Another estimation strategy is to associate the amount of time they play basketball with a particular life circumstance. For example, on campus residents visit the CRF at higher rates than commuter students; since most students moved from campus housing to commute as upperclassmen, their impression based estimation strategy may be biased by their current life circumstance.
Reporting and Response Selection
Reporting and response selection “involves selecting and reporting an
answer…mapping the answer onto the appropriate scale or response option and ‘editing’ the response for consistency, acceptability, or other criteria…it may not be clear to them how to report it” (Tourangeau, et al., 2000, p. 13). For discussions within this study, the literature establishes validity concerns stemming both from respondents’ interpretations of reporting
self-reporting an honest response (Groves et al, 2009). Most standardized and national surveys research their question validity and provide clearly understood response options. Meanwhile, localized surveys focusing on specific behaviors tend to be less refined and have an increased likelihood of confusing respondents or offering contradictory response options (Porter et al., 2011). Most CRF surveys, which tend to be locally created, ask students to report their answers in a multiple choice format that offer responses on a scale or as discreet categories. It is not trivial to assume that survey response options provide researchers the data they intend to collect.
Prior Research
ability, but mathematical ability is too narrow a measure to predict overall college success (Gonyea, 2005). Modern higher education study requires descriptive specificity from factual student data that limit sources to self-reported behaviors obtained directly from students (Astin, 1993; Tourangeau et al., 2000). The growing popularity of survey research stems from the utility of self-reported data as a source for describing formative and summative outcomes (Ewell and Jones, 1993). Researcher reliance on self-reported data using college student surveys is increasingly important (Porter, 2011), which makes the validity of self-reported student behaviors a compelling research topic.
researchers’ ability to implement more surveys with little emphasis on validity issues
(Umbach, 2005). This study forwards the field by creating a customized survey instrument that describes behaviors known via institution-reported data sets, including CRF use, class skipping, and co-curricular participation. Compared to prior validation studies, these
behaviors are more similar to those collected by researchers using national and local surveys. Survey Life Cycle
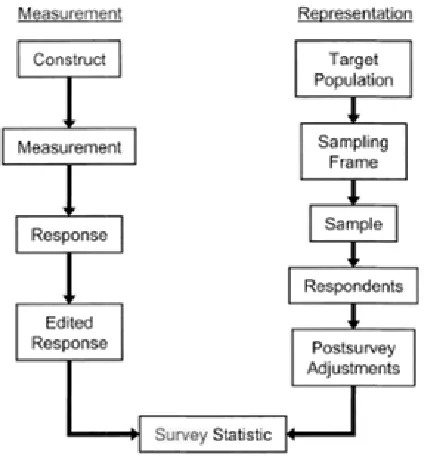
The survey life cycle (Groves et al., 2009) is a useful frame to enable discussion about the phases of survey implantation and how error can affect the survey statistic in each phase. The survey life cycle is divided into the measurement process and the sampling process. The survey life cycle organizes the survey statistic creation with discreet opportunities for error.
Measurement Process of the Survey Life Cycle
The measurement process describes the evolution from the construct the survey
researcher wishes to measure to the values derived from the actual responses provided. For example, a researcher may set out to measure the demand for more open swim time in the CRF pool with the intent of conducting a needs assessment for the university aquatic facilities. The researcher develops measures for open swim demand by constructing questions about satisfaction with the current pool policies and how they would use the pool without scheduling constraints. The responses are information provided by those completing the survey instrument. The survey researcher compiles the responses and edits some
responses by removing outliers or inappropriate answers that are clearly not representative of typical users. The edited responses are the primary input for the survey statistic.
At each phase of the measurement process there exist opportunities to introduce error. Error in the measurement process is defined as deviations in the answers provided by respondents from the construct the survey researcher intended to measure.
Measurement Error. Measurement error occurs when survey question answers do not collect responses that accurately respond to the construct intended. Measurement error is commonly caused by poor question wording which results in survey researchers and
respondents lacking a common understanding of the data collected. Irrelevant questions lead respondents to confuse the survey’s intent and should be avoided. Survey questions should
Processing Error. Processing error occurs after collection and during the data cleaning and coding. For closed ended questions, process error is often introduced by inaccurate scales or inaccurate data entry. For open-ended questions, process error is introduced through improper coding or failure to accurately clean outlier responses. In the pool use example, an open-ended question about past use could be intended to collect the numeric representation of annual pool visits, but respondents could enter open text to describe their pool use. The survey researcher may improperly convert the text into an actionable numeric value.
Representation Process of the Survey Life Cycle
The representation process of the survey life cycle describes how a subset of an overall population can be representative of an entire population without surveying all members of the population. The target population includes all members of a population which the survey statistic is intended to describe. In the pool demand example, the target population includes all the institution’s enrolled students eligible to use the CRF. The sample frame includes all
warrants more influence than nonusers. Respondents are members of the sample who completed the survey. Researchers may make post-survey adjustments by weighting known values or imputing missing values to assure that members of the target population are adequately represented. The adjusted sample is the second input to the survey statistic.
Coverage Error. Coverage error occurs when members of the target population are not included in the sample frame, usually because the contact information is not correct. Survey researchers should be particularly concerned when the lack of contact information is correlated with other attributes in the target population. Among higher education survey research, coverage error is a concern when the institution contact information (usually email addresses) is not used by the student.
Sample Error. Sampling error occurs when the opinions or behaviors of the selected sample do not match that of the sample frame. Sample error exists in all cases where the sample frame and sample are not identical. Larger samples and strategic sample creation (i.e. stratified random sampling) reduce magnitude of sample error. Sampling error can be
reduced though the use of confidence intervals.
Nonresponse Error. Nonresponse describes a correlation between the likelihood of responding to a survey and systematic differences in the characteristics of responders and nonresponders. In our pool use example, frequent pool users may be more likely to respond to a pool use survey because they are invested in the pool hours and policies. Meanwhile, students who do not visit the pool fail to respond to the survey because they are less
abstention from specific questions (item nonresponse). Nonresponse error is more likely in cases where the respondent characteristics are dissimilar to the target population.
Adjustment Error. Survey researchers may weight or edit the responses provided to compensate for detected sources of coverage, sampling, or nonresponse error. These
adjustments are meant to improve the validity of the sample mean as a representation of the target population. These adjustments may decrease the validity and introduce new biases, especially in cases where missing data is not identified and properly imputed or excluded from the analysis.
Response Bias and Measurement Error in Measurement Process
Factual, self-reported data is data the researcher obtains directly from the participant rather than from another source that describes objective behavior and characteristics
(Tourangeau et al., 2000). These self-reports are compiled into summary statistics used by quantitative researchers. Quantitative researchers use the variance across all the responses to a question, which means that validity studies evaluate the survey statistic as a valid descriptor of actual behavior rather than focus on an individual’s response. For self-reported, factual
data, the variance within the survey statistics is categorized as (1) valid variance associated with actual differences among respondent behavior; (2) systematic invalid variance explained by respondent, survey, or process factors but not descriptive of actual behaviors; and (3) random error that does not describe actual behavior and is not correlated with any other factor (Kuncel et al., 2005). Researchers who make research conclusions without verifying survey data validity rely on the assumption that variance from self-reported data is
Random error is ever present in most quantitative data measurements but is not correlated with any other measured variables. People are inaccurate self-reporters and introduce random error when making various judgments about themselves (Bowman, 2010). Unlike systematically invalid variance, random error reduces the power of self-reported data but presents a far lesser threat to research findings because randomly over reported rates are usually offset by randomly underreported rates within the survey statistic (Groves et al., 2009). Errors in self-reported data increase with the complexity of the data requested (Gonyea, 2005). Random error is ever-present because respondents inaccurately recall past behavior, but it is mitigated through simple recall requests and well-designed survey
questions (Cole & Gonyea, 2010; Gonyea, 2005).
Systematically invalid variance has many causes stemming from the survey process and the respondents. Examples of systematically invalid variance caused by the respondent include an inability of respondents to accurately report due to impaired ability to recall events (Kuncel et al., 2005); a Halo Effect error in which specific factor responses are correlated with both the overall experience and factor requested (Bowman, 2014); or intentional