ABSTRACT
QIAN, HONG. Activators Generated by Electron Transfer for Atom Transfer Radical Polymerization (AGET ATRP) in Polymerization-based DNA Sensing. (Under Direction of Dr. Lin He.)
DNA detection has drawn significant interest for its wide application in gene analysis, DNA diagnostics and biological warfare detection. Numerous techniques have been developed for DNA detection, including optical, electrochemical, and gravimetrical methods. Choice of detection methods is made based on the specific requirements for sensitivity, affordability and availability. Despite of great successes in DNA sensor development, matured technologies for routine DNA detection at bedside or in the field are lacking. A simple, easy-to-operate, and sensitive detection platform in a strip test format is in great need, especially for developing country where resources are limited.
Polymerization-based DNA detection has been developed as a sensitive and cost-effective detection platform, which allows direct visualization of as few as 2000 DNA copies. It utilizes the growth of polymer brushes on a surface to report occurrence of DNA binding events. This dissertation reports our continuous efforts in optimizing assay performance and exploring its applications. In particular, a purge-free polymerization-based DNA detection method was developed based on Activators Generated by Electron Transfer for Atom Transfer Radical polymerization reaction (AGET ATRP), which simplifies the detection procedure, shortens the assay time, and significantly improves the assay robustness.
Chapter 2 describes the development of DNA detection with AGET ATRP on a Au surface. Ascorbic acid (AA) was used to remove oxygen and activate Cu2+ catalyst for polymer grafting to be carried out without purging. Selection of catalyst ligands and concentration optimization of catalyst and reducing agent was performed. Detection specificity was demonstrated by discriminating sequences with single point mutations.
Chapter 3 describes the efforts in copolymerization of colorimetric monomers in AGET ATRP with the aim of enhancing direct visualization in DNA detection. Two colorimetric monomers, 1,4-Bis(4-(2-methacryloxyethyl) phenylamino) anthraquinone (blue) and 4-(2-thiazolylazo)phenyl methacrylate (yellow), were synthesized, and copolymerization of two monomers with HEMA was demonstrated. Blue-colored monomer was used as the model to study incorporation efficiency and conversion rate in detail.
Chapter 4 describes grafting of ionic polymers on Au surface in AGET ATRP to provide an alternative to incorporate colors into polymers by electrostatic interaction. A negatively charged monomer, 3-sulfopropyl methacrylate (SPM), and a positively charge monomer, 2-(methacryloyloxy)ethyl-trimethylammoniumchloride (MeDMA) were employed. More effective polymer grafting, i.e. shorter assay time, has been realized in SPM polymerization.
Chapter 6 describes exploration of fluorophore-carrying PLL in fluorescent DNA detection. A macrofluorophore was prepared by modification of the amino groups of polylysine with fluorophores. DNA-labeling-free detection is achieved by taking advantage of electrostatic interaction between DNA and PLL macrofluorophores. High sensitivity offered by fluorescence detectionenabled DNA detection sensitivity further decreased for another 4 orders of magnitudes. Application of PLL macrofluorophore in multiplexing detection of proteins was also demonstrated.
Activators Generated by Electron Transfer for Atom Transfer Radical Polymerization in Polymerization-based DNA Sensing
by Hong Qian
A dissertation submitted to the Graduate Faculty of North Carolina State University
in partial fulfillment of the requirements for the degree of
Doctor of Philosophy
Chemistry
Raleigh, North Carolina 2011
APPROVED BY:
Lin He Edmond F. Bowden Committee Chair
Bruce M. Novak Morteza G. Khaledi
BIOGRAPHY
Previous Educational Experiences:
Graduate: University of North Carolina at Greensboro, M. S. Physical chemistry, Graduated 2006 Undergraduate: Ocean University of China,
ACKNOWLEDGEMENTS
I would like to express my deepest and most sincere gratitude to my supervisor, Professor Lin He. Without her guidance and fanatical support, this research would have not been done. Her wide knowledge, more importantly her logical scientific thinking is essential for any accomplishment, if any, achieved during my PhD study. Her encouraging and understanding is so important for me, especially in those difficult moments.
I wish to deeply thank my committee members, Dr. Edmond F. Bowden, Dr.Bruce Novak, and Dr. Morteza Khaledi, for their valuable suggestions and comments on my research.
I owe my most sincere gratitude to Dr. Simon Lappi for training me in the use of fluorescence microscope and ATR-IR, and his help in laser imaging experiment. His knowledge in physical chemistry has been great value for this research.
Also Thanks the former group members in the He group, especially Dr. Weiming Zheng, Thomas K. Chen, Dr. Peng He, Dr. Xinhui Lou, Dr. Qiang Liu, Yongsheng Xiao, Yafeng Wu, and Abhilasha P. Shah. Discussions with group members and interesting explorations have been very helpful for this study.
I would like to thank Dr. Wenjun Niu, former postdoc fellow in Dr. Gorman’s group,
who helped me greatly in the synthesis of monomers and in the use of TGC and FT-IR instrument. Graduate students, especially Lebo Xu, Eric Tucker, Jennifer Ayres, and Bill Behof in Dr. Gorman’s group for their kind support. Samuel I. Jenkins, graduate student in
I also thank the supporting staff in chemistry department for providing assistance with regard to administrative matters. They are Ms. Michelle Clark, Ms. Brenda Burgess, and Ms. Maria D. Merono.
I owe my loving thanks to my husband Shengyong Hu, my son Bolin Hu and my parents. Without their emotion support, I would not have been able to complete the Ph. D. program. Together, they make me own a happy family in the world!
The financial support of the University of North Carolina State University is gratefully acknowledged.
TABLE OF CONTENTS
LIST OF TABLES………..xi
LIST OF FIGURES………...xii
Chapter 1 Introduction ...1
1.1 Conventional Detection Methods Used in DNA Sensor... 3
1.1.1 Optical DNA Detection... 3
1.1.2 Electrochemical DNA Detection ... 6
1.1.3. Gravimetric DNA Biosensors ... 8
1.1.4 Conclusion ... 9
1.2 Lateral Flow DNA Strip Test ... 9
1.3 Polymerization-based DNA Sensor ... 13
1.4 DNA Detection via Activators Generated by Electron Transfer Using Atom Transfer Radical Polymerization Technique ... 16
REFERENCES ... 22
Chapter 2 DNA Detection with AGET ATRP ... 28
2.1 Introduction ... 28
2.2 Experimental Section ... 28
2.2.1 Material ... 28
2.2.2 AGET ATRP Polymerizations. ... 29
2.2.3 Immobilization of Initiator-coupled ssDNA on Au surface. ... 31
2.2.4 PNA Immobilization and DNA Hybridization on Au Surface. ... 32
2.3 Result and Discussion ... 33
2.3.1 Solution Polymerization of HEMA with AGET ATRP ... 33
2.3.4 Conclusion ... 52
REFERENCES ... 53
Chapter 3 Synthesis of Colorimetric Copolymer with AGET ATRP ... 54
3.1 Introduction ... 54
3.2 Experimental Section ... 55
3.2.1 Materials ... 55
3.2.2 Synthesis of 1,4-Bis(4-(2-methacryloxyethyl) phenylamino) anthraquinone (BMPA, monomer 1). ... 55
3.2.3 Synthesis of 4-(2-thiazolylazo)phenyl methacrylate (TAPMA, Monomer 2) .. 58
3.2.4 Synthesis of Blue Copolymer with AGET ATRP ... 60
3.2.5 Surface Copolymerization of Colorimetric Monomer with HEMA ... 61
3.2.6 Instrumentation and Analyses. ... 62
3.3 Result and Discussion ... 62
3.3.1 Synthesis and Characterization of Blue Copolymer of HEMA and Monomer 1... 62
3.3.2 Synthesis of Yellow Copolymer with HEMA and Monomer 2 (TAPMA) ... 72
3.3.3 Surface-initiated Copolymerization on ssDNA coated Au substrate. ... 74
3.4 Conclusion ... 77
REFERENCES ... 79
Chapter 4 Synthesis of Ionic Polymer with AGET ATRP ... 80
4.2 Experimental Section ... 81
4.2.1 Materials ... 81
4.2.2 Immobilization of Initiator-Coupled Small Molecules and Initiator-Coupled ssDNA on Gold. ... 81
4.2.3 Surface-Initiated AGET ATRP Polymerization with Different Monomers ... 82
4.2.4 Instrumentation ... 82
4.3 Result and Discussion ... 83
4.3.1 Surface-initiated Positively Charged pMeDMA ... 83
4.3.2 Surface-initiated Negatively Charged pSPM ... 90
4.4 Conclusion ... 97
REFERENCES ... 99
Chapter 5 Polymeric Macroinitiators for Signal Amplification in AGET ATRP-based DNA Detection ... 101
5.1 Introduction ... 101
5.2 Experimental Section ... 103
5.2.1 Material. ... 103
5.2.2 Modification of PLL with ATRP Initiators. ... 104
5.2.3 Immobilization of DNA/PNA on Au surface. ... 105
5.2.4 DNA Hybridization and PLL Application. ... 106
5.2.5 Surface-initiated AGET ATRP Polymerization... 106
5.2.6 Instrumentation. ... 107
5.3 Result and Discussion ... 107
5.3.2 Polymer Growth on DNA Surface Using PLL Macroinitiator ... 108
5.3.3 Determination of PLL Modification Ratio with Fluorescamine Assay ... 110
5.3.4 Optimization of the PLL modification for polymer growth ... 113
5.3.5 Optimization of PLL Macroinitiator Concentration for Polymer Growth ... 117
5.3.6 DNA detection using PLL Macroinitiator for Improved Sensitivity ... 119
5.4 Conclusion ... 122
REFERENCES ... 123
Chapter 6 Sensitive DNA and Protein Detection with PLL Macrofluorophores... 125
6.1 Introduction ... 125
6.2 Experimental Section ... 127
6.2.1 Material ... 127
6.2.2 Modification of ssDNA and PLL with Flurophores. ... 128
6.2.3 Preparation of Silicon Slides. ... 129
6.2.4 DNA Hybridization and PLL Macrofluorophore Application... 129
6.2.5 Immobilization of Antibody on Nanorods. ... 130
6.2.6 The Sandwich Assay of Antigen Detection on Nanorods ... 130
6.2.7 Instrumentation. ... 131
6.3 Result and Discussion ... 131
6.3.1 Fluorescence from DNA/PLL Macrofluorophore Complex ... 131
6.3.2 DNA Detection with PLL Macrofluorophore ... 134
6.3.3 Protein detection Using PLL Macrofluorophore ... 141
6.3.4 Multiplex Protein Detection Using PLL Macrofluorophore ... 147
REFERENCES ... 152
Chapter 7 Polymerization-based Lateral Flow Strip Test ...154
7.1 Introduction ... 154
7.2 Experimental section ... 156
7.2.1 Materials ... 156
7.2.2 Surface-initiated AGET ATRP from Cellulose Membrane ... 156
7.2.3 Surface-initiated pHEMA from DNA Affixed Membrane. ... 157
7.2.4 Assembly of Membrane to Test Strip Format ... 157
7.2.5 pSPM Growth from DNA Affixed Membrane. ... 158
7.2.6 Instrumentation ... 158
7.3 Result and Discussion ... 159
7.3.1 Principle of Polymerization-based Strip Test ... 159
7.3.2 pHEMA Growth on Cellulose Membrane ... 160
7.3.3 pHEMA Growth from Initiator-coupled DNA Affixed on Nylon Membrane163 7.3.4 In situ Incorporation of Color to Membrane ... 166
7.3.5 pSPM(-) Growth from Initiator-coupled DNA Affixed on Nylon Membrane168 7.4 Future Study ... 172
7.5 Conclusion ... 173
REFERENCES ...174
LIST OF TABLES
Table 1.1 Comparison of conventional DNA sensors………...9
Table 2.1 DNA sequences used in this chapter………..29
Table 3.1 Determination of monomer 1 incorporation in copolymer………68
LIST OF FIGURES
Figure 1.1 Stratagies used for DNA labeling in DNA sensing: (a) direct labeling target DNA; (b) sandwich-type system: a sandwich is formed among immobilized capture DNA probe, target, and signaling DNA (ref 1)………..2
Figure 1.2 DNA detection using fluorophore encapsulated particles as labels (ref 15)…..….4
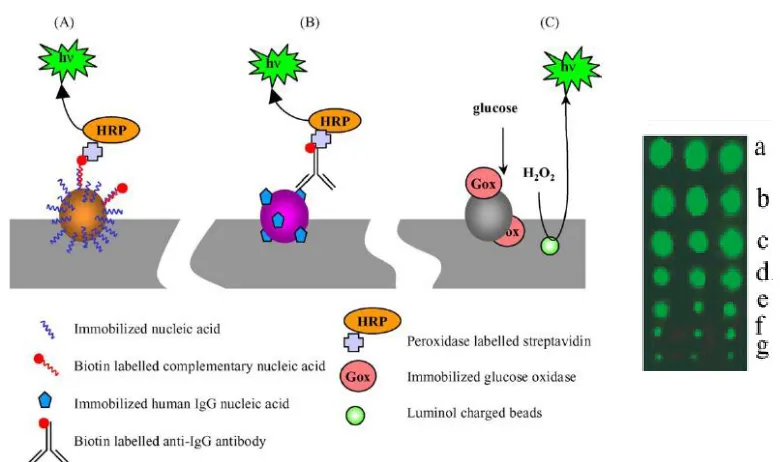
Figure 1.3 Chemiluminescent Detection of DNA, protein and glucose with beads labeled with specific capture probe in PVC master (Ref 25)………..6
Figure 1.4 The amplified electrochemical detection of DNA hybridization via oxidation of the ferrocene caps on the gold nanoparticle/streptavidin conjugates (Ref 40)………...8
Figure 1.5 Schematic fabrication of the LF strip. The LF strip is clamped by the upper cover plate and the bottom plate. The position of sampling hole was just on top of the sample pad and conjugate. In addition, the position of watch window was also just on top of the absorbent pad. Sample is applied to sampling hole. The T line and C line were in the center of the scanning window, and the watch window could indicate whether the LF assay finished or not (Ref 53)………....10
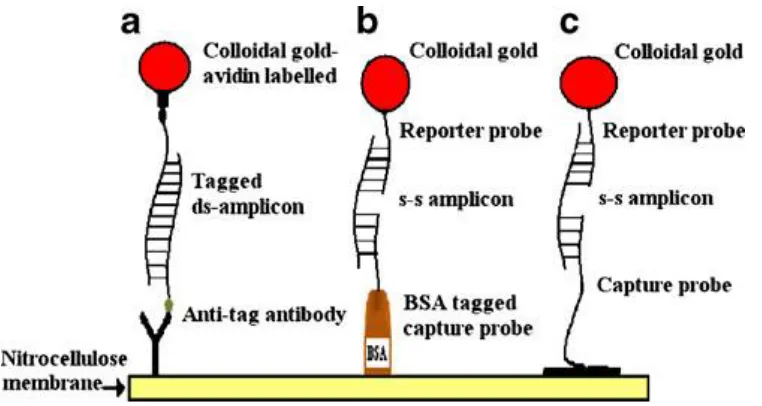
Figure 1.6 Three detection principles in nucleic acid lateral flow test strip method; (a) immunoassay lateral flow; (b) using bovine serum albumin-oligonucleotide conjugate capture probe (c) using oligonucleotide capture probe immobilized on the nitrocellulose membrane via passive adsorption (Ref 65)………..12
Figure 1.7 Images (top) and recorded response signals (bottom) of lateral flow strip with different concentration of target DNA. (a): 0 nM target DNA; (b): 1000 nM noncomplementary DNA; (c): 100 nM target DNA; (d) 1000 nM noncomplementary target DNA+100 nM complementary target DNA (Ref 61)………..13
Figure 1.8 Mechanism of RAFT polymerization on DNA covered surface. The image (right side) illustrates the polymer growth from 1fM target DNA concentration applied on Au surface (Ref 69)………..……15
Figure 1.9 The scheme illustration of DNA sensing with photo polymerization. The image shows polymer growth after 5 min photo irradiation (Ref 70)……….16
Figure 1.10 Proposed mechanism of ATRP. The image shows polymer growth on the DNA spot where initiator is labeled. (Ref 68)……….16
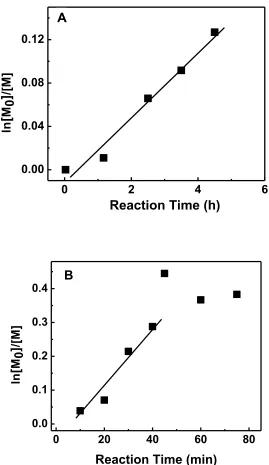
Figure 2.1 Kinetic plots for AGET ATPR of pHEMA in solution with different initiator
HEMA/CuBr2/Me4Cyclam/dnNbpy/Initiator/AA = 1375/1/0.67/0.67/0.063/1.5, HEMA = 16.5 mmol, in DMF; (B) The reaction volume is scale to 1/3 compare to (A). HEMA/CuBr2/Me4Cyclam/dnNbpy/Initiator/Ascorbic Acid =1375/1/0.67/0.67/1/1.5, HEMA = 5.5 mmol, in DMF. The reaction volume was 1.33 mL in a 2 mL reaction vial………...37
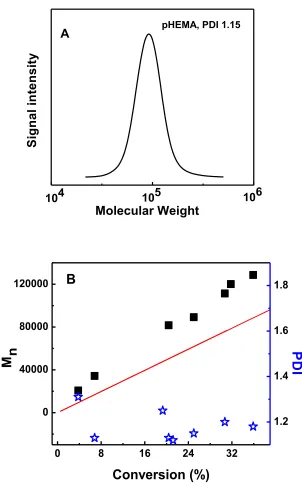
Figure 2.2 (A) GPC trace of pHEMA after 40 min polymerization. (B) pHEMA molecular weight and polydispersity as a function of conversion. ■, experimental Mn of pHEMA; , PDI of pHEMA. The straight line is the theoretical molecular
weight. Experimental condition:
HEMA/CuBr2/Me4Cyclam/dnNbpy/Initiator/AA = 1375/1/0.67/0.67/1/1.5, HEMA = 5.5 mmol, in DMF. The reaction volume was 1.33 mL in a 2 mL reaction vial. Theoretical Mn = [M]*conversion/[I]* MW of monomer………...38
Figure 2.3 Selection of ligand. Experimental conditions: for bpy-based reactions,
[CuBr2] = 30 mM, CuBr2/bpy = 1:2, reaction time = 5 h; for Me4Cyclam/dnNbpy, [CuBr2] = 3 mM, CuBr2/Me4Cyclam/dnNbpy =1:0.67:0.67, reaction time = 1.5 h; and for TPMA, [CuCl2]= 19 mM, CuCl2/TPMA = 1:1, reaction time = 2 h. Cu(II)/AA = 1:1, [HEMA] = 4.1 M, HEMA/H2O = 1:1 (v/v). DNA molecules without initiators were used as control………..41
Figure 2.4 Optimization of AA amount. Experimental conditions: (A) [CuCl2] = 19 mM, reaction time = 2 h; (B) [CuCl2] = 0.6 mM, reaction time = 85 min. CuCl2/TPMA = 1:1, [HEMA] = 4.1 M, HEMA/H2O = 1:1 (v/v)…………..…..43
Figure 2.5 Kinetic plot of pHEMA on ssDNA coated Au substrate. Experimental condition: HEMA/CuCl2/TPMA/AA = 219/1/1/0.6, [HEMA] = 4.1 M, HEMA/H2O 1:1(v:v)………...…….45
Figure 2.6 Thickness of pHEMA on ssDNA-coated Au surfaces as a function of DNA density. Experimental condition: HEMA/CuCl2/TPMA/AA = 219/1/1/0.6, [HEMA] ) 4.1 M, HEMA/H2O ) 1:1(v:v)………...48
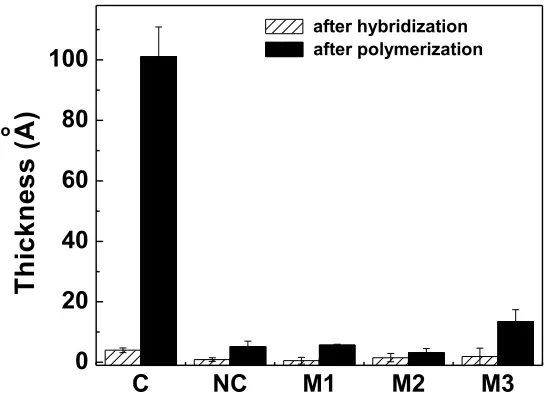
Figure 2.7 Quantitative detection of target DNA in solution. The control thickness was 5.3 A but was not plotted on the log axis……….49
Figure 3.1 1H NMR spectrum of intermediate of 1,4-Bis(4-(2-methacryloxyethyl) phenylamino) anthraquinone (monomer 1)………...57
Figure 3.2 1H NMR spectrum of 1,4-Bis(4-(2-methacryloxyethyl) phenylamino) anthraquinone (monomer 1)………...58
Figure 3.31H NMR spectrum of 4-(2-thiazolylazo) phenyl methacrylate (monomer 2). ………60
Figure 3.4 UV-vis spectrum of monomer 1 in DMSO. Spectrum was obtained at 0.025 mg/ml concentration………..63
Figure 3.5 A representative 1H NMR spectrum of copolymer after dialysis in d6-DMSO. Experimental condition: CuBr2/Me4Cyclam/dnNbpy/Initiator =1/0.67/0.67/1, 1.34 mg CuBr2 (~4mM), HEMA/DMF=1/7 (v/v), 16 mg of monomer 1, total reaction volume =1.6 mL……….65
Figure 3.6 The UV-vis spectra of monomer 1 in DMSO ( ), 10% HEMA (---), 50% HEMA (···), and pure HEMA (·–·–·) were compared. The result showed there was no difference in the absorbance of monomer 1 in DMSO, 10% HEMA and 50% HEMA………66
Figure 3.7 Kinetic plot for AGET ATPR of pure pHEMA (■) and colorimetric copolymer (▲) with different initiator concentration. The feeding ratio of monomer 1 to HEMA is 0.6% by weight (0.1% by molar). Experimental conditions: (A) HEMA = 5.5 mmol, in DMF, HEMA/CuBr2/Me4Cyclam/dnNbpy/Initiator/AA = 1375/1/0.67/0.67/0.063/1.5; (B) The reaction volume is scale to 1/3, compare to (A). HEMA/CuBr2/Me4Cyclam/dnNbpy/Initiator/AA=1375/1/0.67/0.67/1/1.5, HEMA = 5.5 mmol, in DMF. The reaction volume was 1.33 mL in a 2 mL reaction vial………...69
Figure 3.8 (A) GPC trace of copolymer with 0.6% feeding ratio after 40 min polymerization. (B) Copolymer molecular weight and polydispersity as a function of conversion. ▲, experimental Mn of copolymer; straight line represents theoretical Mn of
copolymer; , PDI of copolymer………71
Figure 3.10 A representative 1H NMR spectrum of copolymer in d6-DMSO. Experimental condition: [CuCl2] = 19 mM, CuCl2/TPMA/Initiator/AA = 1/1/0.1/1.5, [HEMA] = 4.1 M, HEMA/DMF = 1:1 (v/v), 5mg monomer 2. Reaction time = 15h………...74
Figure 3.11 Blue and yellow copolymer grown on ssDNA covered Au substrate. The feeding ratios of both colored monomer to HEMA are 3 wt%. The total reaction volume is 1.6 mL for both reactions. Experimental condition: for blue copolymer, HEMA/CuBr2/Me4Cyclam/dnNbpy/Ascorbic Acid = 1375/1/0.67/0.67/1.5, HEMA/DMF = 1:5 (v/v), reaction time = 17h; for yellow copolymer, HEMA/DMF = 1/2 (v/v), [CuCl2]= 19 mM, CuCl2/TPMA/Ascorbic Acid = 1/1/1, reaction time = 5 h. DNA molecules without initiators were used as control……….………..76
Figure 4.1 (A) The ATR-IR spectra of pMeDMA film atop of small molecules; (B) quantative comparison of ATR-IR signal at 1725 cm-1 at different film thickness………...85
Figure 4.2 The ATR-IR spectra of pMeDMA film atop of DNA molecules after background subtraction. The IR measurement was conducted with higher compress pressure than the one on small molecule surface……….86
Figure 4.3 pMeDMA film thickness as a function of Cu catalyst amount on (A) small molecule surface, and (B) DNA surface………..…..88
Figure 4.4 Evolution of pMeDMA film thickness as a function of reaction time (A) small molecule surface, and (B) DNA surface………....90
Figure 4.5 The ATR-IR spectra of pSPM film on (A) small molecule surface; (B) DNA surface. The control spectrum was subtracted………...92
Figure 4.6 pSPM film thickness as a function of Cu catalyst amount on small molecule surface. The inset is the zoom-in graph at Cu ammount below 0.5 mg……...…..94
Figure 4.7 pSPM film thickness as a function of Cu catalyst amount on DNA surface surface………94
Figure 5.1 Polymer growth on DNA. (A) Comparison of polymer film thicknesses from DNA/PLL-coated surface and single-initiator attached DNA-coated surface. (B) ATR-IR spectra of pHEMA films formed on the Au surface when (a) target DNA was direct labeled with initiators or (b) L-PLL macroinitiators were used as the detection probe. L-PLL was modified with ATRP initiator at 55%, [NH2]total = 48µM, other conditions see the text………..………...109
Figure 5.2 The standard curves used in the fluorescamine assay to determine [NH2]free after initiator modification………..111
Figure 5.3 Determination of initiator modification ratio of S-PLL ( , 27 repeat units) and L-PLL (□, 215 repeat units) as a function of feeding ratios in the fluorescamine assay. The straight line is a theoretic plot showing 100% coupling efficiency……….………..…….112
Figure 5.4 (A) The effect of the charge density on polymer growth for S-PLL ( ) and L-PLL (□). Polymerization conditions see the text. The background from nonspecific adsorption was subtracted before plotting. Total amine concentration was 48 µM. For L-PLL, the polymer film thickness is the average of two separate experiments. (B) Sizes of initiator-ladened L-PLL in NMP at different modification ratios measured using DLS….………..116
Figure 5.5 The effect of the PLL concentration on polymer growth for L-PLL. The PLL concentration was calculated as total repeat units (NH2 groups). The absolute polymer film thicknesses plotted against [NH2]total when the modification levels were at 30% (■/□), 55% (●/○), and 80% (▲/∆). R refers to thicknesses measured from the spot coated with ssDNA, whereas C refers to thicknesses measured from the control spot without DNA. The lines connected related data points are used to guide the human eye. Polymerization conditions see the text………...………118
Figure 5.6 (A) A plot of polymer film thicknesses as a function of target DNA concentration using L-PLL macroinitiators at the 55% modification level as the signal amplification probes. (B) A logarithmic plot of polymer thickness vs DNA concentrations that are below 0.1 µM. (C) A photographic picture shows the substrates incubated with different concentrations of target DNA followed by polymer growth. With thicker films formed on the surface, the spot developed a darker color that is visibly differentiable from the background………..121
Figure 6.2 DNA detection (A) using PLL macrofluorophores for signal amplification; (B) using individual fluorophore-labeled target DNA………136
Figure 6.3 The fluorescence images at target DNA concentration of 0, 100fM, and 10pM when using 100X objective. The scale bar is 10 µm………..…138
Figure 6.4 Transparent microscope image of (A) 80% and (B) 51% intiator substituted PLL. The scale bar is 10 µm………...139
Figure 6.5 Sizes of initiator-ladened L-PLL- in H2O at different modification ratios measured using DLS………140
Figure 6.6 Fluorescence images of PSA detection using PLL macrofluorophore. The PSA antigen concentration varies from 0 to 1000 ng/mL………..144
Figure 6.7 The quantitative plot of fluorescence signal intensity against the concentration of PSA………..…145
Figure 6.8 PSA detection using direct fluorophore-labeled detection antibody…………...145
Figure 6.9 CEA detection using PLL macrofluorophore………..…146
Figure 6.10 HCG detection using PLL macrofluorophore………...147
Figure 6.11 Corresponding fluorescence (a-d) and reflectance (a’-d’) images of the mixture of three antibody-bond nanorods incubated with no cancer marker protein (a, a’), PSA(b, b’), PSA and CEA (c, c’) and all three cancer marker proteins (d,d’). The concentration of each target protein was kept at 33 ng/mL final concentration. Three representative particles of differenct striping patterns were circled in each image to aid visualization of eye………..149
Figure 6.12 Quantitative detection of three cancer marker proteins. Cancer marker proteins present in serum sample were labeled in x-axis, and the corresponding fluorescence readout was in y-axis. The striping pattern is PSA (01010), CEA (111000), and hCG (100001)………..…..150
membrane. Both membranes go through same polymerization process. The left image is taken under room light; the right image was fluorescence image taken under UV light. Both showed positive difference in dye binding, i.e. the amount of polymers between the testing and control strips………..163
Figure 7.2 ATR-IR monitoring of surface chemical modification of pHEMA from DNA-affixed nylon membrane by AGET ATRP. The spectra were normalized with the peak at 1633 cm-1 from amide group on nylon membrane……….165
Figure 7.3 (A) Synthetic scheme of copolymerization of blue monomer with HEMA; (B)
ATR-IR monitoring of surface chemical modification of copolymer from DNA-affixed nylon membrane by AGET ATRP. The blue-C refers the control spot and the blue-R refers to the reaction spot where initiator-coupled DNA was immobilized; (C) The picture of membrane after copolymerization…………...167
Figure 7.4 ATR-IR monitoring of evolution of pSPM from DNA-affixed nylon membrane by AGET ATRP. The experimental conditions: SPM 0.57g, CuCl2 0.125mg, CuCl2/TPMA =1:1, the reaction volume = 1.6 mL in H2O, reaction time 45 min………...169
Figure 7.5 ATR-IR monitoring of evolution of pSPM after introduction of PLL macroinitiators to DNA-affixed nylon membrane by AGET ATRP. The experimental conditions were same as in Figure 7.4………...169
Chapter 1 Introduction
In recent years, DNA-based diagnostic tests have attracted growing interests. The motivation of developing DNA detection system lies on its applications in many fields, including DNA diagnostics, gene analysis, fast detection of biological warfare agents, and forensic applications. The capability of detection of genetic mutations at the molecular level before any onset of disease symptom renders it a potentially effective tool for early diagnostics and treatment, and effective disease prevention.
Most DNA detection systems are based on hybridization between target DNA molecules and their complementary oligonucleotide probes, which are present either in solution or on a solid support. The DNA base-pair recognition events are eventually converted to a readable signal by DNA sensor containing electrochemical, optical, and weight information. Two strategies are often used to introduce the detectable signals to DNA recognition events: 1) DNA target is directly labeled with an enzyme, an electroactive indicator, a fluorophore, or a nanoparticle, and hybridized with a probe pre- immobilized on sensor surface. Or 2) a sandwich-type ternary complex can be formed. The immobilized DNA probe hybridizes to a part of the target whereas the other part of the target is complementary to a signaling DNA sequence that serves to label the target upon hybridization (Figure 1.1).
because simple and inexpensive DNA detection offer exciting opportunities for bedside monitoring and home self testing. More importantly, the affordable detection is in great need for those laboratories in the developing countries.
In US, the point-of-need market is experiencing double-digit rapid growth since 2003. In 2008, the point-of-need market reached >$2,200 million. More than 10 world-famous companies and numerous small biotechnology companies are exploring their business in this market. The point-of-need products are widely used for virus, toxin, infectious and genomic detection. The cost of detection is significantly reduced due to the transferring professional diagnostic and patient care from central laboratories and hospital setting to field test.
Figure 1.1 Strategies used for DNA labeling in DNA sensing: (a) direct labeling target DNA; (b) sandwich-type system: a sandwich is formed among immobilized capture DNA probe, target, and signaling DNA (ref. 1).
models the anthrax lethal factor to test a technology that could displace polymerase chain reaction (PCR) and conventional fluorescence probes in clinical diagnostics and make point-of-need DNA testing possible in the doctor’s office and on the battlefield. A simple electrical signal indicates that target DNA has been detected, and hundreds of pathogenic agents could be monitored simultaneously.3 The dipstick test, also known as lateral flow test, is a another popular rapid diagnostic tool which shows promising advantage in portability and disposability. Dineva et al realized a sensitive, simple, and instrument independent DNA detection on the dipstick membrane, where the amplification of signal can be visualized by using colloidal gold.4 This new and sensitive method for nucleic acid detection would increase the availability of genomic screening in resource-limited settings and its applicability to near-patient testing.
In the following paragraphs I will briefly review various conventional DNA sensor platforms, and the background of polymerization-based DNA detection recently developed within the group, which laid down the ground work for my research on exploring the application of polymerization-based DNA detection in a dipstick sensing format for improved sensitivity and cost reduction.
1.1Conventional Detection Methods Used in DNA Sensor
Numerous techniques that have been developed for DNA detection include optical, electrochemical, and gravimetrical method. Choice of detection method is made based on the specific requirement of sensitivity, affordability and availability.
1.1.1 Optical DNA Detection
(SERS) spectroscopy, chemilluminescence, colorimetry or surface Plasmon resonance (SPR).
1.1.1.1 Fluorescence Detection
Among them, fluorescence detection is most widely used detection methods. DNA hybridization can be labeled with fluorescence moieties and the signal can be easily measured with an imaging fluorescence apparatus.2-9 Organic fluorescent dyes, more recently quantum dots, are largely used as labels in optical DNA sensor.10-12 Compared with conventional organic fluorophores, quantum dots are much brighter, and have broad absorption spectra and narrow emission spectra which permits excitation at wavelengths far from their emission peaks.13 The fact of nearly all quantum dots of different emission peaks can be excited using a single, short-wavelength excitation source, is a powerful tool for monitoring several components in complex biological systems.14 To increase the fluorescence intensity of organic labels, organic-dye-doped nanoparticles were recently synthesized. A large number of fluorophores was encapsulated inside a single nanoparticle, therefore when one probe DNA was labeled with one dye-doped nanoparticle, the signal was greatly amplified compared with single fluorophore (Figure 1.2). Through the use of this strategy, DNA could be detected at a concentration as low as 8×10-13M.15
Although fluorescence detection is favored due to its high sensitivity, the entire optical system including the laser diode, hotodiode, and filter is not very suited for miniaturization and appears very costly, which can only be afforded in well equipped lab, and the stability, quenching and selectivity concerns still remain.
1.1.1.2 Surface-enhanced Raman Detection
Surface-enhanced Raman scattering spectroscopy presents several advantages compared to fluorescence.16, 17 A Raman dye can be nonfluorescent, and a minor chemical modification of a Raman dye can lead to a completely new Raman dye even if the two are very similar in structure. In this technique, a capture probe is immobilized on a roughened metal surface and Raman dye labeled target DNA hybridizes with capture probe and the specific Raman signal is observed. It has been successfully applied to detect DNA fragments of the human immunodeficiency virus (HIV) and cancer genes.18, 19 In combination with nanoparticles, a detection limit of 2 × 10-14 M has been reached without much efforts of optimization.17
One of the major difficulties in the development of the SERS technique for DNA detection is the production of surfaces or media that can be readily adapted to the assay formats. The SERS surface must have an easily controlled protrusion size, reproducible structures, and have to be well characterized which are often tedious and increase the cost of detection and portability inevitably. Many surfaces have limited stability, and the change of surface property at molecular level leads to inconsistent optical properties.
1.1.1.3 Chemilluminescent Detection
Luminescent reactions can be catalyzed by a biomolecule, such as hemin or horseradish peroxidase (HRP), or triggered by the application of a potential between the working electrode and a pseudo-reference.20-24 Luminol and derivatives are often used for chemiluminescent (CL) or electrochemiluminescent (ECL) reactions. Marquette et al reported detection of attomol DNA with chemiluminscent method using beads bearing DNA embedded in a poly(vinyl chloride) (PVC) master (Figure 1.3).25
However, chemiluminescence can be triggered by a number of substances, and as a result, leading to false positive readouts. In addition, complicated assay steps and expensive detectors are often needed.
Figure 1.3 Chemiluminescent Detection of DNA, protein and glucose with beads labeled with specific capture probe in PVC master. (Ref 25)
1.1.2 Electrochemical DNA Detection
detected via the increased current signal of an electroactive indicator (that preferentially binds to the DNA duplex), in connection to the use of enzyme- or redox labels, or from other hybridization-induced changes in electrochemical parameters (e.g., conductivity or capacitance).26-38 Electrochemical DNA detection is extremely suitable for delivering the diagnostic information in a fast, simple, sensitive and low cost fashion, are thus uniquely qualified for the demands of point-of-need detection.
Gao’s group reported recently the ultrasensitive detection of cancer marker genes in
Figure 1.4 The amplified electrochemical detection of DNA hybridization via oxidation of the ferrocene caps on the gold nanoparticle/streptavidin conjugates. (Ref 40)
Electrochemical DNA detection is demonstrated a promising platform for point-of-need application in general, but the main challenge for this method is to maintain the accuracy and reliability at the field by non-laboratory users. Surface fabrication of electric device can be complicated and critical for the reproducibility of detection. Special attention should be given to non-specific adsorption issues that commonly control the detection limits of electrochemical assays.
1.1.3. Gravimetric DNA Biosensors
frequency dependent on the total oscillating mass. This frequency increases with an increase in material on the QCM surface. Since the sensor detects the mass change on surface, it is inherently a label-free detection. However, quartzes are expensive, and difficult fabrication technology and the sensitivity to mechanical damage might hinder reliable operation and thus commercialization of this technology.
1.1.4 Conclusion
Some of advantages and disadvantages of the conventional DNA sensors were summarized in Table 1. To meet the demand of point-of-need detection, low cost, portability, and reproducibility are key factors that needs to be considered for sensor design. Disposable easy-to-use glucose strips are kinds of self-testing devices and have dominated the $5 billion/year diabetes monitoring market over the past two decades.48 The commercial success of strip format test demonstrated the great need in the market for developing rapid and low cost biosensor. Coupled with a proper detection method, strip format test possesses additional advantages over the conventional DNA detection method in cost reduction.
Table 1.1 Comparison of Conventional DNA Sensors
Pro Con
optical sensor very sensitive, suitable for high throughput
high cost, not suitable for miniaturization
electrochemical sensor
low cost, small dimensions, sensitive
reproducibility issue, instability
Gravimetric sensor
easy operation, small dimension, sensitive
cost, sensitive to damage
1.2 Lateral Flow DNA Strip Test
Lateral flow (LF) tests have been a well-established diagnostic tool in laboratory. This technology offers additional advantages when compared to the conventional detection
semi-quantitative detection of many analytes including antigens, antibodies, and even the products of nucleic acid amplification tests.49-52 The LF strip consisted of a sample pad, a conjugate pad, an analytical membrane, an absorbent pad and a laminating card, as shown in
Figure 1.5. The analytical membrane was provided with an analyte-specific capture line (test line; T line) and a species-specific positive control line (C line).53
Figure 1.5 Schematic fabrication of the LF strip. The LF strip is clamped by the upper cover plate and the bottom plate. The position of sampling hole was just on top of the sample pad and conjugate. In addition, the position of watch window was also just on top of the absorbent pad. Sample is applied to sampling hole. The T line and C line were in the center of the scanning window, and the watch window could indicate whether the LF assay finished or not. (Ref 53)
Labels such as latex, colloidal gold, carbon, and recently up-converting phosphorus
technology have been employed in LFT development.54-57 The first application of strip assay was the pregnancy test with the detection of human chorionic gonadotropin (HGC).58 The
strip as the absorbent provided an analytical platform that permits one-step, rapid and
low-cost analysis. 59-64
For the application of lateral flow test for nucleic acid detection, DNA is captured on
lateral flow test strips either in an antibody-dependent or antibody independent manner.
Antibody-dependent format employs an antibody capture line and a labeled amplicon or
oligonucleotide probe of complementary sequence to the amplicon (Figure 1.6a).
Alternatively, antibody-independent format is based on the use of two binding partners such
as biotinylated probe or amplicon, and a streptavidin, which present high affinity and
irreversible linkage. Two convenient approaches are possible in such format: (1) the
immobilization of the oligonucleotide capture probe to the nitrocellulose membrane through
passive adsorption (Figure 1.6c) or (2) via passive absorption using BSA oligonucleotide
conjugate capture probe (Figure 1.6b).
So far, about 75% of published report employed colloid Au nanoparticles as labels for
the detection. The responses of color intensity of Au nanoparticles are directly proportional
to the amount of analytes in sample. With a portable strip reader, Mao et al. reported a limit
of detection of 0.5 nM using Au nanoparticles (Figure 1.7).61 Several studies has used other
labels such as fluorescence66 and silver enhancement technique67 to improve the sensitivity, but involvement of additional step inevitably complicated the assay procedures and increase
the assay time. Improvement of detection sensitivity of LFT without compromising the
simplicity of this format is one of the main tasks in the development of LFT. The recently
developed polymerization-based DNA detection has been demonstrated a sensitive and
easy-to-operate format that allows direct visualization of DNA on sensor surface. Great potential
in improving the sensitivity exists if polymerization-based DNA detection could be used in
lateral flow format.
Figure 1.7 Images (top) and recorded response signals (bottom) of lateral flow strip with different concentration of target DNA. (a): 0 nM target DNA; (b): 1000 nM
1.3 Polymerization-based DNA Sensor
Polymerization-based DNA detection has emerged as a sensitive, low cost, and easy-to-operate method that enables direct visualization of DNA binding on a biosensor surface. 68-70
Specifically, hybridization between DNA targets and the affixed capture probes leads to immobilization of polymer reaction initiators on a sensing surface. These initiators prompt polymer growth when proper polymer grafting conditions are met. The resulting polymer brushes change the optical property of the sensing spot, which becomes visually distinguishable from the background. Several thousand copies to low fmol of target DNA molecules have been positively detected without PCR. Assay time has ranged from minutes to hours, dictated by the degree of amplification desired. The fact that no sophisticated equipment is needed for qualitative recognition of the presence of specific DNA sequences renders this amplification-by-polymerization DNA detection scheme a promising solution for point-of-need sensing applications.
The polymerization reactions that have been successfully demonstrated for DNA detection include reversible addition-fragmentation chain transfer polymerization (RAFT), 69 photopolymerization, 70 and atom transfer radical polymerization (ATRP).68
RAFT polymerization operates on the principle of a reversible chain transfer process, facilitated by chain transfer agents (CTAs, containing thiocarbonylthio groups) attached on DNA molecules. The initial radicals formed using conventional thermal, photochemical, redox, or γ-irradiation methods attack the monomers and form P• that start chain growth. P•
the growth rate. Through this technique, as low as 2000 copies of DNA can be visualized.
Figure 1.8 Mechanism of RAFT polymerization on DNA covered surface. The image (right side) illustrates the polymer growth from 1fM target DNA concentration applied on Au surface. (Ref 69)
Figure 1.9 The scheme illustration of DNA sensing with photo polymerization. The image shows polymer growth after 5 min photo irradiation. (Ref 70)
In ATRP technique, the polymerization is controlled via reversible activation-deactivation reaction between the growing polymer chain and a Cu catalyst complex. The activation rate, kact is much smaller than the deactivation rate kdeact, so polymer chain predominantly remain in an inactive state and radical concentration is substantially low compared with conventional free radical concentration, leading to less termination and a better controlled polymer growth (Figure 1.10). The application of this process in DNA sensing allowed polymer growth quantitatively at specific DNA binding site.
Figure 1.10 Proposed mechanism of ATRP. The image shows polymer growth on the DNA spot where initiator is labeled. (Ref 68)
conducted in an oxygen-free environment because oxygen quenches propagating radicals and, in the case of ATRP, oxidizes the Cu(I) catalyst to a non-ATRP active, higher oxidative state of Cu(II) complexes. Rigorous purging with inert gas is crucial in these assays to remove oxygen, but it inevitably complicates the assay procedure and limits the sensing portability.
1.4 DNA Detection via Activators Generated by Electron Transfer Using Atom
Transfer Radical Polymerization Technique
electron transfer (ARGET)79,83 depending on the amount of catalysts used (Scheme 1.1).
Scheme 1.1 Proposed mechanism of AGET ATRP.
sensing applications; (b) the handling of oxidatively unstable Cu(I) was still added to the reaction mixture due to slow reduction of Cu(0); and (c) moreover, large quantity of Cu(0) metal powder was required to reach the optimized condition, raising concerns over its adverse impact on DNA stability and environment-friendly disposal of Cu-containing waste.
Scheme 1.2 Scheme illustration of DNA detection using AGET ATRP technique
Chapter 2 describes the development of DNA detection with AGET ATRP on Au surface. Ascorbic acid (AA) as an environmental friendly, water-soluble reducing agent was used to allow polymer grafting to be carried out in a homogeneous reaction environment without purging, which significantly improved the assay robustness and simplified the assay procedure. Three different ATRP ligands were examined for their effectiveness in polymer grafting from initiator-coupled single strand DNA (ssDNA) on a Au surface. Optimal concentrations of the Cu (II) catalyst and AA were established to examine effective polymer grafting on surface. Detection specificity and sensitivity was evaluated for which DNA sequences with point mutations were distinguished from the perfectly matched DNA target sequences.
Chapter 3 describes the efforts in improving visual detection through copolymerization of colorimetric copolymer with AGET ATRP. Color visualization of sensing results on specific substrates is prerequisite for dip-stick-based DNA detection. Covalent incorporation of chromophores in polymers is one of the logic solutions to meet
Capture probe immobilization
Target
identification
Initiator labeling Amplification by polymerization
such a requirement. Two colorimetric monomers, blue and yellow, were synthesized in solution, and copolymerization of two monomers with HEMA was demonstrated. Blue-colored monomer was used as the model monomer to study incorporation efficiency and conversion rate in detail.
Chapter 4 describes the grafting of ionic polymers on Au surface using AGET ATRP technique. The growth of ionic polymer will significantly change the surface properties of sensor substrate which allows application of various staining methods to improve the visibility of DNA detection. A negatively charged monomer, 3-Sulfopropyl methacrylate potassium salt (SPM), and a positively charge monomer, 2-(methacryloyloxy)ethyl-trimethylammoniumchloride (MeDMA) were employed. The shorter assay time, which is important in development of DNA strip test, can be achieved using SPM polymerization. The optimized catalyst concentration for both monomers was examined
Chapter 5 describes the efforts in further improving detection sensitivity through application of polylysine (PLL) as a carrier to bring multiple initiators to each DNA binding event. Partial modification of the amino groups on the side chains of polylysine with initiators forms a macroinitiator which bears positive charges. Interaction of positively charged macroinitiators with DNA brings a large number of initiators to DNA electrostatically in a label-free fashion, which improves the detection sensitivity about 60 folders. The optimized modification ratio and polylysine concentration was investigated for the improved performance.
fluorophores, bound electrostatically with DNA. Taking advantage of aggregation effect of PLL macrofluorophore, three magnitudes enhancement was achieved. Application of PLL macrofluorophore in protein multiplex detection was also demonstrated with 2 orders of magnitude enhancement in detection sensitivity.
REFERENCES
1. Sassolas, A.; Leca-Bouvier, D. B.; Blum, J. L. Chem. Rev. 2008, 108, 109.
2. Jangam, S.R.; Yamada D.H.; McFall, S.R.; Kelso, D.M. J Clin Microbiol, 2009, 47, 2363. 3. Park, S.J.; Taton, T.A.; Mirkin, C. A. Science 2002, 295, 1503.
4. Dineva, M. A.; Candotti, D.; Fletch-Brown, F.; Allain, J,-P.; Leel, H. J. Clin Microbiol.
2005, 43, 4015.
5. Abel, A. P.; Weller, M. G.; Duveneck, G. L.; Ehrat, M.; Widmer, H. M. Anal. Chem.
1996, 68, 2905.
6. Zhi, Z.-L.; Morita, Y.; Yamamura, S.; Tamiya, E. Chem. Commun.2005, 19, 2448.
7. Ali, M. F.; Kirby, R.; Goodey, A. P.; Rodriguez, M. D.; Ellington, A. D.; Neikirk, D. P.; McDevitt, J. T. Anal. Chem. 2003, 75, 4732.
8. Ferguson, J. A.; Boles, T. C.; Adams, C. P.; Walt, D. R. Nat. Biotechnol. 1996, 14, 1681. 9. Song, L.; Ahn, S.; Walt, D. R. Anal. Chem. 2006, 78, 1023.
10. Bowden, M.; Song, L.; Walt, D. R. Anal. Chem. 2005, 77, 5583.
11. Fan, C. H.; Plaxco, K. W.; Heeger, A. J. Proc. Natl. Acad. Sci. U.S.A. 2003, 100, 9134. 12. Liu, X. J.; Tan, W. H. Anal. Chem. 1999, 71, 5054.
13. Bruchez, M., Jr.; Moronne, M.; Gin, P.; Weiss, S.; Alivisatos, A. P. Science 1998, 281, 2013.
14. Somers, R. C.; Bawendi, M. G.; Nocera, D. G. Chem. Soc. Rev. 2007,36, 579.
15. Medintz, I. L.; Uyeda, H. T.; Goldman, E. R.; Mattoussi, H. Nat. Biotechnol. 2005, 4, 435. 16. S. Hohng, T. Ha, Chem. Phys. Chem. 2005, 6, 956.
18. Zhao, X.; Tapec-Dytioco, R.; Tan, W. J. Am. Chem. Soc. 2003, 125, 11474.
19. Kneipp, K.; Kneipp, H.; Itzkan, I.; Dasari, R. R.; Feld, M. S. Chem. Rev. 1999, 99, 2957. 20. Cao, Y. C.; Jin, R.; Mirkin, C. A. Science 2002, 297, 1536.
21. Isola, N. R.; Stokes, D.; Vo-Dinh, T. Anal. Chem. 1998, 70, 1352.
22. Culha, M.; Stokes, D.; Allain, L. R.; Vo-Dinh, T. Anal. Chem. 2003, 75, 6196. 23. Niazov, T.; Pavlov, V.; Xiao, Y.; Gill, R.; Willner, I. Nano Lett. 2004, 4, 1683.
24. Mallard, F.; Marchand, G.; Ginot, F.; Campagnolo, R. Biosens. Bioelectron. 2005, 20, 1813.
25. Marquette, C. A.; Thomas, D.; Degiuli, A.; Blum, L. J. Anal. Bioanal. Chem. 2003, 377, 922.
26. Yang, M. L.; Liu, C. Z.; Qian, K. J.; He, P. G.; Fang, Y. Z. Analyst 2002, 127, 1267. 27. Marquette, C. A.; Blum, L. J. Biosens. Bioelectron. 2004, 20, 197.
28. Marquette, C. A.; Blum, L. J. Anal. Chim. Acta 2004, 506, 127. 29. Alfonta, L.; Singh, A. K.; Willner, I. Anal. Chem. 2001, 73, 91
30. Lucarelli, F.; Marrazza, G.; Mascini, M. Biosens. Bioelectron. 2005, 20, 2001. 31. Zhu, N. N.; Chang, Z.; He, P. G.; Fang, Y. Z. Electrochim. Acta 2006, 51, 3758.
32. Moreno-Hagelsieb, L.; Foultier, B.; Laurent, G.; Pampin, R.; Remacle, J.; Raskin, J.-P.; Flandre, D. Biosens. Bioelectron. 2007, 22, 2199.
33. Cheng, Y. T.; Pun, C. C.; Tsai, C. Y.; Chen, P. H. Sens. Actuators, B 2005, 109, 249. 34. Park, S. J.; Taton, T. A.; Mirkin, C. A. Science 2002, 295, 1503.
35. Peng, H.; Soeller, C.; Vigar, N. A.; Caprio, V.; Travas-Sejdic, J.Biosens. Bioelectron.
2007, 22, 1868.
37. Fu, Y.; Yuan, R.; Chai, Y.; Zhou, L.; Zhang, Y. Anal. Lett. 2006, 39, 467.
38. Xu, Y.; Jiang, Y.; Yang, L.; He, P.-G.; Fang, Y.-Z. Chin. J. Chem. 2005, 23, 1665.
39. Kerman, K.; Ozkan, D.; Kara, P.; Erdem, A.; Meric, B.; Nielsen, P.E.; Ozsoz, M. Electroanalysis 2003, 15, 667.
40. Erdem, A.; Pividori, M. I.; del Valle, M.; Alegret, S. J. Electroanal. Chem. 2004, 567, 29. 41. Erdem, A.; Pividori, M. I.; Lermo, A.; Bonanni, A.; del Valle, M.; Alegret, S. Sens.
Actuators, B 2006, 114, 591.
42. Tansil, N.C., Xie, F., Xie, H., Gao, Z. Chem. Commun. 2005, 1064–1066.
43. Wang, J.; Li, J.; Baca, J. A.; Hu, J.; Zhou, F.; Yan, W.; Pang, D. Anal. Chem. 2003, 75, 3941.
44. O’Sullivan, C. K.; Guilbault, G. G. Biosens. Bioelectron. 1999, 14,663.
45. Willner, I.; Patolsky, F.; Weizmann, Y.; Willner, B. Talanta 2002, 56, 847. 46. Patolsky, F.; Lichtenstein, A.; Willner, I. J. Am. Chem. Soc. 2000, 122, 418. 47. Mao, X. L.; Yang, L. J.; Su, X. L.; Li, Y. B. Biosens. Bioelectron.2006, 21, 1178.
48. Okahata, Y.; Matsunobu, Y.; Ijiro, K.; Mukae, M.; Murakami, A.;Makino, K. J. Am. Chem. Soc. 1992, 114, 8299.
49. Su, X. D.; Robelek, R.; Wu, Y. J.; Wang, G. Y.; Knoll, W. Anal. Chem. 2004, 76, 489. 50. Su, X. D.; Wu, Y. J.; Knoll, W. Biosens. Bioelectron. 2005, 21, 719.
51. Newman, J.; Turner, A.P.F. Biosens. Bioelectron. 2005, 20, 2435. 52. Gosling, J. P. Clin. Chem., 1990, 36, 1408.
53. Price, C. P. Clin. Chem., 1998, 44, 2071.
54. Zhao, Y.; Zhang, G.; Liu, Q.; Teng, M.; Yang, J.; Wang, J. J. Agric. Food Chem. 2008,
55. Zhang, M.; Wang, M.; Chen, Z.; Fang, J.; Fang, M.; Liu, J.; Yu, X. Anal Bioanal Chem
2009, 395, 2591.
56. Huang, L.; Zhou, L.; Zhang, Y.; Xie, C.; Qu, J.; Zeng, A.;Huang, H.; Yang, R.; Wang, X.IEEE Sensors J. 2009, 9, 1185.
57. Hampl, J.; Hall, M.; Mufti, N. A.; Yao, Y.M.D.; MacQueen, D.; Wright, W.H.; Cooper, D.E. Anal Biochem, 2001, 288,176.
58. Takanashi. S.; Okame, M.; Shiota, T.; Takagi, M.; Yagyu, F.; Tung. P. G.;Nishimura, S.; Katsumata, N.; Igarashi, T.; Okitsu, S.; Ushijima, H. J Virol Methods 2008,148,1.
59. Wang. X.; Li, K.; Shi, D.; Xiong. N.; Jin. X.; Yi, D.; Bi, D. J Agric Food Chem, 2007, 55, 2072.
60. Yan, Z.; Zhou, L.; Zhao, Y.; Wang, J.; Huang, L.; Hu, K.; Liu, H.; Wang, H.; Guo, Z.; Song, Y.; Huang, H.; Yang, R. Sens Actuators B, 2006, 119, 656.
61. Leuvering, J.H.W.; Thal, P.J.H.M.; Van der Waart, M.; Schuurs, A.H.W.M. J Immunoassay Immunochem1980, 1, 77.
62.Carter, D.J.; Cary, R.B. Nucleic Acids Res2007, 1, 11.
63. Edwards, K.A.; Baeumner, E.J. Method Mol Bio2008, 504,185.
64. Mao, X.; Ma, Y.; Zhang, A.; Zhang, L.; Zeng, L.; Liu, G.Anal. Chem. 2009, 81, 1660. 65. Toubanaki, K.D.; Christopoulos, K. T.; Ioannou, C. P.; Gravanis, A. Human Mutation
2008, 29,1071.
66. Wang, J.; Chen, Z.; Corstjens, P. L. A. M.; Mauka, M. G.; Bau, H. H. Lab Chip, 2006, 6, 46.
67. Soliman, H.; El-Matbouli, M. Molecular and Cellular Probes 2010, 24, 38.
69.Khreich, N.; Lamourette, P.; Boutal, H.; Deveilliers, K.; Creminon, C.; Vollad, H.; Anal
Biochem2008, 377, 182.
70.Cho, I-H.; Seo, S-M.; Paek, E-H.; Paek, S-H. J Chromatogr B2010,878, 271.
71. Lou, X.; Lewis, M. S.; Gorman, C. B.; He, L. Anal. Chem. 2005, 77, 4698.
72. He, P.; Zheng, W.; Tucker, E. Z.; Gorman, C. B.; He, L. Anal. Chem. 2008, 80, 3633. 73. Sikes, H. D.; Hansen, R. R.; Johnson, L. M.; Jenison, R.; Birks, J. W.; Rowlen, K. L.;
Bowman, C. N. Nat. Mater. 2008, 7, 52.
74. Johnson, L. M.; Avens, H. J.; Hansen, R. R.; Sewell, H. L.; Bowman, C. N. Aust. J. Chem. 2009, 62, 877.
75. Hansen, R. R.; Sikes, H. D.; Bowman, C. N. Biomacromolecules 2008, 9, 355. 76. Jakubowski, W.; Matyjaszewski, K. Macromolecules 2005, 38, 4139.
77. Braunecker, W. A.; Matyjaszewski, K. Prog. Polym. Sci. 2007, 32, 93. 78. Cunningham, M. F. Prog. Polym. Sci. 2008, 33, 365.
79. Wang, J.-S.; Matyjaszewski, K. Macromolecules 1995, 28, 7572.
80. Li, M.; Jahed, N. M.; Min, K.; Matyjaszewski, K. Macromolecules 2004, 37, 2434. 81. Matyjaszewski, K.; Jakubowski, W.; Min, K.; Tang, W.; Huang, J.; Braunecker, W. A.;
Tsarevsky, N. V. Proc. Natl. Acad. Sci. U.S.A. 2006, 103,15309.
82. Jakubowski, W.; Min, K.; Matyjaszewski, K. Macromolecules 2006, 39, 39.
83. Esteves, A. C. C.; Bombalski, L.; Trindade, T.; Matyjaszewski, K.; Barros-Timmons, A. Small 2007, 3, 1230.
84. Okelo, G. O.; He, L. Biosens. Bioelectron. 2007, 23, 588.
86. Stoffelbach, F.; Griffete, N.; Bui, C.; Charleux, B. Chem. Commun. 2008, 39, 4807. 87. Min, K.; Gao, H.; Matyjaszewski, K. J. Am. Chem. Soc. 2005, 127, 3825.
88. Siegwart, D. J.; Oh, J. K.; Gao, H.; Bencherif, S. A.; Perineau, F.; Bohaty, A. K.; Hollinger, J. O.; Matyjaszewski, K. Macromol. Chem. Phys. 2008, 209, 2179.
89. Bombalski, L.; Min, K.; Dong, H.; Tang, C.; Matyjaszewski, K. Macromolecules 2007, 40, 7429.
90. Oh, J. K.; Min, K.; Matyjaszewski, K. Macromolecules 2006, 39, 3161.
91. Gao, H.; Min, K.; Matyjaszewski, K. Macromol. Chem. Phys. 2006, 207, 1709.
92. Oh, J. K.; Dong, H.; Zhang, R.; Matyjaszewski, K.; Schlaad, H. J. Polym. Sci., Part B
2007, 45, 4764.
93. Matyjaszewski, K.; Dong, H.; Jakubowski, W.; Pietrasik, J.; Kusumo, A. Langmuir 2007, 23, 4528.
Chapter 2 DNA Detection with AGET ATRP
2.1 Introduction
As described in chapter 1, polymerization-based DNA detection shows promising result, especially in the field of application for instrument-free and low-cost detection.1-5 Accumulation of polymeric material on surface allows direct visualization of the presence of as low as 1000 copies DNA without the aid of PCR.
The polymerization techniques currently employed suffers from the purging step that is used to maintain an oxygen-free environment. Introducing a nonpurged polymerization technique will significantly improve the portability of this detection platform and reduce the cost.
In this chapter, activators generated by electron transfer for atom transfer radical polymerization (AGET ATRP) technique is used to amplify the detection signal. The introduction of water-soluble reducing agent, ascorbic acid, allows in situ consumption of oxygen and activation of Cu catalyst. The concentration of catalyst, the amount of ascorbic acid, and the selection of ligand was investigated. The preliminary study in application of AGET ATRP in DNA detection lay down the ground for later chapters.
2.2 Experimental Section
2.2.1 Material
in Table 1. Thiolated 15-mer Peptide nucleic acid (PNA) was purchased from Panagene (Korea) and the sequence was listed in Table 2.1
Table 2.1 DNA Sequences Used in This Chapter
Name Sequence Description
A 5’ NH2-(CH2)6-TAA CAA TAA TCC CTC
A20 (CH2)3-S-S-(CH2)2CH3
Dual functional DNA used to study the evolution of PHEMA film on DNA-coated Au surface
PNA SH-(CH2)11-CAC ATC GTA TCC TAG Capture probe complementary to
C
C 5’ NH2-(CH2)6-A21CTA GGA TAC GAT
GTG Complementary target DNA
NC 5’ NH2-(CH2)6-A21TCC TTA TCA ATA
TTA Noncomplementary target DNA
M1 5’ NH2-(CH2)6-A21CTA GGA TAT GAT
GTG
Single mismatched target DNA with mutation site in middle (shown in italic, boldface)
M2 5’NH2-(CH2)6-A21CTA GAA TAC GAT
GTG
Single mismatched target DNA with mutation site closer to the 5’ end (shown in italic, boldface)
M3 5’NH2-(CH2)6-A21CTA GGA TAC GAT ATG
Single mismatched target DNA with mutation site closer to the 3’ end (shown in italic, boldface)
and used as received. Tris[(2-pyridyl)methyl]amine (TPMA), was purchased from ATRP Solutions (Pittsburg, PA). Copper (II) chloride was purchased from Fisher.
2.2.2 AGET ATRP Polymerizations
For solution Polymerization of HEMA, The catalyst mixture of CuBr2 (6.7 mg, 0.03 mmol), Me4Cyclam (5.1 mg, 0.02 mmol) and dnNbpy (8.2 mg, 0.02 mmol) in DMF as specified in detail the discussion section were added to an aqueous solution of HEMA (1:1 v:v HEMA/H2O). The reaction vial was then sealed immediately after addition of AA. The polymerization was run at room temperature for various time and stopped by expose to air. The molecular weight was determined by gel permeation chromatography (GPC). Conversion was monitored by NMR.
2.2.3 Immobilization of Initiator-coupled ssDNA on Au surface
Au substrates were cleaned in a piranha solution (70% H2SO4, 30% H2O2, potentially explosive, handles with care) for 1 h prior to use. N-hydroxysuccinmidyl bromoisobutyrate (NHS-initiator) was prepared as in previous reported procedure.4 Specifically, thiolated ssDNA A (100 µM, 3 µL) and a NaHCO3/Na2CO3 buffer, pH 9.0 (1.0 M, 5 µL) were first mixed in a 1.5-mL eppendorf tube. The NHS-initiator (10 mg/mL in DMF, 10 µL) was added to the mixture solution. The total reaction volume was brought to 50 mL by adding 32 mL DI H2O. The coupling reaction was finished in 1 h at room temperature. A DTT solution (0.1 M, 23.5 µL) and 1.5 µL TEA were added to the coupling reaction mixture to reduce the disulfide bond at the 3’end of ssDNA and generate a free thiol group for surface
immobilization. The modified ssDNA was then purified by gel filtration (Biospin column, Biorad, PA). The concentration of the initiator-coupled ssDNA was determined by UV/vis absorption at 260 nm and was adjusted to 1 µM in 1 M KH2PO4.
The initiator-coupled ssDNA in KH2PO4 was then spotted onto a cleaned Au substrate and the substrate was incubated in a humid chamber overnight. The reduced ssDNA without initiators was spotted at adjacent spots on the same surface and served as the control. The substrates were then immersed in 1 mM MCH for 1 h to block the unoccupied surface binding sites and remove nonspecifically adsorbed ssDNA on the Au surface. The substrate was briefly rinsed afterwards and was blown dry with a flow of nitrogen.
2.2.4 PNA Immobilization and DNA Hybridization on Au Surface
Sulfide-modified PNA probes were prepared at 5 µM in a 50 mM NaHCO3/Na2CO3 buffer (pH 9.0) containing 10% 1-methyl-pyrrolidinone. The solution was spotted on a clean Au surface and was placed in a humid chamber overnight. After probe immobilization, Au substrates were rigorously washed with DI H2O and then immersed in 1 mM MCH for 1 h. The substrate was briefly rinsed afterwards and was blown dry with a flow of nitrogen.
The immobilized PNA probes were prehybridized for 30 min at room temperature in the hybridization buffer of 30% formamide, 1 SSC, 0.05% tween 20 and 5%
1-methyl-pyrrolidinone. The prehybridization buffer was then replaced with the same buffer but containing initiator-coupled complementary ssDNA (C) at a concentration of 3 µM, unless otherwise specified. Hybridization was carried out at 37 oC for 30 min. After hybridization, the substrate was post-hybridized with 1 SSC, 0.05% tween 20 for 5 min, followed by 0.1
SSC, 0.05% tween 20 for another 5 min to remove nonspecifically bound DNA. The substrate was finally washed with DI H2O and blown dry with a flow of nitrogen for subsequent polymerization. Meanwhile, initiator-coupled non-complementary DNA (NC) was used as the control. Initiator-coupled target DNAs with single mismatches at different positions were used in the binding specificity test. All DNA sequences went through hybridization under the same protocol.
2.2.5 Instrumentation
The DNA concentration was determined using a HP8453 UV-vis spectrophotometer (Agilent Technologies, CA). KH2PO4 buffer (1 M) was used as blank.
MA) using a Polypore column (MW operating range 200-2,000,000 Da, nominal particle sized 5um,polymer laboratories). DMF with 50 mM LiBr was used as mobile phase at flow rate of 1 mL/min at 35˚C. Linear poly(methyl methacrylate) (PMMA) standards were used
for calibration. For GPC measurement, an aliquot of the polymer samples was dissolved in DMF and filtered through a 0.2 um filter.
1
H NMR spectra were recorded on a Varian 300 MHz spectrometer. CDCl3 or d6-DMSO was used as solvent. The monomer vinyl signals of HEMA were at 5.5 and 6.0 ppm. As polymerization proceeded, the intensity of proton signals in the methane groups of methacrylate at 0.5-1.0 ppm increased, indicating the formation of polymer.
Film thicknesses were measured with an AutoEL-III automatic ellipsometer (Rudolph
Research, NJ). The instrument irradiated the substrates at a 70º
reflective index of 1.51 was used for the polymer films. All surface measurements were conducted on dried polymer films.
2.3 Result and Discussion
2.3.1 Solution Polymerization of HEMA with AGET ATRP
O OH O * O HO O n CuCl2 / L
N O
O O
O Br
+
CuCl / L+
NO O O O
AA
O
2Oxidized AA
N O O OO C•
Scheme 2.1 Solution Polymerization of HEMA with AGET ATRP
space of the reaction vial is 0.6 mL (0.005 mmol), and the steochiomic ratio of oxygen to ascorbic acid is 1:1, so 0.005 mmol of ascorbic acid is needed in this case to consume oxygen. The steochiomic ratio of ascorbic acid to Cu(II) is 1:2. The amount of Cu(II) in the system is 0.003 mmol. The amount of ascorbic acid added to the reaction (0.006 mmol) is enough to consume all oxygen in headspace and partially reduced Cu(II) to Cu(I) to initiate the polymerization. However, considering the solubility of oxygen and the diffusion process of oxygen from headspace to reaction solution, the actual amount of oxygen in reaction mixture should be less than the total amount of oxygen present in headspace. Therefore, a ratio of Cu(II)/Ascorbic 1:1.5 was used here. Note the appropriate amount of ascorbic acid is hard to obtain by simple estimation and should be determined empirically.
Me4Cyclam and dnNbpy were used as ligands. Cu/Me4Cyclam complex is known as very active catalyst system that provides fast polymerization,9,10 which would benefit the short assay time for polymerization-based DNA detection. It was reported using Cu(II)/dnNbpy as deactivator and Cu(I)/Me4Cyclam as activator source provided better control over the polymerization than using Me4Cyclam alone.7 In our case, a combination of Cu(I)/Me4Cyclam, Cu(I)/dnNbpy, Cu(II)/ Me4Cyclam and Cu(II)/dnNbpy were probably present and acted as the reaction catalysts as the reaction proceeded. After polymerization, polymer mixture was subjected to NMR and GPC analysis.
0 2 4 6 0.00
0.04 0.08 0.12
Reaction Time (h) A
ln
[
M0
]
/[
M
]
0 20 40 60 80
0.0 0.1 0.2 0.3 0.4
ln
[
M0
]
/[
M
]
Reaction Time (min) B
Figure 2.1 kinetic plots for AGET ATPR of pHEMA in solution with different initiator
concentration. Experimental conditions: (A)
106 105
104
S
ig
n
a
l
in
te
n
s
it
y
Molecular Weight
pHEMA, PDI 1.15
A
0 8 16 24 32
0 40000 80000 120000
Conversion (%)
M
n
B
1.2 1.4 1.6 1.8
P
D
I
The polymerization process at high initiator concentration was further characterized with GPC experiment. Figure 2.2 (A) shows a representative GPC trace of pHEMA. Figure 2.2 (B) shows the molecular weight of pHEMA increased linearly with conversion. The molecular weight from GPC was about 50% higher than theoretical mol