THE MODERATING EFFECT OF GREEN PRODUCTIVITY PRACTICES ON THE RELATIONSHIP BETWEEN INNOVATIVE CAPABILITIES AND
FIRMS‘ COMPETITIVE PERFORMANCE
LEE LAI FATT
A thesis submitted in fulfilment of the requirements of the award of the degree of
Doctor of Philosophy (Management)
Faculty of Management Universiti Teknologi Malaysia
ACKNOWLEDGEMENT
iv
ABSTRACT
Malaysia Productivity Corporation (MPC) has introduced green productivity (GP)
to address global warming by providing value-added information on productivity, quality,
competitiveness and best practices through research innovative activities and creative
culture. Although GP is limited in Malaysia, firms are encouraged to invest in it through
the support of Green Technology Financing Scheme (GTFS). However, researchers found
that the environmental technology awareness is low in the Asian region, as the percentage
of invention patents is small and firms do not have the capability to innovate. Therefore,
this study investigated the link among the seven dimensions of innovation capabilities (ICs)
comprising learning, R&D, resources allocation, manufacturing, marketing, organization
and strategic planning, by relating them with GP and a firm‘s competitive performance. By
adopting Resource Based View (RBV) and Contingent Resource Based View (CRBV) and
Theory of Planned Behaviour (TPB), the study investigated the link between ICs and a
firm‘s competitive performance moderated by GP. Empirical quantitative data were
collected from 88 samples selected from Small Medium Enterprises (SMEs) manufacturing
firms in Malaysia. Structural Equation Modeling by using SMARTPLS software was
employed to examine the relationship in the framework between ICs, GP practices and
three performance indicators: sales performance, innovation performance and product
performance. The results revealed that R&D capability has the most influential impact on a
firm‘s competitive performance measures. The findings further verified that different ICs
through GP practices have different impacts on different performance measures. Therefore,
ICs and new perceptions of GP do not focus only on moral responsibility but include key
strategic decisions aimed at achieving a firm‘s success and sustainable performance in the
future. The theoretical and practical implications of the study are the GP implementation,
and how it has empirically validated the importance of R&D capability in promoting
ABSTRAK
Perbadanan Produktiviti Malaysia (MPC) telah memperkenalkan produktiviti hijau
(GP) bagi menangani pemanasan global dengan menyediakan maklumat nilai tambah
kepada produktiviti, kualiti, daya saing dan amalan terbaik dalam aktiviti inovatif
penyelidikan dan budaya kreatif. Walaupun GP adalah terhad di Malaysia, syarikat
digalakkan untuk melabur dalam GP melalui sokongan Skim Pembiayaan Teknologi Hijau
(GTFS). Namun begitu, para penyelidik mendapati bahawa kesedaran terhadap teknologi
alam sekitar adalah rendah di rantau Asia kerana peratusan paten ciptaan adalah kecil dan
syarikat tidak mempunyai keupayaan untuk membuat inovasi. Oleh itu, kajian ini mengkaji
rangkaian yang tergolong dalam tujuh dimensi keupayaan inovasi (ICs) terdiri daripada
pembelajaran, R&D, peruntukan sumber, pembuatan, pemasaran, organisasi dan
perancangan strategik dan menghubungkannya dengan GP serta prestasi daya saing
syarikat. Dengan mengguna pakai Pandangan Berasaskan Sumber (RBV) dan Pandangan
Berasaskan Sumber Kontinjen (CRBV) serta Teori Tingkah Laku Terancang (TPB), kajian
ini mengkaji hubungan antara ICs dengan prestasi daya saing syarikat melalui
penyederhanaan GP. Data kuantitatif empirik telah diperolehi daripada 88 sampel yang
dipilih daripada syarikat pembuatan Perusahaan Kecil dan Sederhana (SMEs) di Malaysia.
Model Persamaan Berstruktur (SEM) dengan menggunakan software SMARTPLS
digunakan untuk mengkaji hubungan yang terdapat dalam rangka kerja antara ICs, amalan
GP dengan tiga penunjuk prestasi: prestasi jualan, prestasi inovasi dan prestasi produk.
Dapatan kajian menunjukkan keupayaan R&D adalah yang paling mempunyai kesan
pengaruh ke atas ukuran prestasi daya saing syarikat. Dapatan kajian selanjutnya
mengesahkan bahawa ICs yang berbeza melalui amalan GP mempunyai kesan berbeza ke
atas ukuran prestasi yang berbeza. Oleh itu, ICs dan persepsi baharu GP tidak memberi
tumpuan hanya kepada tanggungjawab moral tetapi termasuk juga keputusan strategik
utama yang mengarah kepada pencapaian kejayaan dan kemampanan prestasi syarikat pada
masa hadapan. Implikasi teori dan praktikal kajian ini adalah pelaksanaan GP, dan
bagaimana ia secara empirik mengesahkan kepentingan keupayaan R&D dalam
vi
TABLE OF CONTENTS
CHAPTER TITLE PAGE
DECLARATION ii
ACKNOWLEDGEMENT iii
ABSTRACT iv
ABSTRAK v
TABLE OF CONTENTS vi
LIST OF TABLES xii
LIST OF FIGURES xiv
LIST OF ABBREVIATIONS xvi
LIST OF APPENDICES xx
1 INTRODUCTION 1
1.1 Background of the Study 1
1.1.1 Manufacturing Sector 4
1.1.2 The Case of Malaysia 7
1.1.3 The Balance Approach 14
1.2 Problem Statement 14
1.3 Research Questions 19
1.4 Research Objectives 20
1.5 Significance of the Study 21
1.6 Research Scope 24
1.8 Operational Definitions 26
1.9 Structure of Thesis 29
2 LITERATURE REVIEW 31
2.1 Introduction 31
2.2 Innovation 32
2.3 Evolution of Innovation Capabilities 33
2.4 Innovation Capabilities 36
2.4.1 Focus Trends 36
2.4.1.1 Human Factor 36
2.4.1.2 Non-Human Factor 39 2.4.1.3 Knowledge Factor 39
2.4.2 Integration Trends 40
2.5 Technological Innovation Capability 42
2.6 SMEs in Innovation Capability 45
2.7 Green in Innovation Capability 46 2.8 Dimensions of Innovation Capabilities 47
2.8.1 Learning Capability 47
2.8.2 R&D Capability 48
2.8.3 Resources Allocation Capability 48 2.8.4 Manufacturing Capability 48
2.8.5 Marketing Capability 49
2.8.6 Organization Capability 50 2.8.7 Strategies Planning Capability 50
2.9 Firm‘s Competitive Performance 50
2.9.1 Sales Performance 52
2.9.2 Innovation Performance 53
2.9.3 Product Performance 53
2.10 Green Productivity Practices 54
viii Variable
2.12 Underpinning Theory 58
2.12.1 Resource-Based View 58
2.12.2 Contingent Resource-Based View 59 2.12.3 Theory of Planned Behaviour 60
2.13 Conceptual Model 61
2.14 Summary 62
3 RESEARCH METHODOLOGY 63
3.1 Introduction 63
3.2 Research Design 63
3.3 Rationalization for Research Paradigm 64
3.4 Research Framework 66
3.4.1 Sample Decision 66
3.4.2 Unit of Analysis 68
3.4.3 Conducting Pilot Test 69
3.5 Data Collection Methods 71
3.5.1 Questionnaire 73
3.5.2 Respondents 81
3.5.3 Gaining Access Primary Data 82
3.5.4 Secondary Data 82
3.5.5 Data Screening and Coding 83
3.5.6 Treatment of Missing Data 84
3.6 Hypotheses: Interaction Variables of the Framework
84
3.6.1 Innovation Capability and Firms‘ Competitive Performance
85
3.6.2 Innovation Capability and Firms‘ Competitive Performance through an Increase on Green Productivity Practices
3.7 Data Analysis Methods 89 3.7.1 Preliminary Data Analysis
Techniques
90
3.7.2 Multicollinearity 91
3.8 Partial Least Square-Structural Equation Modeling
92
3.8.1 Reflective and Formative Indicators 94 3.8.2 Measurement Model Assessment 95
3.8.2.1 Reliability 96
3.8.2.2 Validity 97
3.8.3 Structural Model Assessment 98
3.9 PLS for Higher Order Constructs 100
3.10 Moderation Test 101
3.11 Presenting the Analysis 104
3.12 Ethical Issues 105
3.13 Summary 105
4 DATA ANALYSIS AND RESULTS 107
4.1 Introduction 107
4.2 Multivariate Outliers 108
4.3 Assessment of Normality of Data 108
4.4 Demographical Statistics 111
4.5 Descriptive Statistics 114
4.6 Justification for Using PLS for this study 115
4.7 PLS Path Modeling 116
4.8 Measurement Model 116
4.8.1 Internal Consistency Reliability and Convergent Validity
117
4.8.2 Discriminant Validity 121
x
4.9 Structural Model 126
4.9.1 Assessment of Formative Model for Second Order
127
4.9.2 Research Question One 129
4.9.3 Research Question Two 131
4.9.4 Research Question Three 133
4.9.5 Research Question Four 136
4.10 Summary of the Chapter 139
5 DISCUSSION AND RECOMMENDATIONS 141
5.1 Introduction 141
5.2 Preliminary Study Findings 142
5.3 Survey Analysis, Findings and Discussion 143 5.3.1 Relationship between Learning
Capability and Firm‘s Competitive Performance
143
5.3.2 Relationship between R&D
Capability and Firm‘s Competitive Performance
144
5.3.3 Relationship between Resource Allocation Capability and Firm‘s Competitive Performance
145
5.3.4 Relationship between Manufacturing Capability and Firm‘s Competitive Performance
145
5.3.5 Relationship between Marketing Capability and Firm‘s Competitive Performance
146
5.3.6 Relationship between Organization Capability and Firm‘s Competitive Performance
147
Planning Capability and Firm‘s Competitive Performance 5.3.8 Moderator Effect of Green
Productivity Practices
148
5.4 Implications of the Study 149
5.4.1 Contribution to Theory 150
5.4.2 Contribution to Practice 151
5.5 Limitations of the Study 152
5.6 Recommendations of the Study 153
5.7 Conclusion 155
REFERENCES 157
xii
LIST OF TABLES
TABLE NO. TITLE PAGE
1.1 Malaysia Ranks 20th in the World Competiveness Scoreboard 2015: Malaysia and Top Ten Performers
10
3.1 Definition of Malaysian Manufacturing SMEs (Comes to Effect on 1 January 2014)
68
3.2 Analysis of Questionnaires from the Pilot Test 69
3.3 Cronbach‘s Alpha Test for the Pilot Study 70
3.4 Summary of Responses 73
3.5 Summary of Items Used in Questionnaire 75
3.6 Systematic Evaluation of PLS-SEM Results 94
3.7 Indices for Measurement Model Analysis Using Partial Least Square SEM (PLS—SEM)
96
3.8 Indices for Structural Model Analysis Using Partial Least Square SEM (PLS—SEM)
100
3.9 Steps to Compute Moderator Analysis (Continuous Data) 103
3.10 Analysis Methods 106
4.2 Results of Normality Test for Kolmogorov-Smirnov 111 4.3 Demographical Statistics for Questionnaire Survey 112 4.4 Descriptive Statistics for Variables under Investigation 115 4.5 Assessment of Internal Consistency and Convergent
Validity
119
4.6 Discriminant validity result of Constructs (Cross Loadings)
121
4.7 Discriminant Validity Result of Constructs (Fornell-Larcker)
122
4.8 Removed Indicators from the Measurement Model 123 4.9 Final Results of the Assessment of Measurement Models 124 4.10 Collinearity Diagnostic and Indicators Weight 125 4.11 Collinearity Diagnostic for Innovation Capability
Dimensions
128
4.12 Collinearity Diagnostic for Competitive Performance Dimensions
129
4.13 Results of Hypotheses Testing Related to Research Question One
131
4.14 Results of Hypothesized Testing Related to Research Question Two
131
4.15 Results of Hypothesized Testing Related to Research Question Three
134
4.16 Results of Hypothesized Testing Related to Research Question Four
137
4.17 Results of Second Hypothesis and Their Related Sub-Hypothesis with the Moderating Test
xiv
LIST OF FIGURES
FIGURE NO. TITLE PAGE
1.1 Annual Overall GDP Growth, Manufacturing GDP and SMEs GDP Growth (2006-2011)
4
1.2 Contributions of SMEs Manufacturing, 2006-2009 6
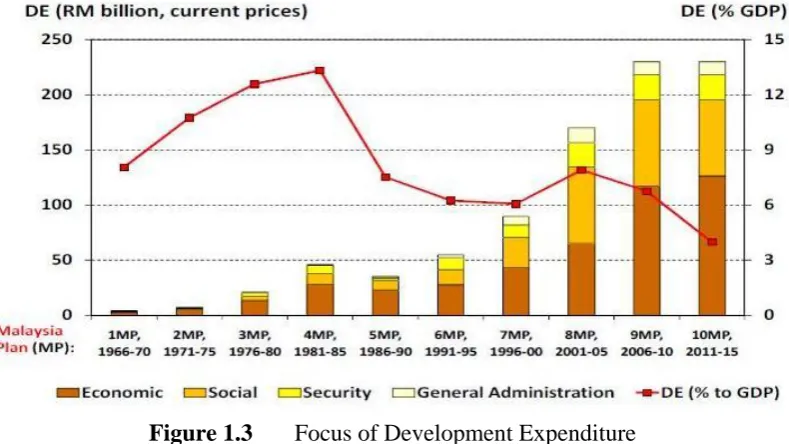
1.3 Focus of Development Expenditure 9
1.4 Transformation of Malaysia Economy (Adapted from Malaysia Innovation Model, 2009)
11
1.5 The Malaysia Innovation Model (Adapted from Malaysia Innovation Model, 2009)
13
1.6 Research Flow Chart 30
2.1 Evolution of Innovation Capabilities 1980-2000 34 2.2 Theory of Planned Behavior Application toward
Attitude of Green Practices
60
2.3 Conceptual Model towards Green Productivity Practices
61 3.1 Partial Least Square-Structural Equation Modeling 93
4.1 Measurement Model 116
4.2 Innovation Capability Dimensions 127
4.3 Competitive Performance Dimensions 128
4.4 Competitive Performance Dimensions with Testing Hypotheses
130
4.5 Moderating Effect for Competitive Performance Dimensions
4.6 Impact of Green Productivity on the Relationship between Innovation Capability and Competitive Performance
xvi
LIST OF ABBREVIATIONS
AMOS _ Analysis of Moment Structures
APO _ Asian Productivity Organization
ARE _ Asian Rare Earth
AVE _ Average Variance Explained
BCAC _ Raub Cyanide Action Committee
BSC _ Balanced Score Card
CP _ Competitive Performance
CR _ Composite Reliability
CRBV _ Contingent Resource Based View
DE _ Development Expenditure
DOE _ Department of Environment
DOSM _ Department of Statistics Malaysia
EPU _ Economic Planning Unit
FDI _ Foreign Direct Investment
FM _ Faculty of Management
GP _ Green Productivity
GTFS _ Green Technology Finance Scheme
HCM _ Hierarchical Component Model
IBM _ International Business Machines
IC _ Innovation Capability
IDs _ Identifications
IEA _ International Energy Agency
IP _ Innovation Performance
IPCC _ Intergovernmental Panels on Climate Change
LC _ Learning Capability
LCA _ Life Cycle Assessment
MFC _ Manufacturing Capability
MIDA _ Malaysian Investment Development Authority MIGHT _ Malaysia Industry Government Group for High
Technology
MKC _ Marketing Capability
MOSTI _ Ministry of Science, Technology and Innovation MPC _ Malaysia Productivity Corporation
MTDC _ Malaysian Technology Development Corporation Technology
OC _ Organization Capability
xviii PhD _ Doctor of Philosophy
PLS _ Partial Least Square
PLSc _ PLS Consistent
PLS-SEM
_ Partial Least Square-Structural Equation Modeling
PP _ Product Performance
RAC _ Resources Allocation Capability
RBV _ Resource-Based View
R&D _ Research and Development
RDC _ Research and Development Capability
RM _ Ringgit Malaysia
ROA _ Return on Assets
SMEs _ Small Middle Enterprises
SP _ Sales Performance
SPC _ Strategic Planning Capability
SPSS _ Statistical Package for Social Science
TCA _ Total Cost Assessment
TIC _ Technological Innovation Capability
TPB _ Theory of Planned Behaviour
UNEP _ United Nations Environment Programme
UNIDO _ United Nations Industrial Development Organization
UTM _ Universiti Teknologi Malaysia
xx
LIST OF APPENDICES
APPENDIX TITLE PAGE
A PhD Research Questionnaire 193
B PhD Research Questionnaire (In Malay Version) 203
C PhD Research Questionnaire (In Chinese Version) 214 D Items Coded with First and Second Hypothesis and
Their Related Sub- Hypothesis
223
E Items Coded with All Measurements 228
F Missing Values with Number and Percentage 231
G Paired Sample T-Test 233
H The Wilcoxon Test Statistics 235
I Histogram and Normal Q-Q Plots of the Variables 237 J Discriminant Validity Constructs after Removing
the Problematic Items (Cross Loadings)
241
K Discriminant Validity Constructs after Removing the Problematic Items (Fornell-Larcker)
242
CHAPTER 1
INTRODUCTION
1.1 Background of the Study
Global warming affects all of us and a clear evidence of its effects is climate change. The fourth and fifth Intergovernmental Panels on Climate Change (IPCC) have confirmed there is a 90% and 95% increase consecutively, that human activities and deforestation are probably the cause of the problem for the past 60 years (IPPC, 2007 & 2013). This indicates that human and illegal activities include rapid falling of forest trees, unlawful logging activities and excessive uses of natural fuels such as fuel, oil and gas. These have led to the extraordinary release of greenhouse gases especially carbon dioxide that has caused about 0.9°C
warming and partially offset by about 0.3°C cooling from human aerosol
change or not. The predicted effects of global warming by geographical regions have been released in the IPCC 2007 report that has confirmed the cause and effects of global warming, which have been identified for the future.
The United Nations Environment Programme (UNEP) 2012 reported the trend in global and sectoral greenhouse gas emissions from 1970 to 2010. For global emissions over the period, it showed an increase of 44%. Within the period, the highest increase of global emission was in 1990 with an increase of approximately 30%. This is followed by the period 2000-2010 when the rise of global emissions was about 20%. For sectoral emissions, the energy production and conversion had a 67% increase in the share of total emissions. The total greenhouse gas emissions inventories revealed a composition of 1.6% related carbon dioxide emission during the period of 2009 to 2010.
3
1.1.1 Manufacturing Sector
Manufacturing is undeniably an important sector for many countries especially for industrialized nations. This sector has prominently contributed in terms of its significant contribution to the economic development, and creation of enormous job prospects and employment opportunities. Figure 1.1 portrays Malaysia‘s growth rate of overall Gross Domestic Product (GDP), share of manufacturing sector to GDP, and share of Small Middle Enterprises (SMEs) to GDP from 2006 to 2011. This latest published statistics from the Economic Census 2011 is based on 2005 prices. Since 2006, the overall GDP has consistently superseded the average growth of the overall economy. Despite the negative performance in 2009, Malaysia has continued to maintain a favourable growth rate in 2010 and 2011. This same trend was followed by manufacturing GDP and SMEs GDP. This can be interpreted that GDP of manufacturing and SMEs directly affect the fluctuation of GDP‘s curve. Manufacturing sector indeed is very important and should not be ignored.
Figure 1.1 Annual Overall GDP Growth, Manufacturing GDP and SMEs GDP Growth (2006–2011)
5
Figure 1.1 confirms a decline of GDP in 2009. This was compensated with the Foreign Direct Investment (FDI) to Malaysia with an increase of investments from RM4.3 billion in 2009 as compared to RM28.2 billion in 2010 which is a drastic increase of 550% (MIDA, 2011). A major portion of 37.8% of the total investment of RM148.6 billion contributed to the investment in the manufacturing sector. The manufacturing sector is expected to remain as a major contributor to growth in the Malaysian economy. Comparatively, in 2011, Malaysia attracted significantly higher levels of investments in the manufacturing sector in comparison to 2010. The number of approvals in the manufacturing sector, included a total of 846 manufacturing projects with investments of RM56.1 billion were approved in 2011; whereas, in 2010, there were 910 manufacturing projects with a cumulative total investments of RM47.2 billion. Malaysia has been progressively attracting and continues to attract high levels of quality investments in the manufacturing sector in 2011. This is a clear indication and reflection of the on-going increase in investments reflecting the country‘s competitiveness (MIDA, 2011).
chemical, rubber and plastics. The second contribution of SMEs‘ manufacturing growth is food, beverages and tobacco, with the increase of the population, improvement of live style, longevity and well-being of human lives (MIDA, 2011).
Figure 1.2 Contributions of SMEs Manufacturing, 2006-2009 Source: Manufacturing Findings, Department of Statistic, 2006-2009.
7
the value-added growth of SMEs in the manufacturing sector expanded by 7.6% during the year, higher than the overall GDP growth for the manufacturing sector of 4.7%. Value-added growth of SMEs in the manufacturing sector expanded by 6% during the year, higher than the overall GDP growth for the manufacturing sector of 4.8% in 2012. With the increase of productivity and innovation, many manufacturing-based SMEs in Malaysia would welcome this study to explore and suggest better propositions for the SMEs in manufacturing. In many developed and developing countries, SMEs are the unsung heroes that bring the stability to the national economy (Ebrahim et al., 2011) and enhance the social benefits and potential economics such as job creation with low cost assets, positive contribution to the GDP, supportive plan for enterprises on a large scale, adaptation to market changes and flexibility, and contributing to market places which are less profitable for large companies (Sultan, 2007). In fact, the notion that the companies have truly benefited from these factors remain uncertain. The outcome and findings of an investigation would allow this study to explore and suggest the best ways for SMEs manufacturing to avoid some of the pitfalls.
1.1.2 The Case of Malaysia
Government Group for High Technology (MIGHT)—could ensure success for the brain gain policy and brain circulation strategies. In policy and strategies that have been tested by other competitor countries, Malaysians from overseas with tacit and experiential knowledge can leap across the stages in the technology trajectory of a product. Another failure of Malaysia for its low performance on innovation is due to weak institutions, trade balance in royalties and licensing fees and knowledge output. The weak institutions between university-industry linkages have become an issue when Malaysia has not followed up on the strong innovation output (scientific publications and patents) against the weak commercialisation of those results. Trade balance in royalties and licensing fees caused longer payments to be made against receipt received, and to produce net trade deficit indicated that Malaysia is a net technology and services importer. In short, the shortcomings of innovation in Malaysia are influenced by three factors: technology output, knowledge based workers, and innovation linkages and knowledge.
9
Figure 1.3 Focus of Development Expenditure Source: Economic Planning Unit, 2012
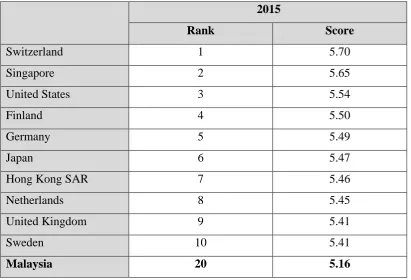
Table 1.1 : Malaysia Ranks 20th in the World Competiveness Scoreboard 2015: Malaysia and Top Ten Performers
2015
Rank Score
Switzerland 1 5.70
Singapore 2 5.65
United States 3 5.54
Finland 4 5.50
Germany 5 5.49
Japan 6 5.47
Hong Kong SAR 7 5.46
Netherlands 8 5.45
United Kingdom 9 5.41
Sweden 10 5.41
Malaysia 20 5.16
Source: World Competitiveness Yearbook 2015, IMD
11
From agricultural-based economy to resource-led economy, Malaysia has experienced a substantial economic transformation for 55 years. The transition in the 1980s and 1990s highlights more on production of three major raw materials: palm oil, tin and rubber. The primary driver of export growth which was one of the world leading electronic exporters is previously Malaysia‘s leading industrial sector in terms of investment, value added, exports and employment (MOSTI, Figure 1.4 Transformation of Malaysia Economy (Adapted from Malaysia Innovation Model, 2009)
2007). Vigorous growth with an average 6% of annual GDP was estimated for Malaysia. The growth is based on the availability of national resources of petroleum and commodities such as rubber, palm oil and manufacturing. In fact, the conventional growth for the vast land bank, cost competitive labour and capital and foreign investment lead to a positive leading growth. Years ago, this country experienced the dilemma whether it will continue to be an industrial nation in 2020 because of the emergence of two major competitor countries: India and China. These countries have competitive advantage over Malaysia by offering cheaper labour that affects foreign investors to set up their FDI here. It is no longer enough for Malaysia to be assemblers or expert practitioners with old methods. This would be the main overall disadvantage for the manufacturing economy and will definitely increase competitiveness due to non-availability of cheaper labour. As reported by MOSTI (2007), Malaysia intends to shift to innovation-based economy which must be accompanied with knowledge of know-how to innovate.
13
3 - 5 years
Science (Basic research)
Technology Take to
market
Technology Take to
market
Market Identified
Malaysia’s strategic market and positioning and niches
Market To Be Identified
10 - 15 years
3 - 5 years
Technology-driven Innovation
Market-driven Innovation
Technology Grant
Research Grant Risk
capital
Acquisition Risk capital
intensive countries such as China and India. This approach goes hand in hand with the National Innovation Model to enable green and economy growth. This is a sound overall framework for government policies to shape the environment for green innovation.
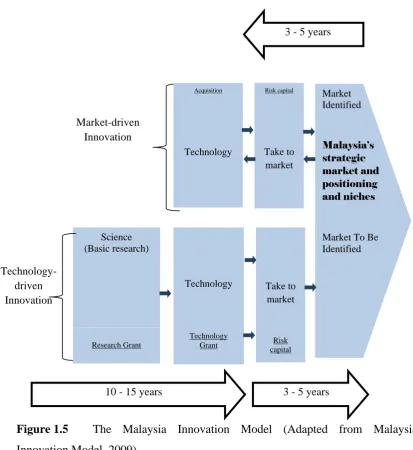
Figure 1.5 The Malaysia Innovation Model (Adapted from Malaysia Innovation Model, 2009)
1.1.3 The Balance Approach
The balance approach of technology and market-driven innovation based on innovation-led growth was launched in 2007. For technology-driven model, scientists are supported with financial sources in term of research and technology grants. Figure 1.5 shows that the basic research in science and technology will be carried out for 10 to 15 years. Within this period, the approach is to concentrate and encourage merit-based allocation of funding among public research institutions and meet of the national technology needs and security. Eventually, after the basic research phase which takes 3 to 5 years to be exposed to risk capital, private sectors use that technology as a tool to create products and services. Once the market is identified, innovative entrepreneurs are going to enhance their best knowledge of science and technology to fulfil the selected market in the market-driven innovation model. This model has aggressively positioned itself and filled the niche of the identified market to capture short-to-medium term opportunities from 3 to 5 years for value creation. Therefore, public and private sector should actively collaborate with the National Coordination Task Force to implement the framework including the portfolio of incentives needed for risk mitigation. These two-driven models were regarded by Porter (1990) as organization success and competitiveness by investing innovation.
1.2 Problem Statement
Among the 141 countries, Malaysia‘s position was ranked at 32nd
15
and performing R&D is noteworthy. Malaysia has been enthusiastic and good at adopting the latest knowledge technologies, clearly demonstrated by its 6th ranking in Knowledge Absorption, and this is driven by high-tech imports where Malaysia is ranked 1st, However, for the Creativity Outputs, Malaysia is ranked 42nd place. The top ten countries in the Global Innovation Index 2012 are dominated by developed economies, namely, Switzerland, Sweden and Singapore. These top countries have scores of 68.2, 64.8 and 63.5 respectively; followed by Finland, United Kingdom, Netherlands, Denmark, Hong Kong, Ireland and the United States. Therefore, Malaysia‘s efforts to accomplish the score of the innovation levels from 2007 to 2012, was not even within the range by the top twenty performers. This illustrates that some countries, are very inefficient in comparison to other foreign countries which have stronger innovation linkages to global growth.
and they classified this functional approach of IC dimensions into seven dimensions: learning capability, research and development capability, resources allocation capability, manufacturing capability, marketing capability, organization capability and strategic planning capability. The purposively chosen seven dimensions of IC concept are based on several articles (Guan & Ma, 2003; Yam et al., 2004 & 2010; Guan et al., 2006; Tseng et al., 2012) that summarize different elements to interact as a diverse structure with multi-dimensions and IC has the leading advantage in the firms‘ competitions (Wang et al., 2008).
Decision is needed on whether manufacturers understand Green Productivity (GP) practices and are alert to the basic merits of this practice. Consequently, an essential part of the strategic planning for GP practices could be judged in boosting productivity and accessing environmental issues for building economic and social factors. Regarding APO (2009), GP practices can be applied in manufacturing, service, agriculture and communities. Avishek (2008) confirmed GP practices as a strategy to increase both productivity and environmental performance so that the overall social and economic improvement leads to sustained improvement in the quality life for human beings. They admitted that the traditional methods of increasing productivity are not eco-friendly and the pollution control measures were not optimal for sustainable environmental protection.
17
process of production. Although it has only been a decade since Asian Rare Earth (ARE) factory began production in Bukit Merah, the effects of radiation are found in the community who saw a sharp rise in the cases of infant deaths, congenital disease, leukaemia and lead poisoning (Humayun, 2012). The second case is the Raub Australian Gold Mining Sdn Bhd which started operating its Carbon in Leach gold refinery plant. The Pahang Raub Ban Cyanide in Gold Mining Action Committee (BCAC) recognized and verified that the people of Bukit Koman in Raub have been suffering from disabling skin, eye and respiratory diseases which can be attributed to the polluting fumes including Hydrogen Cyanide and Sulphur Dioxide emitted from the gold mine located at a mere 50 meters from the Bukit Koman Village. However, this situation is illogical for developing countries which created environmental regulations such as Environmental Quality Act 1974, Clear Air Regulations 1978, Scheduled Wastes Regulations 1989 but they are not actually enforcing them. By having more rules and regulations against environment concerns, companies now should include strategic planning to adapt customer with the environmental demand and need (Walton et al., 1998). Nevertheless, companies such Asian Rare Earth Factory and Raub Australian Gold Mining Sdn Bhd did not practise GP, and their operational performance and business survival have not been affected. On the other hands, Porter and Van (1995) described the value that corporations produce for his or her customers that exceeded the cost of producing that value, thus being environmental sensitive is going to formulate competitive analysis to enhance the positioning power of companies in the international markets. Additionally, this study disclosed that GP practices have no conflict on the interest of company especially SMEs to crucially understand the increasing environmental and economic importance that would enhance the competitive power of companies in the international markets.
do not view environment as an issue or a responsibility to address (Condon, 2004; Revell & Blackburn 2004; Studer et al., 2005). The worst perspective is not having knowledge about environmental problems in the present and future (Tilbury et al., 2005) or no particular methods to solve this issue (Walker et al., 2007). The question of this environment dilemma is the SMEs owners or managers‘ expertise to assure that they are doing the right thing since environment is not their main business activity (Redmond et al., 2008). Educational program provided is promised with green benefits, problems and risks (Revell & Rutherfoord, 2003). Eventually, they do not see the relationship between their businesses with green impact or they consider it too expensive to maintain green corner (McKeiver & Gadenne, 2005; Bustamante & Jennings, 2006; Lekas, 2006; Nutek, 2003; Bubna et al., 1999). In similar studies, Ramayah et al. (2013); Yacob and Moorthy (2012); and Logaa and Suhaiza (2013) assessed the close study of the interaction factors among SMEs‘ characteristics, resources given, and knowledge of SMEs manager or owners to agree with green concepts. Therefore, the extensive concerns are for manager or owners of SMEs to undertake the fundamental merits between IC, GP and SMEs. The study of IC with green practice has been evaluated by Lin et al. (2011) who showed an effective method for identifying position strategic competitiveness of green business innovation. In this study, IC with functional approach works well with GP in which business functional structure has a clear responsibility for the employees with a specialised or similar set of roles or tasks. Handling green practices will make the company understand which group of employees fall behind in such practices and needs to compete for a better performance. With IC, this study is in fact using functional approach instead of process and product approach. The approach is simple and easily understood due to the similarity that most SMEs business has functional structure with IC functional approach. When GP practices are applied on the SMEs, they seemed to be efficient and are feasible for integrating GP into each variable to compete better in the marketplace.
19
organizational performance. Tangen (2003) claims that performance should be based on competitiveness and profitability of business. Van-Schalkwyk (1998) also emphasises financial factors to measure performance such as profit, productivity and return of investment. In this study, three performance indicators were found to be appropriate: sales performance, innovation performance and product performance presented in the theoretical framework. This study measured average sales and non-sales growth collected for the years 2009 to 2012. The financial and operational measurements on green growth on SMEs manufacturing have been confirmed by Ramayah et al. (2013).
This study adopted Yam et al. (2010) model to detect and monitor a firm‘s competitive performance (dependent variable) of an organization with a set of key variables (independent variables). Numerous studies have established the link between IC with a firm‘s performance; however Malaysia SMEs manufacturing industry has deeply neglected GP practices to develop a deeper understanding of IC—firm competitive performance.
1.3 Research Questions
1. Which are the important dimensions of IC on a firm‘s competitive performance for manufacturing SMEs in Malaysia?
2. Which are the important dimensions of IC on sales, innovation and product performances for manufacturing SMEs in Malaysia?
3. What is the moderating role of GP practices in IC—firm competitive performance relationship for manufacturing SMEs in Malaysia?
4. What is the moderating role of GP practices in IC—sales performance relationship, IC—innovation performance relationship and IC—product performance relationship for manufacturing SMEs in Malaysia?
To answer the research questions, researcher chose 88 SMEs manufacturing firms in Malaysia. All of these firms are reputable in SMEs manufacturing sector and may have initiated the GP practices concept. The following research objectives have been articulated to address these research questions.
1.4 Research Objectives
The main objective of this study is to determine unexplored effects of IC in terms of individual and collective constructs on a firm‘s performance in Malaysian SMEs manufacturing firms and identify the moderating impact of GP practices and contextual variables in the relationship. The study focussed on the four following objectives:
1. To identify important dimensions of IC on a firm‘s competitive performance
21
3. To find out the moderating role of GP practices in IC—firm competitive performance relationship.
4. To assess the moderating role of GP practices in IC—sales performance relationship, IC—innovation performance relationship and IC—product performance relationship.
To illustrate these various relationships, the model in Figure 2.3 formulates the relationship among all of the three factors: IC, GP practices and CP. The objective of the dimensions in IC is linked to a sustainable firm‘s competitive performance in the future.
1.5 Significance of the Study
Academically, this study first applied the current theoretical developments in IC towards a firm‘s competitive performance (Yam et al., 2004). The researchers conducted empirical test from Yam (2004) in a different business environment that is critical for enhancing understanding whether the existing theories are cross culturally valid. This study contributes to the body of knowledge by addressing the role of IC towards a firm‘s competitive performance in management department in a Malaysian setting. This study adds to the body of knowledge by addressing the gaps in GP practices as stated in the literature by assessing the association between IC and firm‘s competitive performance, unlike previous studies which emphasised more on the examination of the effect of IC without GP practices. Finally, the significance of this study is also critical in a way to show association of IC from different dimensions in relation to GP practices as recommendation for a theory. This is because the collective and individual measures of these IC dimensions for the selected dimensions provide a basis for improvement in GP practices. For future researchers, the findings of this study may be useful as a reference when they desire to perform a study in same field.
23
In the government policy development, other developed nations were surprised when the Malaysian government proposed to deal with green issues in the 2014 budget that was announced by Malaysia to critically strengthen the promotion of GP practices and green technology or green innovation (MOF, 2013). However, lack of effective cooperation and mutual understanding between government and the industry has resulted in the poor take up rate of this government assistance (Ng & Thiruchelvam, 2012). Through this study, government fosters its efforts to build effective government—private partnership with SMEs manufacturing have resulted in active exchange of information which illustrates IC dimensions for the implementation of GP practices toward gaining firm competitive performance. Based on this process, IC and GP practices are the two recognisable issues that firms should be imposed in the near future. This study relates government agencies and the trade or industry associations, develops awareness programmes needed to be undertaken on a regular basis to update the industry on the latest incentives, financial assistance, and grants that the government provides. As a result, once concepts and results of IC with GP practices are rectified, policy makers could adopt the justified environmental strategies in forming government policy to guide companies in the right direction.
1.6 Research Scope
This study focussed on the existing theories of independent variables of IC on dependent variable of firm competitive performance. More specifically, this study investigated GP practices as a moderator to be tested on the IC—firm‘s competitive performance link. This study employed a cross sectional approach that examined the proposed variables relationships in a constant manner, as data is designed to look at a variable at a particular point in time (Aric et al., 2007). However, the proposed relationships among the model variables are dynamic and tend to change over time. This study used a single informant approach for each company. The reliability of a single informant is contestably questionable, and may possibly result in perceived differences of the company‘s extent of using IC across various units within the company (Elizabeth & Gary, 1992). This study also gauged the GP implementation level of which IC dimension shows the importance and how it affects performance within same organizations after analysis of the results from the questionnaire survey and interview sessions. Findings from this research can discover valuable insights from the IC with GP practices which will contribute to the success of this study. This research has limited its scope to only seven dimensions of IC with functional approach (Yam et al., 2004). Follow up analysis will also be conducted for evaluations of separate GP effects of each IC‘s dimension on a firm‘s competitive performance.
25
and experience required to handle environment issues (Ghazilla et al., 2015; DOE, 2011). In fact, the environmental performance of SMEs manufacturing sector is mostly driven by the intention of the company owners who are forced to focus on survival rather than sustainability (Yacob et al., 2013). On another note, a slight improvement in the environmental effort in this sector would give a substantially high environment global rating scale because this manufacturing sector creates more waste than service and agricultural sectors (DOSM, 2011). GP practices must be included into IC for SMEs to boost productivity by connecting green concerns to intensify GDP. If these SMEs manufacturing industries have developed the right approach by introducing IC with GP practices, it will advance them towards gaining sustained competitive advantage.
1.7 Research Limitations
As a comparison to previous studies, further studies are needed to investigate the findings of this study in relation to other manufacturing industries and other industries. Secondly, due to the confidentiality of some resources in the selected organizations in the SMEs manufacturing sector, the researcher may not have full access to all the required information. There are several constraints that have created slight deviations in getting ideal results. For example, time, money, geography and workforce were the major limiting factors during the study. Since interviews were conducted by replying qualitative perceptions, there were some biases and probabilities in individual‘s perception in comparison to others.
that the functions were grouped under IC, it is possible that one of the functions in the group could have implemented more green business practices than another function, thereby possibly influencing the final results. Majority of the respondents are managers or owners who might have different perceptions regarding the impact of GP practices implementation on their firm‘s competitive performance.
This study is based on a single respondent. To improve the quality and reliability of the data, it is better to have different respondents for dependent and independent variables. The theoretical model excludes some potentially important factors. It seems plausible that the adoption of GP strategy may be a significant factor stimulating IC. It would be informative to examine whether these findings would hold true in a creative context in which knowledge innovation is largely presented.
1.8 Operational Definitions
As Sekaran (2003) explained, an operational definition looks at the behavioural dimensions, facets, or properties indicated by the concept by specifying the operations necessary to measure it. The specific operational definitions are provided for seven major variables used in this study that need to be understood in developing comprehension of the research in the future. The operational variables and operationalized definitions are to be used to avoid any ambiguity within the context of this study. These constructs are defined according to the requirements of this research.
27
organization capability and strategic planning capability (Yam et al., 2004 & 2010; Guan et al., 2003 & 2006; Zandhessami et al., 2012; Tseng et al., 2012).
Learning Capability (LC): Learning capability is labelled for work teams to identify opportunities for improvement and adopt knowledge in their daily activities (Yam et al., 2004 & 2010; Guan et al., 2003 & 2006; Zandhessami et al., 2012; Tseng et al., 2012).
R&D Capability (RDC): R&D capability refers to high quality mechanism feedback from manufacturing to design, and engineering or product development into technological innovation process (Yam et al., 2004 & 2010; Guan et al., 2003 & 2006; Zandhessami et al., 2012; Tseng et al., 2012).
Resources Allocation Capability (RAC): Resources allocation capability is attached to adequate financial, human resources in phases for a firm‘s functional department to carry out the innovation activity and process (Yam et al., 2004 & 2010; Guan et al., 2003 & 2006; Zandhessami et al., 2012; Tseng et al., 2012).
Manufacturing Capability (MFC): Manufacturing capability is to transform advanced manufacturing methods, and R&D outcomes for a firm with the ability to produce (Yam et al., 2004 & 2010; Guan et al., 2003 & 2006; Zandhessami et al., 2012; Tseng et al., 2012).
Organization Capability (OC): Organization capability is for a firm with dynamic structure to coordinate among departments with excellent practices for management (Yam et al., 2004 & 2010; Guan et al., 2003 & 2006; Zandhessami et al., 2012; Tseng et al., 2012).
Strategic Planning Capability (SPC): Strategic planning capability enables one to identify internal strengths and weaknesses, and external opportunities and threats to a firm‘s goal and plans to be adapted to respond to the firm‘s actions (Yam et al., 2004 & 2010; Guan et al., 2003 & 2006; Zandhessami et al., 2012; Tseng et al., 2012).
Green Productivity (GP) Practices: GP practices are methods to minimize waste by decreasing hazardous and toxic materials, and complying with the environmental friendly packaging to fulfil to any certification with collaboration from customers (APO, 2009).
Competitive Performance (CP): Competitive performance is measured based on the scales of sales and innovation performance applied by a single item while the product performance was used by multi-items (Yam et al., 2004 & 2010; Guan et al., 2003 & 2006).
Sales Performance (SP): Sales performance is measured by calculating the average annual sales growth rate over the last 3 years due to technological new or improved product with/without green productivity practices (Yam et al., 2004 & 2010; Guan et al., 2003 & 2006; Zandhessami et al., 2012; Tseng et al., 2012).
29
the products of the company over the last 3 years with/without green productivity practices (Yam et al., 2004 & 2010; Zandhessami et al., 2012; Tseng et al., 2012).
Product Performance (PP): Product performance is measured by considering the levels of quality products, basic expenses of such product, the frequent market competition of related product, the nature and type of process technology employed and the mean time from concept to actualise the product (Yam et al., 2004 & 2010; Guan et al., 2003 & 2006; Zandhessami et al., 2012; Tseng et al., 2012).
1.9 Structure of Thesis
limitations, recommendation arising from this research and future directions in Malaysia.
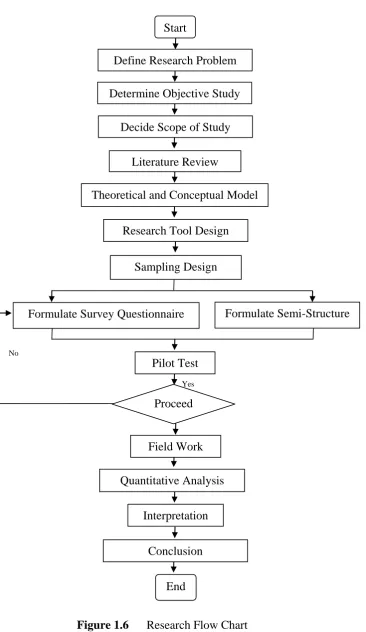
Figure 1.6 Research Flow Chart Yes
No
Start
Define Research Problem Determine Objective Study
Decide Scope of Study Literature Review
Theoretical and Conceptual Model Research Tool Design
Sampling Design
Formulate Survey Questionnaire Formulate Semi-Structure Interview
Pilot Test
Field Work Quantitative Analysis
Interpretation Conclusion
REFERENCES
Acs, Z. J., & Audretsch, D. B. (1990). Innovation and small firms. Cambridge, MA: MIT Press.
Adams, G. R., & Schvaneveldt, J. D (1991). Understanding research methods. 2nd Ed. New York: Longman.
Adler, N., & Shani, A. B. (2001). In search for an alternative framework for the creation of actionable knowledge–table-tennis research at Ericsson. In: Pasmore, W., & Woodman, R.W. (Eds.). Research in Organizational Change and Development. Elsevier Science, Amsterdam, 43-79.
Adler, P. S., & Shenbar, A. (1990). Adapting your technological base: the organizational challenge. Sloan Management Review, 25, 25-37.
Aemer, A. M. (2005). Supplier evaluation and selection: a comprehensive model to minimize the risk associated with quality and delivery. PhD. The University of Tennessee, Knoxville, USA.
Ajzen, I. (1991). The theory of planned behavior. Organizational Behavior and Human Decision Processes, 50, 179-211.
Akgun, A. E., Keskin, H., Byrne, J. C., & Aren, S. (2007). Emotional and learning capability and their impact on product innovativeness and firm performance. Technovation, 27, 501-513.
Akman, G., & Yilmaz, C. (2008). Innovative capability, innovation strategy and market orientation: an empirical analysis in Turkish software industry. International Journal of Innovation Management, 12(1), 69-111.
Alves, A. C., Zen, A. C., & Padula, A. D. (2011). Routines, capabilities and innovation in the Brazilian wine industry. Journal of Technology Management and Innovation, 6(2).
Welch (Eds.), Handbook of Qualitative Research Methods for International Business. Cheltenham: Edward Elgar.
Anderson, E., & Weitz, E. (1989). Determinants of continuity in conventional Industrial channel dyads. Marketing Science, 8(4), 310- 323.
Anthony, G. (2011). Radiasi di Malaysia dan Penapisan Rare Earth. Retrieved from: http://www.geosyntec-asia.com.my/
Amabile, T. M., Conti, R., Coon, H., Lazenby, J., & Herron, M. (1996). Assessing the work environment of creativity. Academy of Management Journal, 39(5), 1154-1184.
APO (Asian Productivity Organization), (2009). Eco-Products Directory 2004. Asian Productivity Organization, Tokyo.
Aric, R., Alan, J. M., Shankar, G., & Christine, M. (2007). Cross-sectional versus longitudinal survey research: concepts, findings, and guidelines. Institute for the Study of Business Markets. The Pennsylvania State University 484 Business Building University Park, PA, USA.
Ariffin, N., & Figueiredo, P. N. (2004). Internationalization of innovation capabilities: counter-evidence from the electronics industry in Malaysia and Brazil. Oxford Development Studies, 32(4), 559-583.
Assink, M. (2006). Inhibitors of disruptive innovation capability: a conceptual model. European Journal of Innovation Management, 9(2), 215-233.
Ates, A., & Bititci, U. (2011). Change process: a key enabler for building resilient SMEs. International Journal of Production Research, 49(18), 5601-5618. Atoche, C. (2007). Capability lifecyles: an insight from the innovation capability
evolution in emerging economies. Cladea’s Annual Assembly 2007, 1-10. Avishek, N. P. (2008). Landscape ecological mapping: a tool towards green
productivity. Ecocity World Summit 2008 Proceedings.
Azevedo, S. G., Carvalho, H., & Machado, V. C. (2011). The influence of green practices on supply chain performance: a case study approach. Transportation Research Part E 47, 850-871.
Babbie, E. (2009). The practice of social research (12th ed.). Belmont, CA: Wadsworth.
Bagozzi, R. P., & Yi, Y. (1998). On the evaluation of structural equation models. Journal of the Academy of Marketing Science, 16(1), 74-94.
159
Barbour, R. R. (2008). Introducing qualitative research: a student guide to the craft of doing qualitative research. London: Sage.
Barclay, D., Higgins, C., & Thompson, R. (1995). The partial least squares (PLS) approach to casual modeling: personal computer adopting and use as an illustration. Technology Studies, 2(2), 285-309.
Barney, J. B. (1991). Firm resources and sustained competitive advantage. Journal of Management, 17(1), 99-120.
Barney, J. B. (2001). Is the resource-based "view" a useful perspective for strategic management research? Yes. Academy of Management Review, 26(1), 41-56.
Baron, R. M., & Kenny, D. A. (1986). The moderator-mediator variable distinction in social psychological research: conceptual, strategic, and statistical considerations. Journal of Personality and Social Psychology, 51(6), 1173. Barreto, I. (2010). Dynamic capabilities: a review of past research and an agenda
for the future. Journal of Management, 36, 256-280.
Bearden, W. O., Sharma, S., & Teel, J. E. (1982). Sample size effects on chi-square and other statistics used in evaluating causal models. Journal of Marketing Research, 19, 425-430.
Bentler, P. M. (2006). EQS 6 Structural equations program manual. Encina, CA: Multivariate Software, Inc.
Bertrand, O. (2009). Effects of foreign acquisitions on R&D activity: evidence from company-level data for France. Research Policy, 38(6), 1021-1031. Bogdan, B., & Villiger, R. (2008). Valuation in life sciences: a practical guide.
Springer.
Bollen, K. A. (1990). Overall fit in covariance structure models: two types of sample size effects. Psychological Bulletin, 107(2), 256-259.
Bontis, N. (2001). Assessing knowledge assets: a review of the models used to measure intellectual capital. International Journal of Management Reviews, 3(1), 41-60.
Burgelman, R., Maidique, M. A., & Wheelwright, S. C. (2001). Strategic Management of Technology and Innovation. McGraw-Hill, New York, 10-14.
Briand, G., & Hill, R. C. (2012). Using excel 2007 for principles of econometrics (4th ed.) New York: John Wiley and Sons, Inc.
Brush, T. H., & Artz, K. W. (1999). Toward a contingent resource-based theory: the impact of information asymmetry on the value of capabilities in veterinary medicine. Strategic Management Journal, 20(3), 223-250.
Bryman, A. (2008). Social research methods (3rd ed.). Oxford: Oxford University Press.
Bryman, A., & Bell, E. (2007). Business research methods (2nd ed.). Oxford: Oxford University Press.
Bubna-Litic, K., & De-Leeuw, L. (1999). Adding the green advantage: a survey of Australian SME‘s, research report. Retrieved from http://www.ecobusiness.com.au/sme/survey.pdf.
Bueno, E., & Ordonez, P. (2004). Innovation and learning in the knowledge based economy: challenges for the company. International Journal of Technology Management, 27(6/7), 531-533.
Bustamante, L., & Jennings, S. (2006). Regional greenhouse gas abatement - business program; stage 3: local centres pilot project. Southern Metropolitan Regional Council, WA.
Byrne, B. (2004). Researching society and culture. SAGE Publications Ltd, London.
Byrne, B. M. (2010). Structural equation modelling with AMOS: basic concepts, applications and programming. Mahwah, New Jersey: Erlbaum.
Cairncross, F. (1992). Costing the earth. Boston: Harvard Business School Press. Calantone, R. J, Cavusgil, S. T., & Zhao, Y. (2002). Learning orientation, firm
innovation capability, and firm performance. Industrial Marketing Management, 31, 515-524.
Camison, C., & Villar-Lopez A. (2012). Organizational innovation as an enabler of technological innovation capabilities and firm performance. Journal of Business Research, doi:10:10.1016/j.jbusres.2012.06.004.
161
Canals, J. (2001). How to think about corporate growth? European Management Journal, 19(6), 587-603.
Carolyn, B., & Palena, N. (2006). Conducting in-depth interviews: a guide for designing and conducting in-depth interviews for evaluation input. Pathfinder International, USA.
Cavana, R. Y., Delahaye, B. L., & Skearan, U. (2001). Applied business research: qualitative and quantitative methods. Queensland Australia: John Wiley & Sons Australia Ltd.
Cavusgil, S. T., Calantone, R. J., & Zhao, Y. (2003). Tacit knowledge transfer and firm innovation capability. Journal of Business & Industrial Marketing, 18(1), 6-21.
Cenfetelli, R. T., & Bassellier, G. (2009).The analysis of formatively measured constructs in IS research: choosing between PLS and covariance-based techniques, working paper 09-MIS-002, University of British Columbia. Chandy, R. K., & Tellis, G. J. (2000). The incumbent‘s curse? Incumbency, size
and radical product innovation. Journal of Marketing, 64(3), 1-17
Charles, S. (2012). Government fails to learn from bukit merah tragedy. Available from: http://wargamarhaen.blogspot.com/2012/02/govt-fails-to-learn-from-bkt-merah.html.
Chau, P. Y. K., & Hu, P. J. E. (2001). Information technology acceptance by individual professionals: a model comparison approach. Decision Sciences, 34(4), 699-719.
Chang, S., & Lee, M. S. (2008). The linkage between knowledge accumulation capability and organizational innovation. Journal of Knowledge Management, 12(1), 3-20.
Chen, C. J. (2009). Technology commercialization, incubator and venture capital and new venture performance. Journal of Business Research, 62(1), 93-103. Chen, C. L., & Jaw, Y. L. (2009). Building global dynamic capabilities through
innovation: a case study of Taiwan‘s cultural organizations. Journal of Engineering and Technology Management, 26(4), 247-263.
Chen, M. H., & Yang, Y. J. (2009). Typology and performance of new ventures in taiwan. A model based on opportunity recognition and entrepreneurial creativity. International Journal of Entrepreneurial Behaviour & Research, 15(5), 398-414.
Chen, Y. S., Lai, S. B., & Wen, C. T. (2006). The influence of green innovation performance on corporate advantage in Taiwan. Journal of Business Ethics, 67(4), 331-339.
Chen, Y. S. (2008). The driver of green innovation and green image – green core competence. Journal of Business Ethics, 81(3), 531-543.
Cheng, Y. L., & Lin, Y. H. (2012). Performance evaluation of technological innovation capabilities in uncertainty. Procedia – Social and Behavioural Sciences, 40, 287-314.
Chesbrough, H. W., & Appleyard, M. M. (2007). Open innovation and strategy. California Manage, 50(1), 57-75.
Chiesa, V., Coughlan, P., & Voss, C. A. (1996). Development of a technical innovation audit. IEEE Engineering Management Review, 26(2), 64-91. Chin, W. W. (1998). The partial least squares approach for structural equation
modeling. George A. Marcoulides Ed.: Lawrence Erlbaum Associates. Chin, W. W. (2010). How to write up and report PLS analyses. Handbook of
Partial Least Squares, 655-690: Berlin Heidelberg: Springer-Verlag.
Chin, W. W., Marcolin, B. L., & Newsted, P. R. (2003). A partial least squares latent variable modeling approach for measuring interaction effects: results from a Monte Carlo Simulation study and an electronic-mail emotion/adoption study. Information Systems Research, 14(2), 189-217. Chin, W. W., & Todd, P. A. (1995). On the use, usefulness, and ease of use of
structural equation modeling in MIS research: a note of caution. MIS Quarterly, 19(2), 237-246.
Christensen, J. F. (1995). Asset profiles for technological innovation. Research Policy, 24, 727-745.
Christensen, C. M. (2001). Assessing your organization‘s innovation capabilities. Leader to Leader Journal, 21, 27-37.
163
Churchill, G. A. J. (1979). A paradigm for developing better measures of marketing constructs. Journal of Marketing Research, 16, 64-73.
Churchill, G. A. (1995). Marketing research methodological foundation (6th ed.). Orlando, Florida: The Dryden Press.
Clayton, T., & Turner, G. (1998). Brands, innovation and growth. In: Tidd, J., Bessant, J., Pavitt, K. (Eds.), Managing innovation: integrating technological, market and organizational change (2nd ed). Wiley, New York.
Coakes, S. J. (2006). SPSS: Analysis without anguish: version 14.0 for windows. Milton, Qld: John Wiley & Sons.
Cohen, J. (1988). Statistical power analysis for the behavior sciences (2nd ed.). Hillsdale, NJ: Lawrence Erlbaum Associates.
Cohen, W. M., & Levinthal, D. A. (1990). Absorptive capacity: a new perspective on learning and innovation. Administrative Science Quarterly, 35(1), 128-152.
Colarelli O‘Connor, G. C. (2008). Major innovation as a dynamic capability: a systems approach. Journal of Product Innovation Management, 25(4), 313-330.
Cole, M. (2006). Qualitative research: a challenging paradigm for infection control. British Journal of Infection Control, 7(6), 25-29.
Condon, L. (2004). Sustainability and small to medium sized enterprises-how to engage them. Australian Journal of Environmental Education, 20(1), 57-67. Cooper, R. G. (1996). Overhauling the new product process. Industrial
Marketing Management, 25, 465-482.
Cooper, R. D., & Schindler, S. P. (2013). Business Research Methods (12th Ed.). Singapore: McGraw Hill/Irwin.
Creswell, J. W. (2009). Research design: qualitative, quantitative and mixed methods approaches (3rd ed.). Thousand Oaks, CA: SAGE Publications. Cronbach, L. J. (1951). Coefficient alpha and the internal structure of tests.
Psychometrika, 16(3), 297-334.
Crook, R. T., Ketchen Jr., D. J., Combs, J. G., & Todd, S. Y. (2008). Strategic resources and performance: a meta-analysis. Strategic Management Journal, 29, 1141-1154.
Dawson, J. F. (2013). Moderator in mangement research: what, why, when, and how. Journal of Business and Psychology,1-19.
Daymon, C., & Holloway, I. (2002). Qualitative research methods in public relations and marketing communications. London: Routledge.
Deeds, D. L., & Decarolis, D. (1997). The impact of timing and firm-specific capabilities on the amount of capital raised in an initial public offering: evidence from the biotechnology industry. Journal of Business Venturing, 12(1), 31-46.
DeNardo, A. M. (2007). Using Nvivo to analyze qualitative data. Retrieved from http://www.education.duq.edu/institutes/pdf/../DeNardo&Levers. Denscombe, M. (2006). Web-based questionnaires and the mode effect: an
evaluation based on completion rates and data contents of near-identical questionnaires delivered in different modes. Social Science Computer Review, 24, 246-254.
Denzin, N. K. (1978). The research act. New York: McGraw Hill.
Deutskens, E. (2006). An assessment of equivalence between online and mail surveys in service research. Journal of Service Research, 8, 346-355.
Dhewanto, W., Prasetio, E. A., Ratnaningtyas, S., Herliana, S., Chaerudin, R., Aina, Q., Bayuningrat, R. H., & Rachmawaty, E. (2012). Moderating effect of cluster on firm‘s innovation capability and business performance: a conceptual framework. Social and Behavioral Sciences, 65, 867-872. Diamantopoulous, A., Riefler, P., & Roth, K. P. (2008). Advancing formative
measurement models. Journal of Business Research, 61(12), 1203-1218. Diamantopoulos, A., & Winklhofer, H. (2001). Index construction with formative
indicators: an alternative to scale development. Journal of Marketing Research, 38(2): 269-277.
Dierickx, I., & Cool, K. (1989). Asset stock accumulation and sustainability of competitive advantage. Management Science Journal, 35, 1504-1511. DOE (Department of Environment), 2011. Air pollution control information.
165
Doole, I., Grimes, T., & Demack, S. (2006). An exploration of the management practices and processes most closely associated with high levels of export capability in SMEs. Marketing Intelligence and Planning, 24, 632-647. DOSM (Department of Statistics Malaysia), 2010. Manufacturing findings 2010.
Retrieved from http://www.statistics.gov.my.
DOSM (Department of Statistics Malaysia), 2011. Malaysia economic statistics 2011. Retrieved from http://www.statistics.gov.my.
Drucker, P. (2006). Innovation and entrepreneurship. Harper and Row, New York. Duarte, P. A. O., & Raposo, M. L. B. (2010). A PLS model to study branch
preference: an application to the mobile phone market. Handbook of partial least squares. Springer, 449-485.
Easterby, S. M., Thorpe, R., & Jackson, P. R. (2008). Management research. London: Sage Publication.
Ebrahim, N. A., Ahmed, S., Rashid, S. H. A., Wazed, M. A, & Taha, Z. (2011). Virtual collaborative R&D teams in Malaysia manufacturing SMEs. The Second International Conference on Mechanical, Industrial and Manufacturing Technologies.
EPU (Economic Planning Unit), (2012). The Ma