ABSTRACT
WILLIAMS, MITCHELL. Corn Pollination and Yield As Influenced by Weed Density and Row Pattern. (Under the direction of Dr. Ronnie Heiniger)
Weeds and their management continue to be important in optimizing corn (Zea mays L.) yield. Cultural practices such as planting date, cultivar selection, and row pattern/plant population can affect weed interference with corn. Twin-row plantings (rows spaced 20 cm apart on 36-cm centers) could reduce weed interference by closing the canopy more quickly than single rows. The interaction of row pattern has not been thoroughly evaluated in LibertyLink® or Roundup Ready® systems. The role of weed population, as influenced by herbicide program, on silking and quality characteristics associated with corn ears also has not been evaluated. Therefore, research was conducted to determine weed control and corn response to interactions of herbicide resistant trait (HRT) and the appropriate herbicides used on these hybrids when grown in single and twin row planting patterns on the coastal plain of North Carolina.
The experiment was conducted in eastern North Carolina during 2011 and 2012. Corn was planted in conventionally-prepared raised beds spaced 91-cm apart. In 2011 glufosinate-resistant (LibertyLink®) and glyphosate-resistant (Roundup Ready®) hybrids were planted in single rows or twin rows (20-cm spacing on 91-cm centers) in mid-April. Within each HRT and planting pattern combination, S-metolachlor was applied
cultivar expressing resistance to both glufosinate and glyphosate. Corn was 25 to 36 cm in height when herbicides were applied. Visible estimates of percent common ragweed (Ambrosia artemisiifolia L.) control were determined 3 weeks after POST application. Density of common ragweed was also determined 3 and 6 weeks after POST herbicides were applied. In addition to corn yield, yield components and number of days from planting to silk emergence were determined. Data for common ragweed density and visible control, corn grain yield, corn height, corn ear type (complete, incomplete, nubbin, and blunt), and days from planting to silk emergence were subjected to ANOVA appropriate for the factorial treatment structure and means were separated using Fisher’s Protected LSD test at p ≤ 0.05. Pearson Correlation Coefficients were determined for weed population and visible control vs. corn parameters at p ≤ 0.05.
The interaction of HRT, herbicide program, and planting pattern was not
significant for common ragweed population, visible control, or any of the measurements associated with corn. The interaction of HRT and herbicide program also was not
significant for weed population or control and corn growth. These data suggest that under conditions of this experiment and with common ragweed, twin row planting patterns offer no advantage to single row patterns when the total corn population per unit area is the same. Also, lack of an interaction of HRT and herbicide program suggests that both glufosinate and glyphosate are equally effective when applied in their appropriate herbicide-resistant hybrid for this weed. Although the main effect of HRT was
Corn Pollination and Yield as Influenced by Weed Density and Row Pattern
by
Mitchell Kevin Williams
A thesis submitted to the Graduate Faculty of North Carolina State University
in partial fulfillment of the requirements for the degree of
Master of Science
Crop Science
Raleigh, North Carolina 2013
APPROVED BY:
_______________________________ ______________________________
Ron Heiniger David Jordan
Committee Chair
ii
DEDICATION
iii
BIOGRAPHY
iv
ACKNOWLEDGMENTS
I would first like to thank my parents Kevin and Sherry Williams, for their support and encouragement in the pursuit of my goals. Without their assistance, completion of this degree would not have been attainable. I would also like to thank Charles and Becky Parrish, and Nathan and Caroline Williams, my grandparents, for also pushing me but also offering encouraging words when I am struggling.
Next I must also thank Leah Boerema, Joseph Oakes, and Dewayne Johnson for their help with planting, performing silk counts, and harvest.
v
TABLE OF CONTENTS
LIST OF TABLES ... vi
CORN POLLINATION AND YIELD AS INFLUENCED BY WEED DENSITY AND ROW PATTERN ...1
1. Introduction ...1
2.Materials and Methods ...7
2.1 Locations, Soils, Tillage, and Irrigation...7
2.2 Herbicide Treatments ...8
2.3 Weed Density ...9
2.4 Corn Measurements ...9
2.5 Statistical Analysis ...10
3. Results and Discussion ...11
3.1 Weed Density and Control ...11
3.2 Corn Response ...12
3.3 Correlations of Weed Control and Corn Response ...13
3.4 Corn Response to Planting Pattern in Absence of Weeds ...14
4. Conclusion ...15
vi
LIST OF TABLES
Table 1. ANOVA for common ragweed density 3 and 6 WAT, visible estimates of percent control 3 WAT, and corn vegetative and reproductive
growth ...24 Table 2. Common ragweed density 3 and 6 WAT, visible estimates of percent
control 3 WAT, and corn growth as influenced by herbicide program ...25 Table 3. ANOVA for visible estimates of common ragweed and Texas panicum control and density 3 WAT ...26 Table 4. Visible control of common ragweed as influenced by herbicide program ....27 Table 5. Visible control of Texas panicum as influenced by herbicide program ...28 Table 6. Common ragweed and Texas panicum densities 6 WAT ...29 Table 7. Interaction of trial, planting pattern, and herbicide program for common ragweed visible control ...30 Table 8. ANOVA for corn vegetative and reproductive growth as influenced by site, planting pattern, and herbicide program...31 Table 9. ANOVA for corn reproductive growth and yield, as influenced by
site, planting pattern, and herbicide program...32 Table 10. Days from planting to initial silk emergence, as influenced by herbicide program ...33 Table 11. Silk emergence duration in days, as influenced by herbicide program ...34 Table 12. Corn grain yield as influenced by herbicide program ...35 Table 13. Corn grain yield averaged over herbicide program
vii
Table 14. Pearson correlations of common ragweed and Texas panicum control versus corn growth response ...37 Table 15. Pearson correlations of common ragweed and Texas panicum density versus corn growth response ...38 Table 16. Pearson correlations of corn grain yield vs. corn pollination and
growth parameters ...39 Table 17. Pearson correlations among common ragweed and Texas panicum ...40 Table 18. ANOVA for reproductive growth and yield at Rocky Mount and
Plymouth in the absence of weed ...41
Table 19. ANOVA for influence of row pattern on corn stand, grain yield,
and silking characteristics under weed free conditions ...42
Table 20. Influence of row pattern and corn stand, grain yield, and silking
1
CORN POLLINATION AND YIELD AS INFLUENCED BY WEED DENSITY AND ROW PATTERN
1. Introduction
Low corn (Zea mays L.) yields have always been an important topic, especially considering wide use of the commodity. There are many factors which may contribute to low corn yields; including, but not limited to soil fertility, low stand counts, weed management, high temperature during pollination, damage from insects and diseases, and drought [Havlin et al. 2005]. In modern agriculture, increased cost of production makes it important as ever to maximize yields [Bird et al. 2003]. The use of herbicides to manage weeds is among one of the many parameters of integrated pest management for corn production [Bird et al., 2003].
2
Atrazine controls many broadleaf weeds and some grasses in corn. Atrazine can be applied PPI, PRE and POST, and inhibits photosynthesis in susceptible plants [Senseman 2007; Obermeier and Kapusta, 1996]. Atrazine is arguably the most successful herbicide ever marketed (LeBaron et al., 2008). Although used on 22.6 million ha in the United States [Ackerman, 2007], atrazine is no longer used in European countries because of concern of endocrine disruption in amphibians [Hayes, 2003]. Residues of atrazine have long been found in groundwater and surface water [Croll, 1991]. Use of atrazine continues to be reviewed by the EPA in the United States [Lebaron et al., 2008].
Development of herbicide resistant biotypes has increased challenges in managing weeds in corn and other agronomic crops [Holt and LeBaron, 1990]. To decrease the likelihood of development resistant biotypes, rotation of herbicide modes of action is essential and inclusion of critical practices that minimize reproduction of resistant biotypes [Gressel and Segal, 1990; Stephenson et al. 1990; Nandula et al., 2005; Holt and LeBaron, 1990].
Although glyphosate can be very effective in corn for the control of grasses and broadleaf weeds, resistance of weeds to glyphosate has increased the need to use alternatives to glyphosate [Nandula et al., 2005]. In addition to atrazine, dicamba can applied be applied preplant, PRE or POST to control broadleaf weeds in corn [Senseman, 2007]. Mixtures of dicamba and atrazine are often more effective than either herbicide alone [Soltani et al., 2011]. Atrazine, glufosinate, and glyphosate offer alternatives to dicamba in corn.
3
However, in recent years genetically modified crops resistant to POST applications of glufosinate and glyphosate have been developed and are more widely available [Krausz et al., 1999]. Glufosinate and glyphosate are two effective POST treatments for common ragweed control, if applied when common ragweed is 2-5 cm in height [Askew and Wilcut, 1999; Corbett et al., 2004; Culpepper et al., 2000].
Optimum plant populations limit interplant competition while maximizing corn yield [Duncan, 1984]. Higher plant populations and narrower row patterns allow corn to better compete with weeds by expediting canopy closure, resulting in interception of light by corn. Closure of the corn canopy 1-2 weeks more quickly with higher plant densities compared with lower populations or row patterns, increased light interception 3 to 5% [Sikkema et al., 2008; Teasdale, 1995 1998].
4
nutrient uptake; opposed to the uppermost leaves, which contribute mostly to vegetative growth [Ottman and Welch, 1989].
Increased yield at elevated populations is inconsistent, and there is an increased frequency of lodging in narrow row corn [Lambert et al., 2003]. Research has shown varying results however on weed suppression due to increased populations and reduced row spacing of corn [Teasdale, 1998]; this may be due to hybrid selection, weed species and
environmental factors [Bonaparte and Brawn, 1976; Hashemi et al., 2005; Johnson et al., 1988]. Increasing corn population from 33,000 to 133,000 plants ha-1 reduced yellow nutsedge growth (Cyperus esculentus L.) [Ghafar and Watson, 1983]. Redroot pigweed (Amaranthus retroflexus L.) vegetative biomass was reduced by increased corn population as well [McLachlan et al., 1993].
Historically, equipment has limited transition to rows exceeding 76 cm, equipment modification has made planting in narrow rows feasible. One alternative to narrow row planting is planting corn in twin row patterns. Twin row patterns consist of corn planted on rows spaced 18 to 24 cm apart on 91-cm centers. Conventional corn grain combine headers are compatible with this planting pattern, allowing the use of existing equipment for
production [Bruns et al., 2012].
5
in yield between the planting patterns was noted [Bruns, 2011a]. However, Gozubenli et al. (2004), showed a 4% yield increase in twin-row corn at high populations (60,000 plants ha-1 to 135,000 plants ha-1) compared with single-rows [Gozubenli et al., 2004]. There has been considerable research performed on twin-row peanut (Arachis hypogaea L.) over the past forty years as well. Often times, there is a yield advantage for twin-row over single-row peanut. Peanut in twin rows (18 cm apart on 74-cm centers) yielded a 15%higher than peanut in single rows and reduced weed density [Hauser and Buchanan, 1981 1982; Wehjte et al., 1984]. Standard twin-row planting (18 cm apart on 91-cm centers) offer a yield advantage over single row and narrow twin-row peanut [Lanier et al., 2004]. However, there are reports showing no yield advantage of twin-row peanut to single row peanut [Mixon, 1969]. There are differing reports on the yield advantage of twin-row cotton (Gossypium hirsutum L.) as well. A study in 2009 showed no yield advantage for twin-row cotton planted on 25 cm rows with 102-cm centers [Reddy et al., 2009]; while a study in Stoneville, MS showed a 6% increase in yield when using twin-rows on 38 cm rows with 102-cm centers [Reddy and Boykin, 2010]. Obviously, there are mixed reports on the benefits of using twin-rows in many different agronomic crops, evaluation of twin-row corn production in North Carolina should be performed.
6
ear development until silk emergence and grain fill. Husks are much more slender in appearance, and silk numbers are much lower, as compared to plants which exhibit normal ear development. Research by Stetzel et al., (2011) suggests that arrested ear development
may result from the application of a nonionic surfactant prior to VT, used with or without foliar fungicides. VT is defined as the corn growth stage at which the tassel is fully visible and pollination can begin [Abendroth et al., 2011]. Arrested ear development is not uniform throughout the field, as normal ears can be found towards the outer edges of the field [Stetzel et al., 2011]. Suggesting that crowding stress may influence arrested ear development.
Hashemi et al., (2005) indicates that competitive corn densities lend to poor pollination stemming from asynchrony between delayed silk emergence compared with tassel emergence [Hashemi et al., 2005; Otegui, 1997]. The number of days to tasseling was not affected across populations ranging from 60,000 to 135,000 plants ha-1; tasseling period was affected differently by twin and single row planting patterns. A period of 54.4 days from emergence to tasseling was the average across all treatments [Gozubenli et al., 2004]. However, the number of days-to-tasseling is a variable measurement, unique to hybrid and environmental factors.
Herbicides may reduce yields by negatively affecting pollination. Glyphosate reduced pollen viability but not yield in corn [Thomas et al., 2004]. This seems to show that
glyphosate does not contribute to arrested ear development. However, the impact of dicamba and glufosinate on grain development has not been evaluated.
7
with corn grown in the coastal plain of North Carolina with glyphosate-resistant and glufosinate-resistant hybrids. Therefore, research was conducted using three successful POST herbicides, with and without a residual herbicide to determine the influence of control
of common ragweed, Texas panicum, on silk emergence timing and poor ear development. Experiments were also conducted to compare weed control, yield and pollination characteristics between twin row and single row corn.
2. Materials and Methods
2.1 Locations, Soils, Tillage, and Irrigation. Field experiments were conducted during 2011 in one field and 2012 in two separate fields in North Carolina at the Peanut Belt Research Station near Lewiston-Woodville and during 2012 in two separate fields at the Upper Coastal Plain Research Station near Rocky Mount and in one field at the Tidewater Research Station near Plymouth. The experiments were planted in fields with natural and relatively high populations of common ragweed and Texas panicum (Panicum texanum L.) at Lewiston-Woodville. Weed population was too low and none-uniform in distribution at Rocky Mount and Plymouth to assess weed control. Soils at Rocky Mount, Lewiston-Woodville, and Plymouth were a Norfolk loamy sand (fine-loamy, kaolinitic, thermic Typic Kandiudults), a Goldsboro sandy loam (fine-loamy, siliceous, subactive, thermic Aquic Paleudults), and an Autryville loamy sand (loamy, siliceous, subactive, thermic Aquic Paleudults), respectively.
8
planted in single rows on 91-cm centers or in twin-row planted corn spaced 20 cm apart on 91-cm centers. Plot size was 2 rows by 9 m in length. Corn was planted on April 15, 2011 and April 16, 2012 at Rocky Mount and Lewiston-Woodville and April 16, 2012 at Plymouth. Corn at Lewiston-Woodville and Rocky Mount was irrigated to minimize drought effects. Corn was not irrigated at Plymouth.
2.2 Herbicide Treatments. During 2011 only, treatments consisted of two levels of herbicide tolerant trait expressing either glufosinate- or glyphosate-resistance; two levels of planting pattern consisting of single- or twin-rows described previously; and 6 levels of POST herbicide. Treatments included no herbicide, dicamba, glufosinate or glyphosate, atrazine, dicamba plus atrazine, glufosinate plus atrazine, or glyphosate plus atrazine. The glufosinate-tolerant cultivar was P1516BVT (DuPont Crop Protection, Wilmington DE, 19898). The glyphosate-tolerant cultivar was P1516HR (DuPont Crop Protection, Wilmington DE, 19898). In 2012, a corn hybrid is both glufosinate- and glyphosate-tolerant was planted. The hybrid in 2012 was 1615HR (DuPont Crop Protection, Wilmington DE, 19898).
9
ha-1, and 1100 g ai ha-1 respectively. Atrazine plus dicamba, atrazine plus glufosinate, and atrazine glyphosate were applied at 1100 +140 g ai ha-1, 1100 + 560 g ai ha-1, and 1100 + 840 g ai ha-1 respectively. Crop oil concentrate (Crop Oil Concentrate, Helena Chemcial
Company, Collierville, TN 38017) was included with all treatments containing atrazine. Herbicides were applied with a CO2-pressurized backpack sprayer calibrated to
deliver 145 L ha-1 using 8002 regular flat-fan nozzles (Teejet Corporation, Wheaton, IL 60187) at 275 kPa. All POST treatments were applied on the same day when corn was 25-36 cm in height and broadleaf weeds were less than 10 cm in height.
2.3 Weed Density. Visible estimates common ragweed (2011 and 2012) and Texas panicum control (2012) were recorded 3 weeks after treatment using a scale of 0 to 100 with 0= no control and 100= complete control (Frans, 1986). Weed density reduction relative to the non-treated control, foliar chlorosis and necrosis, and plant stunting were considered when
making estimates of percent visible control. Density of common ragweed and Texas panicum were recorded 6 weeks after treatment in a section equivalent to 1 m2.
2.4 Corn Measurements. The number of days from planting to silk emergence was
10
the ear, to prevent counting a plant more than once until pollination ended.
Corn ears were removed by hand harvesting, shelled, and dried to 14% moisture. Prior to shelling, ear type categories of incomplete, complete, blunt, of nubbin were determined using illustrations [Mueller and Pope, 2009]. Once each ear was classified, all related ears bulked into ear type and grain yield was determined.
The experimental design during 2011 was a split-plot with HRT serving as whole plot units and combinations of planting patterns and herbicide treatments serving as sub-plot units. In 2012, the experimental design was a randomized complete block design. Treatments were replicated four times at all locations.
2.5 Statistical Analysis. Data for percent control of common ragweed and Texas panicum and density, data related to silking and ear type, and grain yield were subjected to ANOVA for a two (HRT) by two (planting pattern) by six (POST herbicide treatment) factorial arrangement of treatments, using the PROC GLM procedure in SAS (SAS v9.2, SAS Institute Inc., Cary, NC 27513, USA). Means of significant main effects and interactions were separated using Fisher’s Protected LSD test at p ≤ 0.05. Pearson Correlation Coefficients were determined for all parameters at p ≤ 0.05 (SAS v9.2, SAS Institute, Cary, NC 27513).
11
interactions were separated using Fisher’s Protected LSD test at p ≤ 0.05.
3. Results and Discussion
3.1 Weed Density and Control. The interaction of HRT and herbicide program as well as planting pattern were not significant for common ragweed density and visible control
regardless of timing after POST application in 2011 (Table 1). Lack of an interaction of HRT and herbicide program suggests that both glufosinate and glyphosate are equally effective in controlling common ragweed when applied using the appropriate herbicide-resistant hybrid. The main effect of herbicide program was significant for density and visible control,
reflective of past research [Mason and Huber, 2001]. Application of a POST herbicide decreased density of common ragweed and significantly increased visible control of this weed, regardless of herbicide (Table 2).
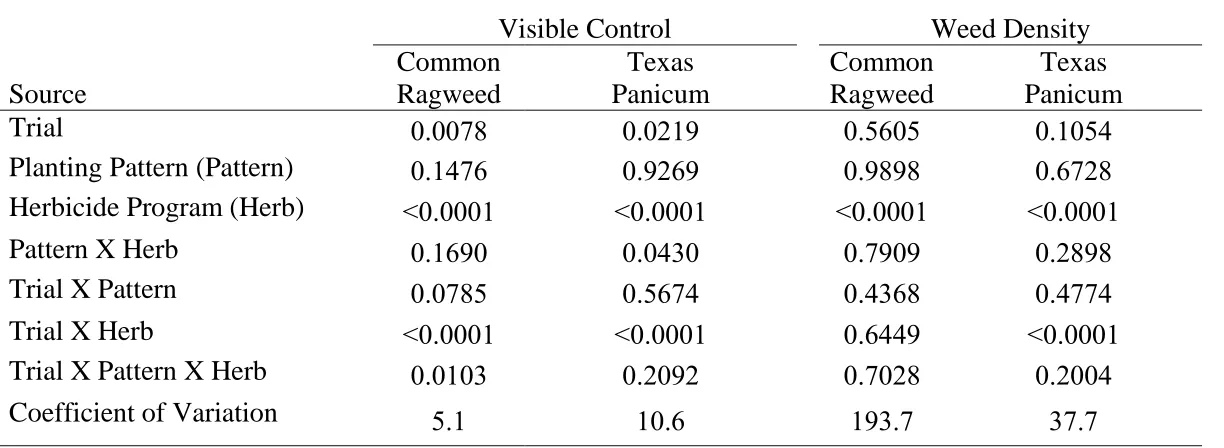
The interaction of trial by planting pattern by herbicide program was significant for visible control of common ragweed but not density of this weed or for visible control of Texas panicum (Table 3). The interaction of trial by herbicide was significant for both control of Texas panicum and density. Visible control and density of both species were influenced by the main effect of planting pattern.
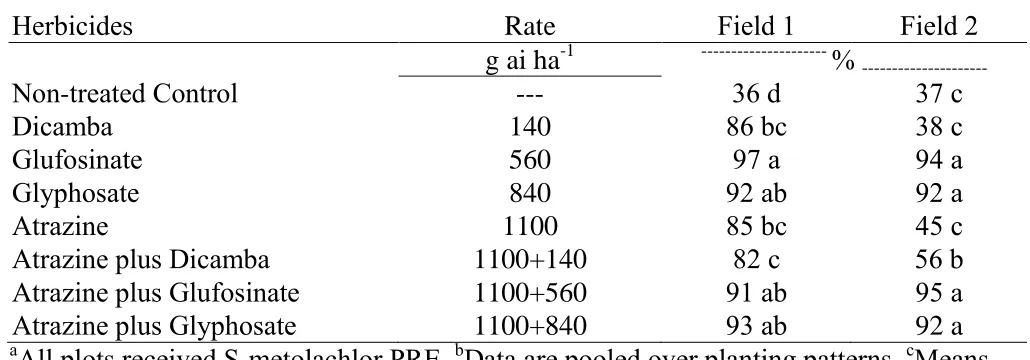
Regardless of field, common ragweed was controlled at least 97% by all herbicide programs (Table 4). Texas panicum control by all POST herbicides exceeded that of S-metolachlor alone (Table 5). The most effective POST herbicide program generally
12
glufosinate and glyphosate are both effective options for controlling common ragweed [Askew and Wilcut, 1999; Corbett et al., 2004; Culpepper et al., 2000]. Regardless of field, Texas panicum density was reduced by POST herbicides compared with
S-metolachlor alone. Similar results were observed by Prostko et al. (2006). Differences in density of weeds and visible control may have been associated with weeds developing after herbicides had their full impact and may not have been related directly to herbicide efficacy. This can be explained by comparing common ragweed density to Texas panicum density. The higher control of common ragweed most likely led to a higher density of Texas panicum, for example. The interaction of trial by planting pattern by herbicide program by herbicide for common ragweed control can be attributed to the differences among fields. Herbicide program was significant for field 1 but not for field 2 (Table 7).
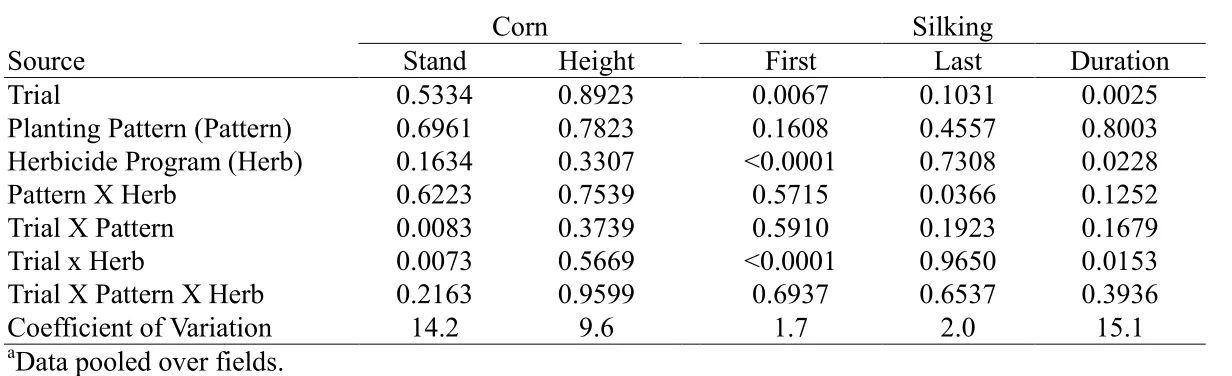
3.2 Corn Response. The interaction of HRT, herbicide program, and planting pattern was not significant for any of the measurements associated with corn growth during 2011 (Table 1). Corn stand and height were affected by HRT and both HRT and herbicide programs, respectively. Planting pattern and interaction of HRT and herbicide program did not interact with other treatment factors. Grain yield was affected only by herbicide program and not HRT. These data suggest that twin row planting patterns offer no advantage to single rows when common ragweed is the only weed present.
13
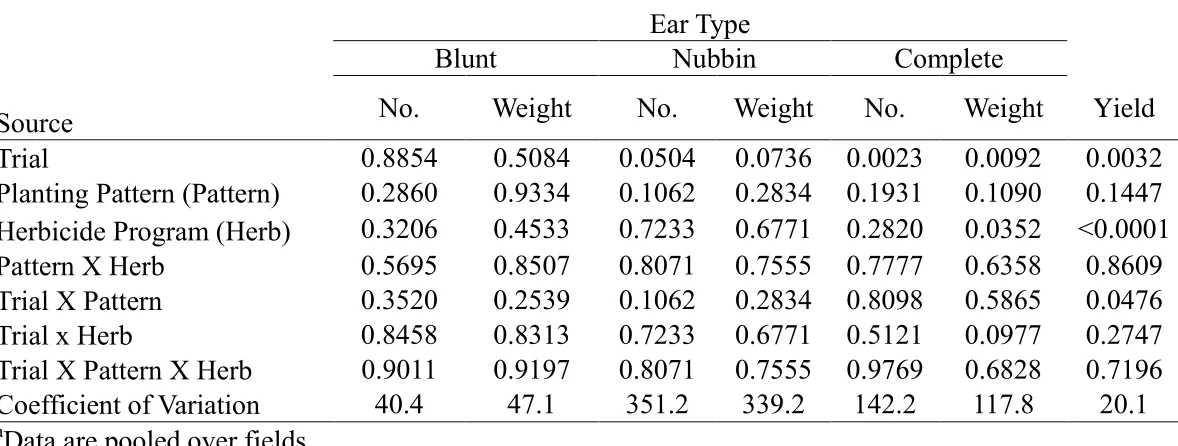
POST herbicides were applied, but few differences in ear characteristics were noted when comparing among herbicide programs (Table 9).
The interaction of field by herbicide treatment was caused because no difference in silk emergence was noted in field 1 while difference of up to 5 days was noted in field 2 (Table 10). All POST herbicide treatments hastened time to silking compared with S-metolachlor only (Table 10). Generally, applying glufosinate and glyphosate were the most effective treatments in hastening silking. This can be attributed to greater control of common ragweed and Texas panicum by these herbicides compared with dicamba or atrazine (Table 4, Table 5). A similar response was noted with respect to duration of silking (Table 11). Generally, the duration of silk emergence was prolonged when POST herbicides were applied; there were inconsistent results noted among herbicide treatments. Grain yield was higher in one field when corn was planted in twin rows, compared with single rows, but not in the second field (Table 12). Planting in twin rows increased yields in field 1 but not in field 2 compared with single rows (Table 13). Past research has often showed differing results pertaining to the yield advantage of twin rows over single row planted corn [Bruns, 2011a 2011b; Bruns et al., 2012, Gozubenli et al., 2004].
3.3 Correlations of Weed and Corn Response. Correlations of visible control of common ragweed and corn stand, train yield, days to first silk, and silk durations were significant (Table 14). However, only the correlations of Texas panicum control and grain yield were significant (Table 14). Corn yield and days to first silk were correlated with common
14
for correlations of these factors with Texas panicum density (Table 15). Higher visible weed control was often positively correlated with grain yield. Likewise, a greater weed density was negatively correlated with grain yield. The positive relationship of weed density or negative relationship of weed control with days to silking most likely resulted from greater
interference with corn and accompanying stress that delayed crop development. Blunt weight, complete weight and silk duration were also positively correlated with corn grain yield (Table 16).
In contrast to results with grain yield and silking, correlations among visible weed control and weed density were not correlated with ear type (Table 15). As expected,
common ragweed control and density were correlated negatively (Table 17). Texas panicum control and density also were negatively correlated. In some instances correlations revealed dynamics in the field were control of one species allowed a second species to become dominant.
3.4 Corn Response to Planting Pattern in Absence of Weeds. The interaction of trial by planting pattern was significant only for days to silking (Table 18). Planting pattern affected grain yield and days to silking but not the other parameters (Table 18). Grain yield increased from 9,790 kg ha-1 in single rows to 11,050 kg ha-1 in twin rows (data not shown in tables). Trial affected all parameters because of the difference in plant populations between the two locations (Table 18). In the absence of weeds across several locations and both years, yield days to silking, days to end silking, total days of silk emergence and stand were all
15
single row planted corn, 7180 kg ha-1 for twin rows and 5830 kg ha-1 respectively (Table 20). There were no differences for silking parameters between single and twin row planted corn (Table 20).
4. Conclusion
Overall, POST herbicides provided greater control of common ragweed and Texas panicum over S-metolachlor alone. Visible control for both species was improved and density of both species was decreased when any POST herbicide was used. The most
effective POST herbicide program generally contained glufosinate or glyphosate either alone or with atrazine. Planting corn in a twin-row pattern exceeded control of common ragweed and Texas panicum as compared to single row corn. In addition, greater control of common ragweed leads to an increase of Texas panicum density.
16
Conflict of Interests
None of the authors has a conflict of interests in terms of the products mentioned in the paper.
Acknowledgements
The North Carolina Corn Growers Association provided financial support for this research. Appreciation is expressed to staff at the Peanut Belt Research Station, Tidewater Research Station and Upper Coastal Plain Research Station for technical assistance. Special
17 REFERENCES
[1] J. L. Havlin, J. D. Beaton, S. L. Tisdale, and W. L. Nelson, “Soil fertility and fertilizers: an introduction to nutrient management,” ISBN 0-13-027824-6, pp. 7-9, 2005.
[2] G. W. Bird, K. M. Maredia, D. Dakouo, and D. Mota-Sanchez, “Role of integrated pest management and sustainable development,” in “Integrated pest management in the global arena,” CABI Publishing, Wallingford, UK, pp. 73-85, 2003.
[3] T. M. Webster, “Weed survey- southern states” Proceedings Southern Weed Science Society, vol. 53, pp. 247-252, 2000.
[4] H. D. Coble, F. M. Williams, and R. L. Ritter, “Common ragweed (Ambrosia artemisiifolia) interference in soybeans (Glycine max),” Weed Science, vol. 29, pp. 339-342, 1981.
[5] P. G. Mason, and J. T. Huber, “Biological Control Programmes in Canada, 1981-2000,” ISBN 0-85199-527-6, 2001.
[6] E. P. Prostko, T. L. Grey, and J. W. Davis, “Texas panicum (Panicum texanum) control in irrigated field corn (Zea mays) with foramsulfuron, glyphosate,
nicosulfuron, and pendimethalin,” Weed Technology, vol. 20, pp. 961-964, 2006. [7] W. C. Johnson III and B. G. Mullinix, “Efficacy and economic analysis of Texas
18
[8] W. E. Thomas, I. C. Burke, and J. W. Wilcut, “Weed management in glyphosate-resistant corn with glyphosate, halosulfuron, and mesotrione.” Weed Technology, vol. 18, pp. 826-834, 2004.
[9] M. R. Obermeier and G. Kapusta, “Postemergence broadleaf weed control in corn (Zea mays) with CGA-152005,” Weed Technology, vol. 10, pp. 689-698, 1996. [10] S. A. Senseman, “Herbicide Handbook, Seventh Edition,” Weed Science Society of
America, publisher, ISBN# 1-891276-56-5, 2007.
[11] H. M. LeBaron, J. E. McFarland, and O. C. Burnside, “The Trizaine Herbicides: A Milestone in the Development of Weed Control Technology,” in “The Triazine Herbicides, 50 Years Revolutionizing Agriculture,” ISBN 978-0-444-51167-6, 2008. [12] F. Ackerman, “The Economics of Atrazine,” International Journal of Occupational
and Environmental Health, vol. 13, pp. 441-449, 2007.
[13] T. B. Hayes, T. B., K. Haston, M. Tsui, A. Hoang, C. Haeffele, and A. Vonk, “Atrazine-induced hermaphrodisom at 0.1 ppb in American leopard frogs (Rana pipiens): laboratory and field evidence,” Environmental Health Perspectives, vol. 111, pp. 568-575, 2003
[14] B. T. Croll, “Pesticides in surface waters and ground waters,” Journal of the Institution of Water & Environmental Management, vol. 5, pp. 389-395, 1991. [15] J. S. Holt and H. M. LeBaron, “Significance and distribution of herbicide resistance,”
19
[16] J. Gressel, and L. A. Segel, “Modelling the effectiveness of herbicide rotations and mixtures as strategies to delay or preclude resistance,” Weed Technology, vol. 4, pp. 186-198, 1990.
[17] G. R. Stephenson, M. D. Dykstra, R. D. McLaren, and A. S. Hamill, “Agronomic practices influencing triazine-resitant weed distribution in Ontario,” Weed
Technology, vol. 4, pp. 199-207, 1990.
[18] V. J. Nandula, K. N. Reddy, S. O. Duke, and D. H. Poston, “Glyphosate-Resistant Weeds: Current Status and Future Outlook,” Outlooks on Pest Management, online, doi:10.1564/16aug11, 2005.
[19] N. Soltani, C. Shropshire, and P. H. Sikkema, “Giant ragweed (Ambrosia trifida L.) control in corn,” Canadian Journal of Plant Science, vol. 91, pp. 577-581, 2011. [20] S. D. Askew, and J. W. Wilcut, “Cost and weed management with herbicide
programs in glyphosate-resistant cotton (Gossypium hirsutum),” Weed Technology, vol. 13, pp. 308-313, 1999.
[21] J. L. Corbett, S. D. Askew, W. E. Thomas, and J. W. Wilcut, “Weed efficacy evaluations for bromoxynil, glufosinate, glyphosate, pyrithiobac, and sulfosate,” Weed Technology, vol. 18, pp. 443-453, 2004.
20
[23] W. G. Duncan, “The relationship between corn population and yield,” Agronomy Journal, vol. 50, pp. 82-84, 1958.
[24] W. G. Duncan, “A theory to explain the relationship between corn population and grain yield,” Crop Science, vol. 24, pp. 1141-1145, 1984.
[25] P. H. Sikkema, R. E. Nurse, T. Welacky and A. S. Hamill, “Reduced herbicide rates provide acceptable weed control regardless of corn planting strategy in Ontario field corn,” Canadian Journal of Plant Science, vol. 88, pp. 373-378, 2008.
[26] J. R. Teasdale, “Influence of narrow row/high population corn (Zea mays) on weed control and light transmittance,” Weed Technology, vol. 9, pp. 113-118, 1995.
[27] J. R. Teasdale, “Influence of corn (Zea mays) population and row spacing on corn and velvetleaf (Abutilon theophrasti) yield,” Weed Science, vol. 46, pp. 447-453, 1998. [28] A. M. Hashemi, S. J. Herbert, and D. H. Putnam, “Yield response of corn to crowding
stress,” Agronomy Journal, vol. 97, pp. 839-846, 2005.
[29] E. E. N. A. Bonaparte, and R. I. Brawn, “Effects of plant density and planting date on leaf number and some developmental events in corn,” Canadian Journal of Plant Science, vol. 56: pp. 691-698, 1976.
[30] M. J. Ottman, and L. F. Welch, “Planting patterns and radiation interception, plant nutrient concentration, and yield in corn,” Agronomy Journal, vol. 81, pp 167-174, 1989.
21
[32] G. A. Johnson, T. R. Hoverstad, and R. E. Greenwald, “Integrated weed management using narrow corn row spacing, herbicides, and cultivation,” Agronomy Journal, vol. 90, pp. 40-46, 1998.
[33] Z. Ghafar, and A. K. Watson, “Effect of corn population on the growth of yellow nutsedge,” Weed Science, vol. 31, pp. 588-592, 1983.
[34] S. M. McLachlan, M. Tollenaar, C. J. Swanton, and S. F. Wise, “Effect of corn-induced shading on dry matter accumulation, distribution, and artecture of redroot pigweed,” Weed Science, vol. 41, pp. 568-573, 1993.
[35] H. A. Bruns, M. W. Ebelhar, and H. K. Abbas, “Comparing single-row and twin-row corn production in the Mid South,” Crop Management, online, doi:10.1094/CM-2012-0404-01-RS, 2012.
[36] K. A. Nelson, and R. L. Smoot, “Twin- and single-row corn production in northeast Missouri,” Crop Management, doi:10.1094/CM-2009-0130-01-RS, 2009.
[37] H. A. Bruns, “Comparisons of single-row and twin-row soybean production in the Mid South,” Agronomy Journal, vol. 103, pp. 702-708, 2011.
[38] H. A. Bruns, “Planting date, rate and twin-row vs. single-row soybean in the Mid-South,” Agronomy Journal, vol. 103, pp. 1308-1313, 2011.
22
[40] W. J. Grichar, “Row spacing, plant populations, and cultivar effects on soybean production along the Texas Gulf Coast,” Crop Management, online, doi:10.1094/CM-2007-0615-01-RS, 2007.
[41] E. W. Hauser, and G. A. Buchanan, “Influence of row spacing, seeding rates, and herbicide systems on the competitiveness and yield of peanuts,” Peanut Science, vol. 8, pp. 78-81, 1981.
[42] E. W. Hauser, and G. A. Buchanan, “Production of peanuts as affected by weed competition and row spacing,”Alabama Agricultural Experiment Station Bulletin, 538, pp 35, 1982.
[43] G. Wehtje, R. H. Walker, M. G. Patterson, and J. A. McGuire, “Influence of twin rows on yield and weed control in peanuts,” Peanut Science, vol. 11, pp. 88-91, 1984. [44] J. E. Lanier, D. L. Jordan, J. F. Spears, R. Wells, P. D. Johnson, J. S. Barnes, C. A.
Hurt, R. L. Brandenburg, and J. E. Bailey, “Peanut response to planting pattern, row spacing, and irrigation,” Agronomy Journal, vol. 96, pp. 1066-1072, 2004.
[45] A. C. Mixon, “Effects of row and drill spacing on yield and market grade factors of peanuts,” Auburn University Agricultural Experiment Station Bulletin, 381, 1969. [46] K. N. Reddy, I. C. Burke, J. C. Boykin, and J. R. Williford, “Narrow-row cotton
23
[47] K. N. Reddy, and J. C. Boykin, “Weed control and yield comparisons of twin- and single-row glyphosate-resistant cotton production systems,” Weed Technology, vol. 24, pp. 95-101, 2010.
[48] E. J. Sadler, P. J. Bauer, and W. J. Busscher, “Site Specific Analysis of Droughted Corn Crop: I. Growth and Grain Yield,” Agronomy Journal, vol. 92, pp. 395-402, 2000.
[49] L. J. Abendroth, R. W. Elmore, M. J. Boyer, and S. K. Marlay, “Corn growth and development,” PMR 1009. Iowa State University Extension, Ames, Iowa.
[50] N. Stetzel, K. Wise, B. Nielsen, and C. Gerber. 2011. Arrested ear development in hybrid corn. Purdue Extension publication, BP-85-W, 2011.
[51] M. E. Otegui, “Kernal set and flower synchrony within the ear of maize: II. Plant population effects,” Crop Science, vol. 37, pp. 448-455, 1997.
[52] W. E. Thomas, W. A. Pline-Srnić, J. F. Thomas, K. L. Edmisten, and J. W. Wilcut, “Glyphosate negatively affects pollen viability but not pollination and seed set in glyphosate-resistant corn,” Weed Science vol. 52, pp. 725-734, 2004.
[53] R. Frans, R. Ralbert, D. Marx, and H. Crowley, “Experimental design and techniques for measuring and analyzing plant responses to weed control practices,” pp. 37-38, N. D. Camper, editor, Research Methods in Weed Science, Third edition, Southern Weed Science Society, 1986.
24
Table 1. ANOVA for common ragweed density 3 and 6 weeks after treatment (WAT), visible estimates
of percent control 3 WAT, and corn vegetative and reproductive growth.
Common Ragweed Corn
Density Type Ear
3 WAT 6 WAT Visible
Control Stand Height
Grain
Yield Incomplete Nubbin Blunt Complete
Days to Silking Planting Pattern
(Pattern) 0.7379 0.8267 0.1937 0.4628 0.4113 0.6861 0.4919 0.2993 0.9522 0.9999 0.3560 Herbicide
Resistance Trait
(HRT) 0.6718 0.2570 0.8496 0.0223 0.0109 0.6721 0.0010 0.0010 0.5101 0.2042 <0.0001 Herbicide Program
(Herb) <0.0001 <0.0001 <0.0001 0.1382 <0.0001 0.0368 0.8429 0.0334 0.7301 0.3141 0.0003 Pattern x HRT 0.9112 0.2951 0.2373 0.7361 0.7144 0.0589 0.5989 0.4239 0.5101 0.7984 0.5288 Pattern x Herb 0.9978 0.9878 0.4530 0.8173 0.7078 0.6210 0.4623 0.5958 0.1960 0.7363 0.7775 HRT x Herb 0.8929 0.6098 0.3362 0.7535 0.2285 0.8946 0.7226 0.3407 0.2501 0.6867 0.2194 Pattern x HRT x
Herb 0.9999 0.6022 0.7688 0.7171 0.5049 0.1836 0.2797 0.3495 0.7822 0.9512 0.9008 Coefficient of
25
Table 2. Common ragweed density 3 and 6 weeks after treatment (WAT), visible estimates of percent
control 3 WAT, and corn growth as influenced by herbicide program.
aCommon Ragweed
Corn
Herbicide Program
Density
Visible
control
Grain
yield
Nubbin
Days to
silking
3 WAT
6 WAT
_______
m
-2 _______%
kg ha
-1kg/plot
S
-metolachlor PRE
18 a
19 a
30 b
3290 b
970 c
70 a
S
-metolachlor PRE, Dicamba POST
0 b
0 b
100 a
4140 a
1420 b
68 c
S
-metolachlor PRE, Glyphosate or
Glufosinate POST
1 b
1 b
93 a
4140 a
1730 a
68 c
S
-metolachlor PRE, Atrazine POST
1 b
2 b
92 a
3910 ab 1550 ab
69 b
S
-metolachlor PRE, Atrazine plus
Dicamba POST
0 b
0 b
100 a
4180 a
1420 b
69 b
S
-metolachlor PRE, Atrazine + Dicamba +
Glyphosate/Glufosinate POST
0 b
0 b
100a
4710 a 1650 ab
69 b
a
26
Table 3. ANOVA for visible estimates of common ragweed and Texas Panicum control and density
3 WAT.
aVisible Control
Weed Density
Source
Common
Ragweed
Texas
Panicum
Common
Ragweed
Texas
Panicum
Trial
0.0078
0.0219
0.5605
0.1054
Planting Pattern (Pattern)
0.1476
0.9269
0.9898
0.6728
Herbicide Program (Herb)
<0.0001
<0.0001
<0.0001
<0.0001
Pattern X Herb
0.1690
0.0430
0.7909
0.2898
Trial X Pattern
0.0785
0.5674
0.4368
0.4774
Trial X Herb
<0.0001
<0.0001
0.6449
<0.0001
Trial X Pattern X Herb
0.0103
0.2092
0.7028
0.2004
Coefficient of Variation
5.1
10.6
193.7
37.7
a
27
Table 4. Visible control of common ragweed as influenced by herbicide program.
abcHerbicides
Rate
Field 1
Field 2
g ai ha
-1 ---%
---Non-treated Control
---
5 b
28 b
Dicamba
140
100 a
99 a
Glufosinate
560
98 a
98 a
Glyphosate
840
99 a
97 a
Atrazine
1100
100 a
100 a
Atrazine plus Dicamba
1100+140
99 a
100 a
Atrazine plus Glufosinate
1100+560
100 a
96 a
Atrazine plus Glyphosate
1100+840
99 a
100 a
a
All plots received S-metolachlor PRE.
bData are pooled over planting patterns.
cMeans within a column
28
Table 5. Visible control of Texas panicum as influenced by herbicide program.
abHerbicides
Rate
Field 1
Field 2
g ai ha
-1 ---%
---Non-treated Control
---
36 d
37 c
Dicamba
140
86 bc
38 c
Glufosinate
560
97 a
94 a
Glyphosate
840
92 ab
92 a
Atrazine
1100
85 bc
45 c
Atrazine plus Dicamba
1100+140
82 c
56 b
Atrazine plus Glufosinate
1100+560
91 ab
95 a
Atrazine plus Glyphosate
1100+840
93 ab
92 a
a
All plots received S-metolachlor PRE.
bData are pooled over planting patterns.
cMeans
29
Table 6. Common ragweed, and Texas panicum densities 6 WAT.
abcTexas panicum
Herbicides
Rates
Common ragweed
Field 1
Field 2
g ai ha
-1Non-treated Control
---
20.1 a
10.5 b
22.1 bc
Dicamba
140
0 b
21 a
42.5 a
Glufosinate
560
1.1 b
17.3 ab
27.5 b
Glyphosate
840
3.3 b
12.8 ab
17.2 c
Atrazine
1100
0.3 b
18 ab
41.7 a
Atrazine plus Dicamba
1100+140
0.1 b
13.3 ab
44.1 a
Atrazine plus Glufosinate
1100+560
1.1 b
15.4 ab
19.1 bc
Atrazine plus Glyphosate
1100+840
0.5 b
13.8 ab
23.5 bc
a
All plots received S-metolachlor PRE.
bData are pooled over planting patterns.
cMeans
30
Table 7. Interaction of trial, planting pattern, and herbicide program for common ragweed visible
control.
Source
Field 1
Field 2
Planting Pattern
0.0968
0.5443
Herb
<0.0001
<0.0001
31
Table 8. ANOVA for corn vegetative, and reproductive growth as influenced by site, planting
pattern, and herbicide program.
aSource
Corn
Silking
Stand
Height
First
Last
Duration
Trial
0.5334
0.8923
0.0067
0.1031
0.0025
Planting Pattern (Pattern)
0.6961
0.7823
0.1608
0.4557
0.8003
Herbicide Program (Herb)
0.1634
0.3307
<0.0001
0.7308
0.0228
Pattern X Herb
0.6223
0.7539
0.5715
0.0366
0.1252
Trial X Pattern
0.0083
0.3739
0.5910
0.1923
0.1679
Trial x Herb
0.0073
0.5669
<0.0001
0.9650
0.0153
Trial X Pattern X Herb
0.2163
0.9599
0.6937
0.6537
0.3936
Coefficient of Variation
14.2
9.6
1.7
2.0
15.1
32
Table 9. ANOVA for corn reproductive growth, and yield as influenced by site, planting pattern,
and herbicide program.
aSource
Ear Type
Blunt
Nubbin
Complete
No.
Weight
No.
Weight
No.
Weight
Yield
Trial
0.8854
0.5084
0.0504
0.0736 0.0023
0.0092
0.0032
Planting Pattern (Pattern)
0.2860
0.9334
0.1062
0.2834 0.1931
0.1090
0.1447
Herbicide Program (Herb)
0.3206
0.4533
0.7233
0.6771 0.2820
0.0352 <0.0001
Pattern X Herb
0.5695
0.8507
0.8071
0.7555 0.7777
0.6358
0.8609
Trial X Pattern
0.3520
0.2539
0.1062
0.2834 0.8098
0.5865
0.0476
Trial x Herb
0.8458
0.8313
0.7233
0.6771 0.5121
0.0977
0.2747
Trial X Pattern X Herb
0.9011
0.9197
0.8071
0.7555 0.9769
0.6828
0.7196
Coefficient of Variation
40.4
47.1
351.2
339.2
142.2
117.8
20.1
33
Table 10. Days from planting to initial silk emergence, as influenced by herbicide program.
abcHerbicides
Rates
Field 1
Field 2
g ai ha
-1 ---No. of Days
---Non-treated Control
---
66 a
68 a
Dicamba
140
66 a
64 bc
Glufosinate
560
66 a
63 c
Glyphosate
840
66 a
63 c
Atrazine
1100
66 a
65 b
Atrazine plus Dicamba
1100+140
66 a
65 b
Atrazine plus Glufosinate
1100+560
66 a
63 c
Atrazine plus Glyphosate
1100+840
66 a
64 bc
a
All plots received S-metolachlor PRE.
bData are pooled over planting patterns.
cMeans within a column
34
Table 11. Silk emergence duration in days, as influenced by herbicide program.
abcHerbicides
Rates
Field 1
Field 2
g ai ha
-1 ---No. of Days
---Non-treated Control
---
12 a
11 d
Dicamba
140
11 a
15 ab
Glufosinate
560
11 a
15 ab
Glyphosate
840
11 a
15 ab
Atrazine
1100
11 a
14 bc
Atrazine plus Dicamba
1100+140
11 a
13 c
Atrazine plus Glufosinate
1100+560
12 a
16 a
Atrazine plus Glyphosate
1100+840
12 a
15 ab
a
All plots received S-metolachlor PRE.
bData are pooled over planting patterns.
cMeans within a column
35
Table 12. Corn grain yield as influenced by herbicide program.
abcHerbicide Program
Rates
kg/ha
-1g ai ha
-1Check
---
3570 c
Dicamba
140
4050 bc
Glufosinate
560
4950 a
Glyphosate
840
4530 ab
Atrazine
1100
3620 c
Atrazine plus Dicamba
1100+140
4220 b
Atrazine plus Glufosinate
1100+560
3660 c
Atrazine plus Glyphosate
1100+840
4290 b
a
All plots received S-metolachlor PRE.
bData are pooled over fields.
cMeans within a column followed by
36
Table 13. Corn grain yield averaged over herbicide program (Single-row vs. Twin-row).
abTrial
Single Row
Twin
Row
---
kg/ha
---Field 1
4830 b
5400 a
Field 2
3150 a
3120 a
a
Data pooled over herbicide program.
bMeans within a row followed by the same letter are not
37
Table 14. Pearson correlations of common ragweed and Texas panicum control versus corn growth
response.
Visible Weed Control
Source
Common Ragweed
Texas Panicum
Corn
P>F
R²
P>F
R²
Stand
0.0059
0.24
0.8784
0.01
Height
0.0564
0.15
0.6299
0.04
Pattern
0.7958
-0.02
0.9359
-0.01
Yield
0.0483
0.19
0.0001
0.35
Days to First Silk
<0.0001
-0.38
0.2360
-0.11
38
Table 15. Pearson correlations of common ragweed and Texas panicum density versus corn growth
response.
Weed Density
Source
Common Ragweed
Texas Panicum
Corn
P>F
R²
P>F
R²
Stand
0.0730
-0.16
0.1628
0.12
Height
0.0757
-0.16
0.4520
0.07
Pattern
0.9592
-0.01
0.8382
0.02
Yield
0.0141
-0.23
<0.0001
-0.43
Days to First Silk
0.0008
0.30
0.0147
-0.22
39
Table 16. Pearson correlations of corn grain yield vs. corn pollination and growth parameters.
Source
P>F
R
2Nubbin Weight
0.0226
0.22
Blunt Weight
<0.0001
0.47
Incomplete Weight
0.8293
-0.02
Complete Weight
<0.0001
0.45
Stand
0.4441
0.07
Height
0.0557
0.18
Planting Pattern
0.2992
0.10
Days to First Silk
0.0747
0.17
40
Table 17. Pearson correlations among common ragweed and Texas panicum.
Source
P>F
R²
Common ragweed density vs. common ragweed control
<0.0001 -0.75
Common ragweed density vs. Texas panicum control
<0.0001 -0.41
Texas panicum density vs. common ragweed control
0.1097 0.14
Texas panicum density vs. Texas panicum control
<0.0001 -0.37
41
Table 18. ANOVA for reproductive growth and yield at Rocky Mount and Plymouth in the absence
of weeds.
aSource
Yield
Stand
Days to Silking
Days to End
Silking
Total Days of
Silking
Trial
<0.0001
0.0004
0.0417
0.0100
0.0239
Planting Pattern
0.0126
0.4640
<0.0001
0.8788
0.0610
Trial X Planting Pattern
0.9197
0.8174
<0.0001
0.4520
0.4899
Coefficient of
Variation
14.5
13.4
0.5
1.3
7.0
a
42
Table 19. ANOVA for influence of row pattern on corn stand, grain yield, and
silking characteristics under weed free conditions.
Source Yield
(Group 1)
Yield (Group 2)
Days to Silking Days to End Silking Total Days of Silking Stand
Trial <0.0001 0.0093 0.0009 0.0015 0.0003 <0.0001
Planting Pattern 0.0007 0.2442 0.5299 0.5057 0.2364 0.1669
Trial X Planting Pattern 0.0919 0.2378 0.2685 0.3835 0.1487 0.2768
Coefficient of Variation 15.7 12.8 1.6 1.9 11.3 11.0
Number of Trials 5 2 7 7 7 7
43
Table 20. Influence
Table 20. Influence of row pattern and corn stand, grain yield, and silking parameters under weed
free conditions.
Row Pattern
Grain Yield
Silking
Stand
Group 1
Group 2
First
Last
Duration
No./3 m
----kg ha
-1----
--- days---
Single
43
5830
4380
65
77
12
Twin
44
7180
3870
65
77
12
Number of Trials
7
5
2
7
7
7
a