Software Run-time Entropy: A Novel Type of
Indicators for Software Failure Prediction
Shiyi Kong1,2,† , Minyan Lu1,2,†,* and Bo Sun3
1 The Key Laboratory on Reliability and Environmental Engineering Technology, Beihang University, Beijing, China, 100191
2 School of Reliability and System Engineering, Beihang University, Beijing, China, 100191 3 System Engineering Research Institute, China State Shipbuilding Corporation (CSSC) Electronics
Technology Co. LTD, Beijing, China, 100036
* Correspondence: [email protected] (M.L.), [email protected] (S.K.) † These authors contributed equally to this work.
Abstract:With the development of computer science and software engineering, software becomes more and more complex. Traditional software reliability assurance techniques including software testing and evaluation can’t ensure software reliable execution after being deployed. Software failure prediction techniques based on failure indicators can predict software failures according to abnormal indicator values. The latter can be collected using runtime monitoring techniques. An essential part of this method is finding proper indicators which have strong correlation with software failures. We propose a novel type of indicators in this work named software runtime entropy, which takes both software module execution time and call times into consideration. Three common open source software, grep, flex and gzip are used as study cases for finding the relationships between the indicators and software failures. Firstly, a series of fault injection experiments are conducted on those three software respectively. The decision tree algorithm is used to train those data to build the correlation models between software runtime entropy and software failures. Several common measures in machine learning domains such as accuracy, recall rates, and F-measure are used to evaluate the models. The decision tree models can be used as failure mechanisms to assist the failure prediction work. One can examine the value of runtime entropy and make a warning report when it ranges from the normal interval to abnormal one.
Keywords:software runtime entropy, failure prediction, indicator
1. Introduction
With the development of computer science and software engineering, software takes more and more important roles and becomes more and more complex. Software reliability has become the core of the reliability of modern systems. A research conducted by Software Engineering Institute of Carnegie Mellon University shows that there still are 20% resident errors after software products being deployed[1]. Software Prognostic Health Management(S-PHM), as a kind of runtime software reliability assurance techniques, attracts more and more attentions under such circumstances[2]. S-PHM techniques monitor software behaviors and status simultaneously with software execution process, detect and predict possible failures, and take proper measures. Software failure prediction is an essential part in this process[3]. Existing researches on software failure prediction can be classified into two types, event log based methods and failure mechanisms based methods. Methods based on failure event log are under the constraint of the integrity of log files. One must custom system log by changing system inner log modules to obtain necessary failure information to make a rather precise prediction. Runtime information based methods collect runtime data during software execution process and make prediction based on those data.
Software failure mechanisms refer to the abnormal behaviors and status before software systems failures[4], such as memory usage soaring. Memory usage is an indicator used to predict software failures in this failure mechanism.
Software failure indicators in existing researches are mostly collected from outside of software objects. These indicators are obtained from hardware environments, operation systems or network connection equipment. These indicators mainly focus on performance failures[5]. After investigating a large amount of civil and military software, researchers in [6] present that software functional failures (in other words, content failures) share the largest proportion of all software failures. However, to our best knowledge, there are not many researches focusing on functional failures found during our investigation Seer is proposed as an online failure prediction approach for functional failure in [7]. Seer uses a series of CPU parameters such as instruction numbers in cache as indicators to predict failures. The accuracy of failure mechanisms is close to 70%. Li uses module execution time and call times between each two modules as indicators to predict functional failures in [5]. Its accuracy is over 95%. However, every function and function calls in the software should be processed and too much data should be collected, stored, and calculated during failure mechanisms built process. This way may cause more resource consumption even performance issues.
To reduce resource consumption while ensuring the accuracy, we introduce software runtime entropy (execution time entropy and call times entropy), a novel type of indicators aiming at software functional failure prediction. Entropy theory is proposed by Shannon in 1948 to measure the uncertainty of information [8]. Entropy theory is combined with software runtime information (module execution duration and invocation times) to depict software runtime status. The correlations between runtime entropy and software functional failures are explored in this work aiming at assisting failure prediction work.
This paper consists of following parts: Section 2 introduces the related work of software failure indicators and entropy theory used in software domains. Section 3 gives the definitions of software runtime entropy. An empirical study used to explore the relationship between software runtime entropy and software failures is given in Section 4. In Section 5 we introduce a possible usage of runtime entropy as an indicator for software failure prediction. The final part is a conclusion of this paper.
2. Related Work
2.1. Existing Failure Indicators for Software Failure Prediction
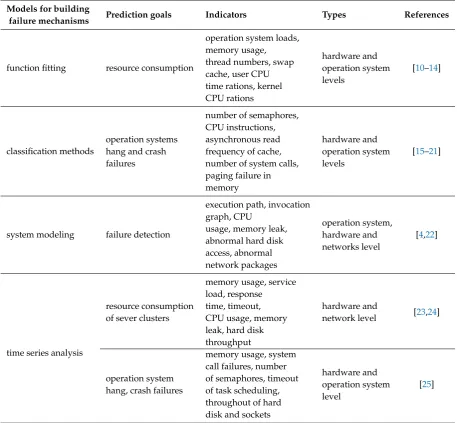
Existing failure indicators focus more on symptoms presented outside of software applications. Most of these indicators can be classified as following three levels: operation system level, network connection level and hardware environment level.
Table 1.Existing Research on Failure Indicators
Models for building
failure mechanisms Prediction goals Indicators Types References
function fitting resource consumption
operation system loads, memory usage, thread numbers, swap cache, user CPU time rations, kernel CPU rations
hardware and operation system levels
[10–14]
classification methods
operation systems hang and crash failures
number of semaphores, CPU instructions, asynchronous read frequency of cache, number of system calls, paging failure in memory
hardware and operation system levels
[15–21]
system modeling failure detection
execution path, invocation graph, CPU
usage, memory leak, abnormal hard disk access, abnormal network packages
operation system, hardware and networks level
[4,22]
time series analysis
resource consumption of sever clusters
memory usage, service load, response time, timeout, CPU usage, memory leak, hard disk throughput
hardware and
network level [23,24]
operation system hang, crash failures
memory usage, system call failures, number of semaphores, timeout of task scheduling, throughout of hard disk and sockets
hardware and operation system level
[25]
for application software[7,17,21]. This method uses ID3 model to classify data, but the final failure prediction rates of this method is only 50%.
2.2. Entropy Theory Used in Software Domains
Entropy theory is proposed by Shannon to measure the uncertainty of information in communication domains[8]. Researchers introduce entropy into software domains aiming at describing the degree of chaos of software systems. Existing researches mainly focus on three orientations:
• using entropy to measure the orderliness of software static structure; • to measure the change influence from project management aspects;
• to measure the state transformations during the software execution process.
Bansiya uses class as the basic element, use the frequency of name string to build the entropy measurement, and use it to represent the complexity of class[26]. This measurement is related with traditional measurements such as McCabe cycle complexity and number of defects in code. The author uses four large scale open source software (C++ Lang Parser, Win Framework, Graphics Lib 2.0, WinX Windows GUI) as experiment objects to do the analysis and prove the correlations between them. Similarly, Zhang extract neural networks model from software structures, using crossing entropy to locate errors in software[27]. Mannaert uses a hierarchical structure of the system, subsystems and components to model the whole system, calculates entropy of each elements in each level, and addresses the significance of entropy used in software maintenance and evolution[28].
Koutbi constructed software development entropy in [29] by using various activities and their probability distribution in software development process to measure the efficiency of software development activities. The availability of this quantity are also verified through two simulation methods. Hasson proposes an indicator to measure the software change activities from three perspectives of software: defect repair, routine general maintenance and introduction of new functions[30]. Arora used Hasson’s indicators to predict the release time of the next version solving NRP (Next Release Problem)[31].
Malik constructs information entropy to measure software performance failure of large scale software systems[32]. Several performance parameters are collected in a specific periods. Researchers fit the distribution of those parameters and calculate the information entropy. A series of open source applications are taken as examples to show the efficiency of this indicator when doing software anomaly detection. Miranskyy constructs entropy indicators from software execution trace[33]. Software function name and their appearance frequency are counted in this fast trace comparison algorithm. In addition, Hamou also uses entropy to help do the trace analysis work[34]. Wang proposes a DDoS detection method based on entropy via constructing the entropy indicators using IP address and their appearance frequency[35].
3. Constructing Software Runtime Entropy Indicators
Shannon proposes a definition of entropy to measure an information source[8]. For a given information sourceX={x1,x2,x3, . . .}, the appearance rates of each elementxiispi. Obviously, there
will always be:
i=n
∑
1
pi=1 (1)
The entropy of this information source can be calculated by equation2:
H=−
i=n
∑
i=1
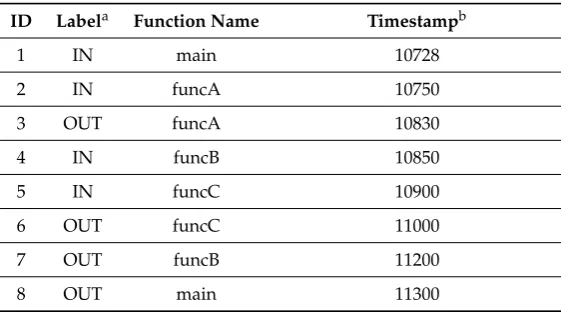
We construct two software runtime entropy indicators and use them to depict software execution statuses, then predict software functional failures. Execution trace is usually used to study the software execution process[33]. An example of execution trace is showed in Table2.
Table 2.An Example of Software Execution Trace
ID Labela Function Name Timestampb
1 IN main 10728
2 IN funcA 10750
3 OUT funcA 10830
4 IN funcB 10850
5 IN funcC 10900
6 OUT funcC 11000
7 OUT funcB 11200
8 OUT main 11300
aThe label marks if the data collected from the entrance or exit of the function modules.
bTimestamp presents the time when obtain this line of data.
We use two parameters to construct software runtime entropy indicators: function module execution duration time and call times between each two modules. Software execution duration time TDurationcan be calculated using equation3:
TDuration =TOut−TIn−TSubModuleDuration (3)
WhileTOutdenotes the time when exit a specific function andTIndenotes the time when enter
a specific function. TSubModuleDuration denotes the submodule execution duration time and can be
calculated using equation4:
TSubModuleDuration =TSubOut−TSubIn (4)
Considering equation1, the sum of each element appearance rates in an information source is 1. So we definepiin equation2as the proportion of different modules’ execution time in total software
execution time. Asαiin equation5:
αi=
TiDuration ∑k=n
k=1TkDuration
(5)
The software execution time entropy can be defined as6:
Ht=− i=n
∑
i=1
αilog(αi) (6)
The software call times entropy can be defined as7:
Hc=− i=m,j=n
∑
i=1,j=1
Whileβi→jcan be calculated by8:
βi→j=
Ni→j
∑k=m
k=1 ∑ll==n1Nk→l
(8)
4. Correlation Analysis Between Software Run-time Entropy and Failures
After defining software runtime entropy, we design a series of fault injection experiments to collect software runtime trace information to calculate the values of the indicators we introduce above. Failure information is also collected in this process. The entropy values will be marked asfailurewith a tagYornormalwith a tagN. Then those data will be imported into a classification model named C4.5 to train a classifier which can be used to do the prediction work.
4.1. A Brief Introduction of Experiment Software Objects
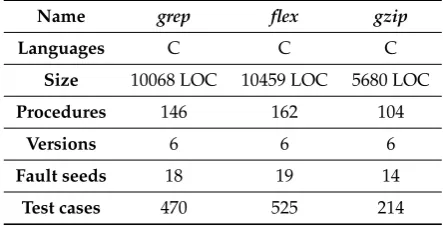
The three software objects used in this work aregrep,flex,gzip. All of these three applications can be obtained from the Software-artifact Infrastructure Repository (SIR)[36].grepis a command-line utility for searching plain-text data sets for lines that match a regular expression. flex(fast lexical analyzer generator) is a free and open-source software alternative to lex.[2] It is a computer program that generates lexical analyzers (also known as "scanners" or "lexers"). gzip is a file format and a software application used for file compression and decompression. More bases of those three objects can be found in Table3.
Table 3.Basic Information of Three Software Applications
Name grep flex gzip
Languages C C C
Size 10068 LOC 10459 LOC 5680 LOC
Procedures 146 162 104
Versions 6 6 6
Fault seeds 18 19 14
Test cases 470 525 214
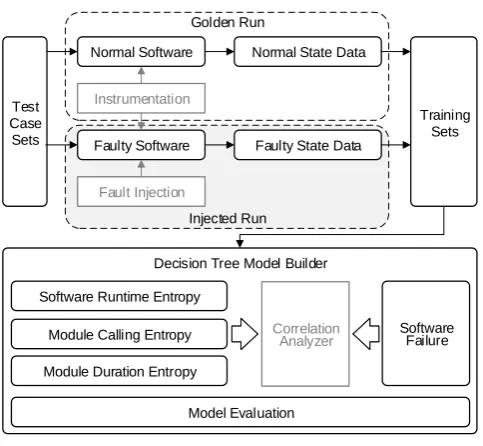
4.2. Framework of the Empirical Study
Injected Run Golden Run
Normal Software
Faulty Software
Instrumentation
Fault Injection
Test Case
Sets
Normal State Data
Faulty State Data
Training Sets
Decision Tree Model Builder
Software Runtime Entropy
Module Calling Entropy
Module Duration Entropy
Software Failure
Correlation Analyzer
Model Evaluation
Figure 1.Framework of the empirical study.
Firstly, we use macro compile methods add fault seeds in source code, and design test case to trigger those faults. These process are shown in Figure2.
Training Sets
Contrast Group
Fault Injection Normal Software
Software with Fault #1
Software with Fault #2
Software with Fault #3 …… Software with Fault #n Original
Software
Instrumentation
Normal Data
Faulty Data #1
Faulty Data #2
Faulty Data #3 …… Faulty Data #n Execution
Test Case Sets
Experiment Group
Test Cases Design
Figure 2.Process of fault injection experiments.
Secondly, we preprocess the traces obtained from the experiments. Two kinds of runtime entropy indicators are calculated in these process and marked asfailurewith aYornormalwith aN. Table4
shows an example of the data after preprocessing.
Table 4.An Example of the Data After Preprocessing
ID Execution time entropyHt Call Times entropyHc Tag
1 125 121 Y
2 328 320 N
3 451 460 Y
Then, a decision tree model named C4.5 is used to train the classification model to explore the relationship between runtime entropy and software functional failures. Some common used parameters for model verification, like confusion matrix, accuracy, F-measure, are used to verify the decision model.
4.3. Correlation Analysis
Execution results of the fault injection experiments are shown in Table5.
Table 5.Execution Results of Three Software Objects
Software Failed Execution Normal Execution Total Execution
grep 755 8133 8888
flex 4663 587 5250
gzip 185 3025 3210
The data is preprocessed into the format as table4shows. Using decision tree classification algorithm C4.5, the data obtained from fault injection experiments are analyzed separately. 10 folds cross validation method is chosen to reduce the deviation caused by data selection. The data of each software is divided into 10 parts. Nine of them are used as training sets and the other one is used as test set in the process of building decision tree. This process is repeated 10 times, so that each part participates in the process of building decision tree as training sets.
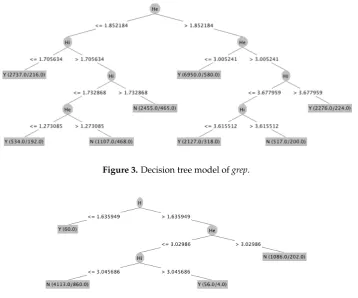
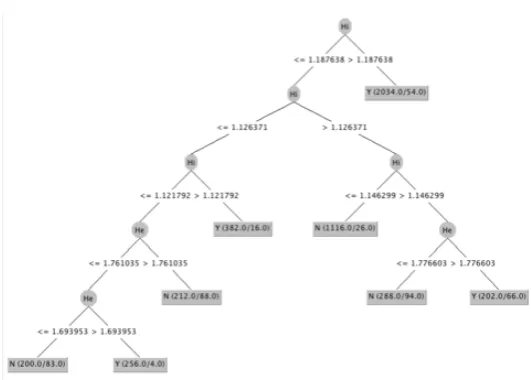
The decision trees of three software objects are shown in Following three figures.grepin Figure3, flexin Figure4, andgzipin Figure5.
Figure 3.Decision tree model ofgrep.
Figure 5.Decision tree model ofgzip.
4.4. Model Validation
After obtaining the decision tree models, we need to examine whether the models can truly reflect the relationship between variables involved when building the model (the relationship between software runtime entropy and software failures). Some common used measurements in machine learning areas are selected to evaluate the accuracy of these models.
Confusion matrix is used first as shown in Table6.
Table 6.Confusion Matrix
Classified as true (failure) Classified as false (normal)
Real true True Positive (TP) False Negative (FN)
Real false False Positive (FP) True Negative (TN)
The confusion matrix of three decision trees are shown in equation9,10, and11respectively.
Y N
13204 123 Y 250 3226 N
(9)
Y N
4107 143 Y 34 2137 N
(10)
Y N
12735 290 Y 190 1475 N
(11)
True Positive Rates (TPR) refer the percentage of the failure data that classified as failure among total failure data, as equation12shows.
TPR= TP
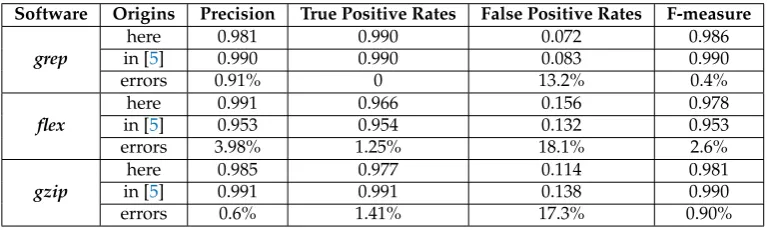
Table 7.Measurements and Comparison
Software Origins Precision True Positive Rates False Positive Rates F-measure
grep
here 0.981 0.990 0.072 0.986
in [5] 0.990 0.990 0.083 0.990
errors 0.91% 0 13.2% 0.4%
flex
here 0.991 0.966 0.156 0.978
in [5] 0.953 0.954 0.132 0.953
errors 3.98% 1.25% 18.1% 2.6%
gzip
here 0.985 0.977 0.114 0.981
in [5] 0.991 0.991 0.138 0.990
errors 0.6% 1.41% 17.3% 0.90%
False Positive Rates (FPR) is given in equation13.
FPR= FP
FP+TN (13)
Precision and F-measure can be calculated using equation14,15respectively. We useβ=1 (i.e. F1) in this paper.
Precision= TP
TP+FP (14)
F−measure= (1+β
2)TP×Precision
β2Precision+TP (15)
The results of above measurements and the comparison with the results in [5] are shown in Table
7.
The runtime entropy indicators of three software objects show a strong correlation with the occurrence of software failures. Ingrepandgzip, the ratio of normal runs to failure runs is relatively uniform. TPR and FPR of the model are in the normal range and have good classification results. In flex, the failure execution numbers is much larger than normal runs. The unbalanced data make the results have a higher FPR than the other two applications and cause more false alarms.
The results in the Table7also show that software entropy indicators have the equal accuracy with the indicators proposed in [5]. During the process we training data, there are only two features in our model. While in [5], there are so many features which make the training process more complex and consume more resource and time. The entropy indicators are calculated during software execution process which cost less storage to store large quantitive data like the methods in [5]. There will also be a same circumstance in runtime prediction process.
5. A Possible Approach to Apply the Decision tree into Failure Prediction Work
In this section, we give a possible method to apply the decision tree model into failure prediction work.
The entropy indicators are continue calculated during software execution according to equation
16and17. By this way, we get two functions to depict entropy indicators changing against time.
Ht(t) =− i=n
∑
i=1
αi(t)log(αi(t)) (16)
Hc(t) =− i=m
∑
i=1
j=n
∑
j=1
While theαi(t)in equation16can be calculated using equation18.Ti(t)denotes that in a specific time
t, the accumulating execution time ofithmodule. The total numbers of modules isn.
αi(t) = Ti (t)
∑k=n k=1Tk(t)
(18)
Theβi→j(t)can be calculated using equation19.
βi→j(t) =
Ni→j(t)
∑k=m
k=1 ∑ll==n1Nk→l(t)
(19)
TheNi→j(t)means that in a specific timet, the total numbers that theith module calls thejth
module.
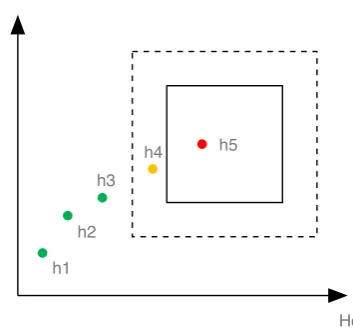
The decision tree model can be transform into a series of areas Hf ailed in R2. When the
point H(ti) = (Ht(ti),Hc(ti)) is in the areas Hf ailed, it means the system has failed. We choose a
neighborhood ofHf ailednamedHδ. When the point is in theHδ, we make a warning and predict that the system will failed in a short period of time. The prediction process is shown in Fig.6. We make a warning at pointH4.
Ht
Hc h1
h2 h3
h4 h5
Figure 6.Principle of failure prediction using decision tree model.
6. Conclusions
Two indicators for software functional failure prediction are proposed in this work, software runtime execution time entropy and software runtime call times entropy.
Two indicators are well defined according to Shannon’s Entropy Theory. A series of fault injection experiments are designed to obtain runtime information to calculate those two indicators. By this way, the issue that lacking for real data has been addressed.
Those data are processed and trained with a machine learning algorithm named C4.5. After the training process, we obtain decision tree models and use a series common measurements to validate the models. The results show that there is a strong correlation between software entropy indicators and software failures. We also make a comparison with another similar work. The results of comparison shows that our indicators own the equal accuracy and consume much less time and resource.
Author Contributions:Conceptualization, Shiyi Kong and Minyan Lu; Data curation, Shiyi Kong; Investigation, Shiyi Kong and Bo Sun; Methodology, Shiyi Kong; Software, Shiyi Kong and Bo Sun; Supervision, Minyan Lu; Validation, Shiyi Kong and Minyan Lu; Writing - original draft, Shiyi Kong; Writing - review & editing, Shiyi Kong and Minyan Lu.
Funding: This research was funded in part by the Funding of the Key Laboratory on Reliability and Environmental Engineering Technology under Grant No. 614200404011017, in part by the Advanced Research Domains Funding under Grant No. JZX7Y20190242013901.
Conflicts of Interest:The authors declare no conflict of interest. The funders had no role in the design of the study; in the collection, analyses, or interpretation of data; in the writing of the manuscript, or in the decision to publish the results.
Abbreviations
The following abbreviations are used in this manuscript:
S-PHM Software Prognostic Health Management NRP Next Release Problem
SIR Software-artifact Infrastructure Repository
References
1. Feiler, P.H.; Goodenough, J.B.; Gurfinkel, A.; Weinstock, C.B.; Wrage, L. Reliability validation and improvement framework. Technical report, Carnegie-Mellon Univ Pittsburgh Pa Software Engineering Inst, 2012.
2. Srivastava, A.N.; Schumann, J. The Case for Software Health Management. 2011 IEEE Fourth International Conference on Space Mission Challenges for Information Technology, 2011, pp. 3–9. doi:10.1109/SMC-IT.2011.14.
3. Salfner, F.; Lenk, M.; Malek, M. A Survey of Online Failure Prediction Methods. ACM Comput. Surv.2010, 42, 10:1–10:42. doi:10.1145/1670679.1670680.
4. Kiciman, E.; Fox, A. Detecting application level failures in component based Internet services. IEEE Transactions on Neural Networks2005,16, 1027–1041. doi:10.1109/TNN.2005.853411.
5. Li, L.; Lu, M.; Gu, T. Extracting Interaction-Related Failure Indicators for Online Detection and Prediction of Content Failures. 2018 IEEE International Symposium on Software Reliability Engineering Workshops (ISSREW), 2018, pp. 278–285. doi:10.1109/ISSREW.2018.00019.
6. Grottke, M.; Nikora, A.P.; Trivedi, K.S. An empirical investigation of fault types in space mission system software. 2010 IEEE/IFIP International Conference on Dependable Systems Networks (DSN), 2010, pp. 447–456. doi:10.1109/DSN.2010.5544284.
7. Ozcelik, B.; Yilmaz, C. Seer: A Lightweight Online Failure Prediction Approach. IEEE Transactions on Software Engineering2016,42, 26–46. doi:10.1109/TSE.2015.2442577.
8. Shannon, C.E. A Mathematical Theory of Communication.Bell System Technical Journal1948,27, 379–423. doi:10.1002/j.1538-7305.1948.tb01338.x.
9. Li, L.; Lu, M.; Gu, T. A Systematic Modeling Approach for Failure Indicators of Complex Software Intensive Systems. 2018 12th International Conference on Reliability, Maintainability, and Safety (ICRMS), 2018, pp. 43–51. doi:10.1109/ICRMS.2018.00019.
10. Andrzejak, A.; Silva, L. Deterministic Models of Software Aging and Optimal Rejuvenation Schedules. 2007 10th IFIP/IEEE International Symposium on Integrated Network Management, 2007, pp. 159–168. doi:10.1109/INM.2007.374780.
11. Hoffmann, G.A.; Trivedi, K.S.; Malek, M. A Best Practice Guide to Resource Forecasting for Computing Systems. IEEE Transactions on Reliability2007,56, 615–628. doi:10.1109/TR.2007.909764.
12. Pellegrini, A.; Sanzo, P.D.; Avresky, D.R. A Machine Learning-Based Framework for Building Application Failure Prediction Models. 2015 IEEE International Parallel and Distributed Processing Symposium Workshop, 2015, pp. 1072–1081. doi:10.1109/IPDPSW.2015.110.
14. Vaidyanathan, K.; Trivedi, K.S. A measurement-based model for estimation of resource exhaustion in operational software systems. Proceedings 10th International Symposium on Software Reliability Engineering, 1999, pp. 84–93. doi:10.1109/ISSRE.1999.809313.
15. Irrera, I.; Vieira, M. A Practical Approach for Generating Failure Data for Assessing and Comparing Failure Prediction Algorithms. 2014 IEEE 20th Pacific Rim International Symposium on Dependable Computing, 2014, pp. 86–95. doi:10.1109/PRDC.2014.19.
16. Irrera, I.; Duraes, J.; Madeira, H.; Vieira, M. Assessing the Impact of Virtualization on the Generation of Failure Prediction Data. 2013 Sixth Latin-American Symposium on Dependable Computing, 2013, pp. 92–97. doi:10.1109/LADC.2013.24.
17. Yilmaz, C.; Porter, A. Combining Hardware and Software Instrumentation to Classify Program Executions. Proceedings of the Eighteenth ACM SIGSOFT International Symposium on Foundations of Software Engineering; ACM: New York, NY, USA, 2010; FSE ’10, pp. 67–76. doi:10.1145/1882291.1882304. 18. Irrera, I.; Vieira, M. Towards Assessing Representativeness of Fault Injection-Generated Failure Data for
Online Failure Prediction. 2015 IEEE International Conference on Dependable Systems and Networks Workshops, 2015, pp. 75–80. doi:10.1109/DSN-W.2015.24.
19. Irrera, I.; Duraes, J.; Vieira, M.; Madeira, H. Towards Identifying the Best Variables for Failure Prediction Using Injection of Realistic Software Faults. 2010 IEEE 16th Pacific Rim International Symposium on Dependable Computing, 2010, pp. 3–10. doi:10.1109/PRDC.2010.51.
20. Irrera, I.; Pereira, C.; Vieira, M. The Time Dimension in Predicting Failures: A Case Study. 2013 Sixth Latin-American Symposium on Dependable Computing, 2013, pp. 86–91.
21. Yilmaz, C.; Paradkar, A.; Williams, C. Time will tell. 2008 ACM/IEEE 30th International Conference on Software Engineering, 2008, pp. 81–90. doi:10.1145/1368088.1368100.
22. Sauvanaud, C.; Silvestre, G.; Kaâniche, M.; Kanoun, K. Data Stream Clustering for Online Anomaly Detection in Cloud Applications. 2015 11th European Dependable Computing Conference (EDCC), 2015, pp. 120–131. doi:10.1109/EDCC.2015.22.
23. Meng, H.; Qi, Y.; Di Hou.; Chen, Y. A Rough Wavelet Network Model with Genetic Algorithm and its Application to Aging Forecasting of Application Server. 2007 International Conference on Machine Learning and Cybernetics, 2007, Vol. 5, pp. 3034–3039. doi:10.1109/ICMLC.2007.4370668.
24. Hong, B.; Peng, F.; Deng, B.; Hu, Y.; Wang, D. DAC-Hmm: detecting anomaly in cloud systems with hidden Markov models.Concurrency and Computation: Practice and Experience,27, 5749–5764. doi:10.1002/cpe.3640. 25. Crowell, J.; Shereshevsky, M.; Cukic, B. Using fractal analysis to model software aging. Technical report,
Technical report, West Virginia University, Lane Department of CSEE, 2002.
26. Bansiya, J.; Davis, C.; Etzkorn, L. An entropy-based complexity measure for object-oriented designs. Theory and Practice of Object Systems 1999, 5, 111–118. doi:10.1002/(SICI)1096-9942(1999)5:2<111::AID-TAPO4>3.0.CO;2-0.
27. Zhang, X.; Ben, K.; Zeng, J. Cross-Entropy: A New Metric for Software Defect Prediction. 2018 IEEE International Conference on Software Quality, Reliability and Security (QRS), 2018, pp. 111–122. doi:10.1109/QRS.2018.00025.
28. Mannaert, H.; Bruyn, P.; Verelst, J. Exploring Entropy in Software Systems: Towards a Precise Definition and Design Rules. The Seventh International Conference on Systems (ICONS 2012), 2012, pp. 93–99. 29. El Koutbi, S.; Idri, A.; Abran, A. Empirical evaluation of an entropy-based approach to estimation variation
of software development effort.Journal of Software: Evolution and Process,31, e2149. doi:10.1002/smr.2149. 30. Hassan, A.E. Predicting Faults Using the Complexity of Code Changes. Proceedings of the 31st
International Conference on Software Engineering; IEEE Computer Society: Washington, DC, USA, 2009; ICSE ’09, pp. 78–88. doi:10.1109/ICSE.2009.5070510.
31. Arora, H.D.; Sahni, R.; Parveen, T. Prototype Evidence for Estimation of Release Time for Open-Source Software Using Shannon Entropy Measure. Proceedings of Fifth International Conference on Soft Computing for Problem Solving; Pant, M.; Deep, K.; Bansal, J.C.; Nagar, A.; Das, K.N., Eds.; Springer Singapore: Singapore, 2016; pp. 683–690.
32. Malik, H.; Shakshuki, E.M. Detecting Performance Anomalies in Large-scale Software Systems Using Entropy. Personal Ubiquitous Comput.2017,21, 1127–1137. doi:10.1007/s00779-017-1036-y.
34. Hamou-Lhadj, A. Measuring the Complexity of Traces Using Shannon Entropy. Fifth International Conference on Information Technology: New Generations (itng 2008), 2008, pp. 489–494. doi:10.1109/ITNG.2008.169.
35. Wang, R.; Jia, Z.; Ju, L. An Entropy-Based Distributed DDoS Detection Mechanism in Software-Defined Networking. 2015 IEEE Trustcom/BigDataSE/ISPA, 2015, Vol. 1, pp. 310–317. doi:10.1109/Trustcom.2015.389.