Article
1
Family functioning, emotional intelligence and
2
values: analysis of the relationship with aggressive
3
behavior in adolescents
4
María del Carmen Pérez-Fuentes1,*, María del Mar Molero 1, Ana Belén Barragán 1 and José Jesús
5
Gázquez Linares 1
6
1 University of Almería, 04120 Almería, Spain; [email protected] (M.d.M.M.J.); [email protected] (A.B.B.M.);
7
[email protected] (J.J.G.L.)
8
2 Universidad Autónoma de Chile, Región Metropolitana, Providencia 7500000, Chile
9
* Correspondence: [email protected]; Tel.: +34-950-015-598
10
11
Abstract: Aggressive behavior in adolescence is influenced by a diversity of individual, family and
12
social variables. The purpose of this study was to analyze the relationship between family
13
functioning, emotional intelligence and values for development of different types of aggression, as
14
well as to establish profiles according to the predictor variables of aggression. To do this, a sample
15
of 317 high school students aged 13 to 18 were administered the Peer Conflict Scale, the Family
16
Functionality Scale, the Brief Emotional Intelligence Inventory for Senior Citizens and the Values
17
for Adolescent Development Scales. The study showed that stress management, positive adolescent
18
development and family functioning predominated in nonaggressive subjects with higher scores
19
than aggressors. There was also a negative relationship between the different types of aggression
20
and emotional intelligence, positive values and family functioning. In addition, two different
21
profiles were found. The first had low scores on all the variables, while the second profile had higher
22
scores on all the variables except family functioning which was higher.
23
Keywords: family functioning; aggressive behavior; emotional intelligence; adolescent values
24
25
1. Introduction
26
Violent behavior among secondary students has been identified as a serious problem in today’s
27
educational field [1], in this sense we can find an increment in the number of researches dedicated to
28
this topic within the scientific literature [2, 3]. At the moment, the studies conducted in several
29
countries point that the prevalence of these behaviors among the youth has increased [4, 5], and it
30
appears as a risk, for the students that do not show this kind of behaviors, and for the educational
31
actions of the educational establishments [6]. Taking into account the difficulties that we can find in
32
this context, it is necessary to know the quality of the scholar cohabitation when planning actions and
33
creating resources [7].
34
35
1.1.Violent behavior in the school environment
36
In the school framework we can find patterns of violent behavior, at physical and verbal levels,
37
and both can be split into two types: direct and indirect. A direct physical aggression refers to, for
38
example, hitting someone, and the indirect physical aggression to stealing someone [8]. A direct
39
verbal aggression implies the insults between the actors implicated in these situations, while
40
speaking negatively about someone behind their backs will be considered as an indirect verbal
41
aggression [9].
42
Likewise, aggressions can be classified depending on the method used to cause damage,
43
separating the forms and the functions of the aggressive behavior [10]. As regards the forms, open
44
aggressions manifest themselves in physical and verbal aggressive conducts, such as the threats, the
45
hits, and the relational aggressions that damage social inclusion in a group, through actings for the
46
social exclusion [11]. Concerning the functions, a reactive aggression is characterized by a revenge
47
conduct that appears as a response to a provocation, while the proactive aggression does not need a
48
provocation to apply [12]. Both kinds of aggression have been investigated in both teenagers and
49
children at a scholar age. In the Manring, Elledge, Swails, y Vernberg study [13], for the primary level,
50
reactive aggression was pointed as a longitudinal predictor of the victimization among pairs, being
51
more frequent among girls. In the same way, individual factors are linked to the relational aggression
52
of girls, being this one an indicator of this type of problematic behavior [14]. Moreover, some
53
differences are to point with regard to the gender in the several types of aggression [15], where the
54
boys represented are more likely to reactive and proactive aggressions than the girls [16,17]. On the
55
other hand, van Hazebroek, Olthof, and Goossens [18] confirmed a higher level of reactive aggressive
56
behavior in the group of boys than in the groups of girls, and they did not find any difference of
57
gender within the proactive aggression.
58
The differences on the nature of aggressions depend on the profile of both the victim and the
59
aggressor. Jara, Casas, and Ortega-Ruiz [19] suggest that aggressors have proactive aggressive
60
behaviors, even when the reactive aggressions are present in the victims. Depending on the gender
61
of aggressors, there is no consensus about relational violence among the studies conducted. Ettekal
62
and Ladd [20] point the feminine group as the leader in the relational violence. Nevertheless, other
63
studies do not find any significant differences between men and women.
64
65
1.2.Variables related to aggressive behavior
66
Adolescence is a developmental period characterized by experimentation and sensations
67
seeking associated to impulsivity [21]. On the other hand, aggressions among teenagers are
68
associated to individual, academic, family and social factors [22]. Aggressive behaviors are connected
69
to personal al social values [23, 24]. Due to Jara et al. [19], social values have a higher scope for
70
aggressors than for victims, personal values are relevant for both agents, and individual values are
71
higher for aggressors and lower for victims. Plus, these authors underline the relationship between
72
being and not being part of aggressive conducts and social, personal and individual values.
73
Aggressive conducts are related to different variables among which we count the emotional and
74
the social ones [25]. In the study conducted by Zych, Beltrán-Catalán, Ortega-Ruiz, and Llorent [26],
75
bullying aggressors were indicated to have low levels of social and emotional competences, while the
76
victims of bullying achieve identical results than the students not involved. Thus, research about
77
emotional intelligence in victims and aggressors proves that victims present a lower emotional
78
intelligence, meaning that they have a lower capacity to handle stressing situations, the aggressors,
79
they also show low levels of emotional intelligence and a deficient stress manage [27]. At the same
80
time, several authors note that a bad emotional regulation is a characteristic of reactive aggressions
81
[28, 17].
82
In the scope of family dynamic, it has been confirmed that aggressive behaviors are related to
83
family functioning [29]. Parents represent a source of influence over the youth behavior [30, 31],
84
together with the peer group, since sensitive environments, where conflict reigns, critics and insults,
85
and lack of affection, can leed to aggressive behaviors, not linking the consequences to such behaviors
86
[32]. According to the studies conducted so far, the profile of parenting characterized by the use of
87
physical and verbal aggressions together with hostile behaviors are connected to both functions of an
88
aggression: reactive and proactive. In this sense, a negative parenting and a dysfunctional
89
atmosphere is associated to the presence of proactive and reactive aggressions [33].
90
In the review of the literature, it is confirmed that the connexion between the aggression
91
modalities and some variables such as the emotional intelligence, the values, and the family
92
functioning, if the rapport among them is negative [34], social and personal values are reduced [35],
93
and there is a higher risk of family dysfunction [36].
94
Nowadays, the number of studies establishing the profile of subjects relying on the modalities
95
of aggression is limited [37], as well as the relation between modalities and emotional intelligence,
96
98
1.3.The present study
99
This study analyses the relationship between emotional intelligence, development values and
100
family functioning within the diverse modalities of aggressive behaviors. At the same time, some
101
profiles will be drown according to the variables predicting an aggression taking into account the
102
diverse modalities of aggression.
103
Specifically, according to previous research, some hypothesis are put forward: (1) Students that
104
result to be aggressors present a higher score in all the modalities of aggressions than the not
105
aggressors students; (2) emotional intelligence, values and family functioning are the variables
106
predicting the emergence of aggressive conducts in the study sample.
107
2. Materials and Methods
108
2.1. Participants
109
The study is based on data collected randomly by using multi-stage cluster samples. Out of 317
110
youth from different high schools in the province of Almería, Spain, 50.8% (n=161) were male and
111
49.2% (n=156) were females. Students were between 13 and 18 years old (M=14.93; DT=1,065). The
112
average age of males was 14.85 (DT= 1,008) and 15.01 (DT= 1.119) for females. The sample was
113
constituted by two class levels, 61.5% (n=195) belonged to tenth grade and 38.5% (n=122) belonged to
114
eleventh grade.
115
116
2.2. Instruments
117
An ad hoc questionnaire collecting sociodemographic data (age, gender, grade), and some
118
questions about the students implication on violent situations among pairs in the scholar
119
environment was employed (do you suffer/have suffered violent episodes by your classmates?, do
120
you exercise/have exercised violence over your classmates?, have you witnessed violence exercised
121
over your classmates?, have you intervened when seeing someone using violence against your
122
classmates?).
123
Peer Conflic Scale (PCS) [38]. The Spanish adaptation from Pérez-Fuentes et al. [39] was used. This
124
scale evaluates the open and relational forms as well as reactive and proactive functions. It is
125
constituted by 40 items, where a Likert-type scale made of 4 points is employed for responses (0
126
equals to not right at all and 3 equals to completely right). In the study of Gázquez et al. [40] an
127
internal consistency was found for each one of the scales (physical and reactive α=0.86; physical and
128
proactive α=0.85; reactive and relational α=0.80; proactive and relational α=0.83. In our case, the
129
reliability for each scale was of: .81 in proactive open aggressions; .85 in open reactive aggressions,;
130
.81 in relational proactive aggressions and .78 in relational reactive aggressions. In general, the scale
131
reliability was of α= .92.)
132
Family Functioning Scale (APGAR) [41]. The Spanish adaptation of the original version was used
133
here [42]. This scale is made of 5 items, evaluating the adaptation, growth, society, affection and
134
resolution, with three options of response (0 = hardly ever, 1 = sometimes, 2 = quite often). There are
135
also three categories of functionality that are: severe dysfunction (0 to 3), moderate dysfunction (4 to
136
6) and family function (6 or more). In the study conducted by Romero-Abrio et al. [43] the reliability
137
was of α= 0.80. In our paper, Cronbach’s alpha was of .75.
138
Brief Emotional Intelligence Inventory for Senior Citizens (EQ-I-M20) [44]. The adaptation by
Pérez-139
Fuentes, Gázquez, Mercader, y Molero [45] was used here since it was validated and measured on
140
the Spanish adult population. This inventory is composed by 20 items, divided in 5 factors:
141
Intrapersonal, Interpersonal, Stress management, Adaptability and State of mind. Responses are
142
based on a Likert-type scale of 4 points. The original version got an adequate consistency of 0.89 [44].
143
In the brief version, Cronbach’s alpha was .57 for the intrapersonal factor, .80 for the interpersonal
144
factor, .68 for the stress management, .81 for the adaptability and .83 for the state of mind. In the
145
investigation conducted by Bermúdez, Méndez, and García-Munuera [46] the instrument reliability
146
obtained with a Cronbach’s alpha was .89 and in every subcategory was of : α=.80 Interpersonal; .57
147
internal consistency of the instrument was of .78., and for every sub-scale of: α=.77 Intrapersonal, α=
149
.67 Interpersonal, α= .76 Stress management, α=.46 Adaptability and α= .83 State of mind.
150
Escala de Valores para el Desarrollo Positivo Adolescente (EV-DPA) [47] is constituted of 24 items that
151
evaluate the importance that youth gives to values for their positive development. Responses
152
correspond to a scale going from 1 to 7 where 1 is “not important at all” and 7 is “the most important”.
153
The scale is composed by three dimensions: social values, personal values, and individualist values,
154
which obtained the following reliability levels: social values: α=.88; personal values α=.83 and
155
individualist values α=.79. For the general scale the Cronbach’s alpha obtained was of .91. In the
156
research of Cortés-Morales, Valdez-Menchaca, Vázquez, and Hernández-Gutiérrez [48] the reliability
157
of the scale was α=.89.
158
159
2.3. Procedure
160
In the first place the responsible persons directing the secondary educational centers were
161
contacted in order to inform them about the objectives, methodology and use of data, as well as to
162
get their authorization. In the second place, the students were announced that the participation was
163
based on volunteers and they were briefed with the instructions to fulfill the questionnaire. Plus,
164
there were notified that the data was going to be collected anonymously and confidentially.
165
Nevertheless, every participant had the possibility to give their informed consent in order to ratify
166
the respect of the ethics in this research. The study was approved by the Bioethics Committee of the
167
University of Almería.
168
169
2.4. Data Analyses
170
For the treatment and analysis of data the statistical package SPSS version 23.0 for Windows was
171
employed.
172
First, a descriptive analysis is presented, and, in order to explore the relationship between the
173
variables, analyses of bivariate correlations are performed. After that, linear regression analyses
174
stepwise were performed. The modalities of aggression were used as dependent variables (open
175
proactive aggression, open reactive aggression, relational proactive aggression, and relational
176
reactive aggression). The variable used as predictors were: emotional intelligence, values for the
177
positive teenage development and family functioning. Precisely, for the estimation of each model of
178
regression all variables correlating with the dependent variable are included.
179
Finally, a two-stage sample was implemented in order to determine de the diverse profiles,
180
relying on the variables that were finally included in every regression model. After classification of
181
groups with conclusions drown from clusters, a comparative study of the average is performed
182
through the Student's t-distribution for independent samples, that enables to know the differences
183
existing between clusters in relation to the modalities of aggression, and through the Cohen's d for
184
determining the size of the effect.
185
3. Results
186
3.1. Aggressive conducts in secondary compulsory education students: descriptive analysis
187
From the total of the sample, 13.6% (n=43) had suffered or are currently suffering episodes of
188
violence from their classmates. On the other hand, 12.9% (n=41) have exercised or exercise some kind
189
of violence over their classmates. 65.3% (n=207) have witnessed violent episodes between classmates.
190
Taking into account the distribution by the gender of the aggressors, 78% (n=32) are males and
191
22% (n=9) are females. In the group of victims, 55.8% (n=24) are males and 44.2% (n=19) are females.
192
Besides that, the average scores obtained in the total sample, for every dimension of aggression,
193
were al follows: Open proactive aggression, (M=.24; DT=.37), Open reactive aggression (M=.55;
194
DT=.54), Relational proactive aggression, (M=.22; DT=.35), and Relational reactive aggression (M=.30;
195
DT=.37). As concerns the gender, there are significant differences within the open proactive
196
aggressions (t(315)=3.36; p<.01; d=.38), males getting higher scores (M=.30; DT=.43) compared to females
(M=.16; DT=.28). For the relational proactive aggression, males (M=.27; DT=.41) present significantly
198
higher values (t(315)=2.38; p<.05; d=.27) than females (M=.18; DT=.28).
199
In the aggressor’s group, average scores are significantly higher for every modality of
200
aggression. [Open proactive aggression (t(315)=3.66; p<.01; d=.61); Open reactive aggression (t(315)=4.58;
201
p<.001; d=.77); Relation proactive aggression (t(315)=3.39; p<.01; d=.57), Relational reactive aggression
202
(t(315)=2.40; p<.05; d=.40)] compared to the non aggressors group. Concerning the group of victims,
203
they obtain a significant higher average in terms of open reactive aggression (t(315)=1.99; p<.05; d=.33)
204
compared to the group of non-victims.
205
With regards to the age of the participants, there is no correlation established in accordance to
206
the modality of aggression analyzed here.
207
3.2. Emotional intelligence, values and family functioning: relation to the aggression
208
Results derived from the correlational analysis, as shown in table 1, indicate that open proactive
209
aggression has a negative correlation with most of the emotional intelligence factors. (Intrapersonal:
210
r=-.13; p<.05; Interpersonal: r= -.18; p<.01; Stress management: r= -.20; p<.001; State of mind: r= -.15;
211
p<.01), social values(r= -.26; p<.001), personal values (r= -.26; p<.001), and family function (r= -.20;
212
p<.001).
213
Open reactive aggression shows negative correlations with stress management (r= -.41; p<.001),
214
social values (r= -.17; p<.01), personal values (r= -.15; p<.01), and family function (r= -.17; p<.01).
215
For the relational proactive aggression, some negative correlations are also observed concerning
216
the emotional intelligence dimensions (Intrapersonal: r= -.13; p<.05; Interpersonal: r= -.20; p<.001;
217
Stress management: r= -.17; p<.01), social values (r= -.24; p<.001), personal values (r= -.24; p<.001), and
218
family function (r= -.18; p<.01).
219
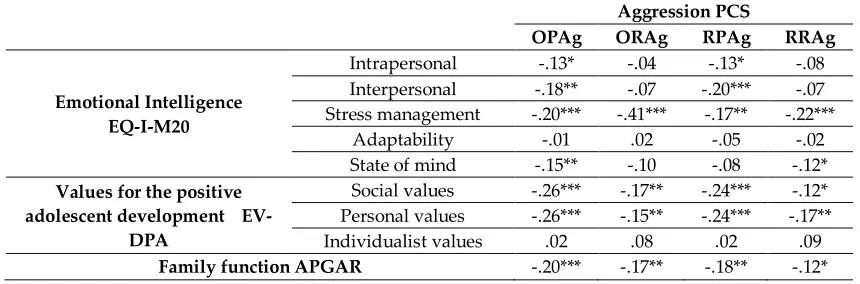
Table 1. Correlation between the modalities of aggression and emotional intelligence variables,
va-220
lues and family function.
221
Aggression PCS
OPAg ORAg RPAg RRAg
Emotional Intelligence EQ-I-M20
Intrapersonal -.13* -.04 -.13* -.08
Interpersonal -.18** -.07 -.20*** -.07 Stress management -.20*** -.41*** -.17** -.22***
Adaptability -.01 .02 -.05 -.02
State of mind -.15** -.10 -.08 -.12* Values for the positive
adolescent development EV-DPA
Social values -.26*** -.17** -.24*** -.12* Personal values -.26*** -.15** -.24*** -.17**
Individualist values .02 .08 .02 .09
Family function APGAR -.20*** -.17** -.18** -.12* OPAg = Open proactive aggression; ORAg = Open reactive aggression; RPAg = Relation proactive
222
aggression; RRAg = Relational reactive aggression. *p<.05; **p<.01; ***p<.001
223
Finally, relational reactive aggression has a negative correlation with stress management (r=
-224
.22; p<.001), state of mind (r= -.12; p<.05), social values (r= -.12; p<.05), personal values (r= -.17; p<.01),
225
and family function (r= -.12; p<.05).
226
Based on the results of the correlation analysis, multiple regression models are drown for every
227
modality of aggression, taking into account, in each case, the variables where correlations were
228
detected and introducing them as potential predictors in1 the model.
229
3.3. Multiple linear regression model: Open proactive aggression
230
Due to the data obtained in table 2, the regression analyses shows 3 models where the third is
231
the most exploitable one, with 12.7% (R2=.12) of the variance explained by the factors included in the
232
Table 2. Multiple linear regression model steps (Open proactive aggression).
234
Model R R2 R
2
adjusted
Change Statistics
Durbin
Watson
SE Change
in R2
Change in
F
Sig. of the
change in F
1 .26 .07 .06 .36 .07 23.54 .000
1.90
2 .32 .10 .10 .35 .03 12.70 .000
3 .35 .12 .11 .35 .02 7.72 .006
Model 3
Unstandardized
coefficients
Standardized
coefficients t Sig. Collinearity
B SE Beta Tol. VIF
(Constant) .98 .11 8.74 .000
Social values -.07 .01 -.22 -4.13 .000 .95 1.04
Stress management -.08 .02 -.18 -3.53 .000 .99 1.00
Family function -.02 .00 -.15 -2.77 .006 .95 1.04
235
In order to confirm the validity of the model, the independence of the residues was analyzed.
236
The D statistic of Durbin-Watson obtains a value D=1.90, which confirms the absence of positive and
237
negative correlation. Plus, t value is associated to an error probability inferior to 0.05 in all the
238
variables included in the model (social values, stress management and family function). On the other
239
hand, standardized coefficients reveal that the variable presenting a higher explicative weight id
240
social values. Finally, the absence of collinearity among the variables included in the model is
241
assumed due to the high values obtained for the tolerance indicators and the low values for the VIF.
242
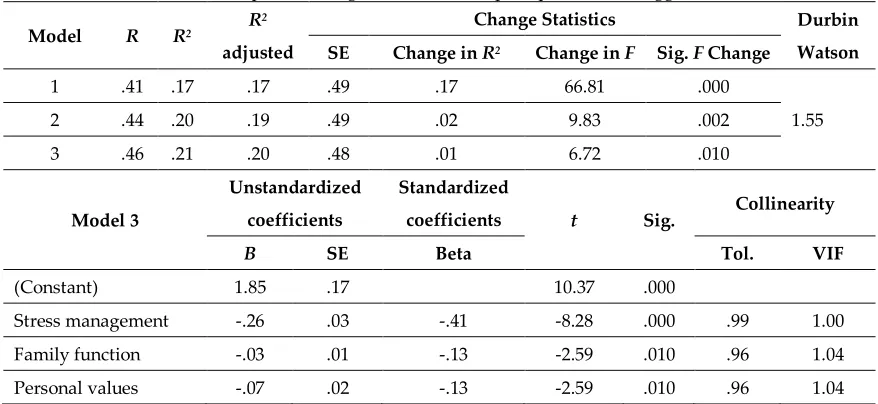
3.4. Multiple linear regression model: Open reactive aggression
243
In table 3, the regression analysis shows 3 models where the last one explains 21.7% of the
244
variance (R2=.21). The absence of correlation positive and negative is confirmed through the statistic
245
D of Durbin-Watson (D=1.55).
246
Table 3. Multiple linear regression model steps (Open reactive Aggression).
247
Model R R2 R
2
adjusted
Change Statistics Durbin
Watson SE Change in R2 Change in F Sig. F Change
1 .41 .17 .17 .49 .17 66.81 .000
1.55
2 .44 .20 .19 .49 .02 9.83 .002
3 .46 .21 .20 .48 .01 6.72 .010
Model 3
Unstandardized
coefficients
Standardized
coefficients t Sig. Collinearity
B SE Beta Tol. VIF
(Constant) 1.85 .17 10.37 .000
Stress management -.26 .03 -.41 -8.28 .000 .99 1.00
Family function -.03 .01 -.13 -2.59 .010 .96 1.04
Personal values -.07 .02 -.13 -2.59 .010 .96 1.04
The value of t is associated to an error probability inferior to.05 within all the varieties included
248
in the model, standardized coefficients reveal that the variable showing a higher explicative weight
249
is the stress management. The absence of collinearity with values in tolerance and VIF near the unit
250
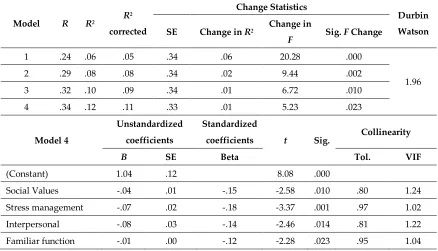
3.5. Multiple linear regression model: relational proactive aggression
252
Concerning the relational proactive aggression, due to the data colecta in table 4, the regression
253
analysis results in 4 models, quiere the forth one is the one with the highest explicative capacity with
254
12.2% (R2=.12) of the variance explained by the factors included in the model.
255
Table 4. Multiple linear regression model steps (relational proactive aggression).
256
Model R R2 R
2
corrected
Change Statistics
Durbin
Watson SE Change in R2 Change in
F Sig. F Change
1 .24 .06 .05 .34 .06 20.28 .000
1.96
2 .29 .08 .08 .34 .02 9.44 .002
3 .32 .10 .09 .34 .01 6.72 .010
4 .34 .12 .11 .33 .01 5.23 .023
Model 4
Unstandardized
coefficients
Standardized
coefficients t Sig. Collinearity
B SE Beta Tol. VIF
(Constant) 1.04 .12 8.08 .000
Social Values -.04 .01 -.15 -2.58 .010 .80 1.24
Stress management -.07 .02 -.18 -3.37 .001 .97 1.02
Interpersonal -.08 .03 -.14 -2.46 .014 .81 1.22
Familiar function -.01 .00 -.12 -2.28 .023 .95 1.04
257
In order to confirm the validity of the model, the independence of the data residue were
258
analyzed. The Durbin–Watson statistic obtains the value D=1.96, which confirms the absence of
259
positive and negative correlation. Plus, t value is associated to an error probability inferior to 0.05 in
260
all the variables included in the model. On the other hand, standardized coefficients reveal that the
261
variables presenting a higher explicative weight are stress management and social values. Finally,
262
the absence of collinearity among the variables included in the model is assumed due to the high
263
values obtained for the tolerance indicators and the low values for the VIF.
264
265
3.6. Multiple linear regression model: relational reactive aggression
266
In table 5, the regression analysis shows 2 models where the last one explains 8.1% of the
267
variance (R2=.08) through the statistic Durbin–Watson statistic (D=1.55). The value of t is associated
268
to an error probability inferior to .05 within all the varieties included in the model: stress management
269
and personal values. Standardized coefficients reveal that the variable showing the highest power of
270
prediction for the relational reactive aggression is stress management. The absence of collinearity is
271
confirmed with values obtained in the indicators of Tolerance and VIF.
272
Table 5. Multiple linear regression model steps (relational reactive aggression).
277
Model R R2 R
2
adjusted
Change Statistics
Durbin
Watson
SE Cambio
en R2
Cambio en
F Sig. F Change
1 .22 .05 .04 .36 .05 16.40 .000
1.91
2 .28 .08 .07 .36 .03 10.69 .001
Model 2
Unstandardized
coefficients
Standardized
coefficients t Sig. Collinearity
B SE Beta Tol. VIF
(Constant) .90 .12 7.23 .000
Stress management -.09 .02 -.22 -4.13 .000 1.00 1.00
Personal values -.06 .02 -.17 -3.27 .001 1.00 1.00
278
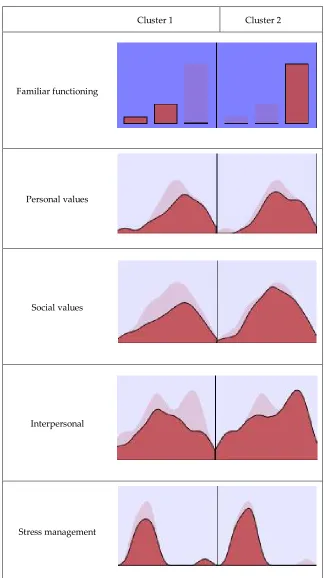
3.7. Profiles drown from the predictive variables of aggression and modalities of aggression
279
For the formation of groups, an analysis of a cluster in two stages was performed including the
280
variables from the multiple linear regression models previously presented (family function, social
281
values, personal values, stress management and interpersonal factor). For the cluster construction,
282
family function variable is chosen as the categorized variable, this means that results from 0 to 3
283
points are considered as severe dysfunction, from 4 to 6 moderate dysfunction, and from 7 to 10 high
284
function. In this case, family function is the predictor with the highest relevance in the construction
285
of clusters. (Figure 1).
286
From the inclusion of these variables two groups emerge (Figure 1) with the following
287
distribution: 30.6% (n=97) of the subjects belong to cluster 1 and 69.4% (n=220) to cluster 2. In table 6
288
there is a summary of the average scores of the analyzed variables, for the total sample as well as for
289
each cluster separately.
290
Table 6. Average scores for the total sample and clusters
291
Total sample
(N=317)
Cluster
1
(n=97)
2
(n=220)
Family function M=7.44 (DT=2.32) M=4.51 (DT=1.65) M=8.73 (DT=1.05)
Personal values M=5.38 (DT=1.02) M=5.15 (DT=1.15) M=5.48 (DT=.94)
Social values M=4.89 (DT=1.16) M=4.67 (DT=1.26) M=4.98 (DT=1.11)
Interpersonal M=2.94 (DT=.59) M=2.89 (DT=.63) M=2.97 (DT=.58)
Stress management M=2.59 (DT=.85) M=2.63 (DT=1.01) M=2.57 (DT=.78)
292
The first group resulting from the conglomerate analysis (cluster 1), is characterized by showing
293
a low-moderate family function, inferior average scores in personal values and social values
294
compared to the results for the total sample, and similar scores to the average of the sample in
295
interpersonal and stress management factors. Meanwhile, the second cluster, with a high family
296
function, shows superior average scores in personal and social values compared to the results of the
297
total samples, and similar scores to the average of the sample in interpersonal and stress management
298
factors.
299
After the classification of the groups through the clusters solution, a t-test was performed for
300
independent samples, with the aim of deducting the differences existing between the clusters with
301
respect to each one of the modalities of aggression. Significant differences between the clusters are
302
noted for the open proactive aggression (t(315)=2.22; p<.05; d=.27), cluster 1 (M=.31; DT=.44) showing
higher scores than cluster 2 (M=.20; DT=.33). There are no other significant differences between
304
clusters for the rest of the modalities of aggression.
305
306
Cluster 1 Cluster 2
Familiar functioning
Personal values
Social values
Interpersonal
Stress management
Figure 1. Composition of clusters. Note. Factors ordered by the importance of entry.
307
4. Discussion
308
Aggressive conducts are present within the adolescent stage and their prevalence increases
309
during the last years [1, 3]. In this sense, the outcome of this study shows the percentages of students
310
suffering of having suffered violent episodes by their peers, and those of the ones exercising or having
311
those of Crespo-Ramos et al. [4] and can be explained by the difference of size in the sample.
313
Concerning the gender of aggressors, the percentage of males is significantly higher in accordance
314
with other studies where the highest results belong to the male group [16, 17]. By contrast, for
315
Manring et al. [13], whose study was performed at primary school level, female obtain the highest
316
scores. However, within the group of victims there were no significant differences.
317
Concerning the gender, scores have been significantly different only for open proactive
318
aggressions and relational proactive aggressions, in both, males get higher results than females in the
319
same line than Rieffe et al. [17] where youth reaches high percentages in proactive and reactive
320
aggression, but in contrast to the results of van Hazebroek et al. [18] where the reactive aggression is
321
the predominant among males, and in proactive aggressions there was no significant difference
322
noted. Regarding the figure of the victim and the figure of the aggressor depending on the scales of
323
aggressions, the group of aggressors shows significantly higher average scores in all scales than the
324
group of non-aggressors as in other studies where aggressors show proactive aggressive conducts
325
[19, 20]. On the other hand, the victims obtained higher scores for the open reactive aggression.
326
The correlation between the modalities of aggression and the variables of emotional intelligence,
327
values and family function showed a negative relation since the higher levels of aggressiveness, the
328
lower levels of emotional intelligence [28, 34], personal and social values are also reduced and there
329
is a higher risk of family disfunction [33, 36].
330
Multiple linear regression analyses showed that open and relational proactive aggressions can
331
be predicted or explained by social values, stress management and family function, including the
332
interpersonal dimension in the relational proactive aggression. Concerning the open and relational
333
reactive aggressions, the dimension highlighted are stress management and personal values. Plus, on
334
the first type family function was included. These results are in line to other studies where the reactive
335
aggression open and relational are characterized by a low stress management and a bad emotional
336
regulation [26, 28]. Finally, in accordance with the variables of prediction (family function, personal
337
values, social values, interpersonal y stress management) two profiles of subjects and the differences
338
in the modalities of aggression arise. In this sense, similar studies establish profiles of subjects
339
depending on the type of aggression [37].
340
5. Conclusions
341
The findings of this study reveal the relationship between all the analyzed variables, and among
342
these, which aspects are to take into account when intervening or developing an analytical tool, since
343
not all of them predict every modality of aggression. Nevertheless, the size of the sample is one of
344
the limitations of this study, if in future investigations the sample was extended, we could confirm if
345
the variables explaining aggressive conducts of youth are the same or not. Plus, concerning the family
346
function, it would be interesting to analyze if the presence of aggressive behaviors is due to the
347
antecedents of the family function or to its consequences, since the current scientific literature is not
348
clear about this point. In summary, it is important to conduct this type of studies for establishing a
349
protocol of intervention, because this way, we can intervene face to an established profile and face to
350
previously determined aspects.
351
Author Contributions: M.d.M.M.J., M.d.C.P.F., and A.B.B.M. contributed to the conception and design of the
352
review. J.J.G.L. applied the search strategy. All authors applied the selection criteria. All authors completed the
353
assessment of risk of bias. All authors analyzed and interpreted data. M.d.M.M.J., M.d.C.P.F. and A.B.B.M.,
354
wrote this manuscript. M.d.C.P.F. and J.J.G.L. edited this manuscript. M.d.M.M.J. is responsible for the overall
355
project.
356
Funding: This research received no external funding.
357
Acknowledgments: The present study was undertaken in collaboration with the Excma. Diputación Provincial
358
de Almería.
359
Conflicts of Interest: The authors declare no conflict of interest.
360
References
362
1. Smith, P.K.; Kwak, K.; Toda, Y. School bullying in different cultures - Eastern and western perspectives;
363
Cambridge University Press: Cambridge, UK, 2016. http://dx.doi.org/10.1017/CBO9781139410878
364
2. Domínguez, J.; López, A.; Pino, M.; Álvarez, E. Violencia escolar: la díada interpersonal
profesorado-365
alumnado. Eur J Investing Health Psycho 2013, 3(2), 75-86. doi:10.30552/ejihpe.v3i2.46
366
3. Zych, I.; Ortega-Ruiz, R.; Del Rey, R. Scientific research on bullying and cyberbullying: Where have we
367
been and where are we going. Aggress Violent Behav 2015, 24, 188–198.
368
http://dx.doi.org/10.1016/j.avb.2015.05.015
369
4. Crespo-Ramos, S.; Romero-Abrio, A.; Martínez-Ferrer, B.; Musitu, G. Variables psicosociales y violencia
370
escolar en la adolescencia. Psychosocial Intervention 2017, 26(2), 125-130. doi:10.1016/j.psi.2017.05.002
371
5. Pérez-Fuentes, M.C.; Gázquez, J.J. Variables relacionadas con la conducta violenta en la escuela según los
372
estudiantes. Intern Jou. Psych Psychol Therapy 2010, 10(3), 427-437.
373
6. Cava, M.J.; Martínez, B. Adolescencia y familia: nuevos retos del siglo XXI. Trillas: México, 2013.
374
7. Fernández-Batanero, J.M. Convivencia escolar. Un estudio en la provincia de Sevilla (España). Intern Jou
375
Edu Resear Innovation 2015, 3, 78-93.
376
8. Torregrosa, M.S.; Inglés, C.J.; Estévez-López, E.; Musitu, G.; García-Fernández, J.M. Evaluación de la
377
conducta violenta en la adolescencia: Revisión de cuestionarios, inventarios y escalas en población
378
española. Aula Abierta 2011, 39(1), 37-50.
379
9. Nieto, B.; Portela, I.; López, E.; Domínguez, V. Violencia verbal en el alumnado de Educación Secundaria
380
Obligatoria. . Eur J Investing Health Psycho 2018, 8(1), 5-14. doi:10.30552/ejihpe.v8i1.221
381
10. García-Sancho, E.; Salguero, J.M.; Vasquez, E.A.; Fernández-Berrocal, P. Validity and reliability of the
382
Spanish version of the displaced aggression questionnaire. Psicothema 2016, 28(1), 96–101.
383
doi:10.7334/psicothema2015.222
384
11. Marsee, M.A.; Frick, P.J. Callous-unemotional traitsand aggression in youth. In Emotions, aggression, and
385
morality in children: Bridging deve-lopment and psychopathology; Arsenio, W., Lemerise, E., Eds.; American
386
Psychological Association: Washington, D.C., United States, 2010; pp. 137-156.
387
12. Vitaro, F.; Brendgen, M. Subtypes of aggressive behaviors: etiologies, development, and consequences. In
388
Antisocial behavior and crime: contributions of theory and evaluation research in prevention and intervention;
389
Bliesner, T., Beelman, A., Stemmler M., Eds.; Hogrefe: Goettingen, Germany, 2011.
390
13. Manring, S.; Elledge, L.C.; Swails, L.W.; Vernberg, E.M. Functions of aggression and peer victimization in
391
elementary school children: the mediating role of social preference.
392
J Abnorm Child Psychol 2018, 46(4), 795-809. doi:10.1007/s10802-017-0328-z
393
14. Centifanti, L.C.M.; Fanti, K.A.; Thomson, N.D.; Demetriou, V.; Anastassiou-Hadjicharalambous, X. Types
394
of relational aggression in girls are differentiated by callous-unemotional traits, peers and parental
395
overcontrol. Behavioral Sciences 2015, 5(4), 518-536. doi:10.3390/bs5040518
396
15. López-Castedo, A.; Álvarez, D.; Domínguez, J.; Álvarez, E. Expressions of school violence in adolescence.
397
Psicothema 2018, 30(4), 395-400. doi:10.7334/psicothema2018.130
398
16. Molero, M.M.; Pérez-Fuentes, M.C.; Gázquez, J.J. Conductas agresivas, antisociales y delictivas en función
399
del género y el rendimiento académico. Revista de Psicología y Educación 2016, 11(2), 25-42.
400
17. Rieffe, C.; Broekhof, E.; Kouwenberg, M.; Faber, J.; Tsutsui, M.M.; Güroglu, B. Disentangling proactive and
401
reactive aggression in children using self-report. Eur J Dev Psychol 2016, 13(4), 439-451.
402
doi:10.1080/17405629.2015.1109506
403
18. van Hazebroek, B.C.M.; Olthof, T.; Goossens, F.A. Predicting aggression in adolescence: the interrelation
404
between (a lack of) empathy and social goals. Aggressive Behav 2017, 43(2), 204-214.
405
https://doi.org/10.1002/ab.21675
406
19. Jara, N.; Casas, J.A.; Ortega-Ruiz, R. Proactive and reactive aggressive behavior in bullying: the role of
407
values. Inter J Educa Psychol 2017, 6(1), 1-24. doi:10.17583/ijep.2017.2515
408
20. Ettekal, I.; Ladd, G.W. Costs and benefits of children’s physical and relational aggression trajectories on
409
peer rejection, acceptance, and friendships: Variations by aggression subtypes, gender, and age. Dev Psychol
410
2015, 51(12), 1756-1770. doi:10.1037/dev0000057
411
21. Pérez-Fuentes, M.C.; Molero, M.M.; Carrión, J.J.; Mercader, I.; Gázquez, J.J. Sensation-Seeking and
412
Impulsivity as Predictors of Reactive and Proactive Aggression in Adolescents. Front Psychol 2016, 7, 1447.
413
22. Jiménez, T.I.; Estévez, E. School aggression in adolescence: Examining the role of individual, family and
415
school variables. Int J Clin Health Psychol 2017, 17(3), 197-296. doi:10.1016/j.ijchp.2017.07.002
416
23. Hofmann, V.; Müller, C.M. Avoiding antisocial behavior among adolescents: The positiveinfluence of
417
classmates’ prosocial behavior. J Adolesc 2018, 68, 136-145. https://doi.org/10.1016/j.adolescence.2018.07.013
418
24. Molero, M.M.; Pérez-Fuentes, M.C.; Carrión, J.J.; Luque, A.; Garzón, A.; Martos, A.; Simón, M.M.; Barragán,
419
A.B.; Gázquez, J.J. Antisocial Behavior and Interpersonal Values in High School Students. Front Psychol
420
2017, 8, 170. doi:10.3389/fpsyg.2017.00170
421
25. Sánchez-García, M.; Lucas-Molina, B.; Fonseca-Pedrero, E.; Pérez-Albéniz, A.; Paino, M. Emotional and
422
behavioral difficulties in adolescence: Relationship with emotional well-being, affect, and academic
423
performance. An Psicol 2018, 34(3), 482-489. http://dx.doi.org/10.6018/analesps.34.3.296631
424
26. Zych, I.; Beltrán-Catalán, M.; Ortega-Ruiz, R.; Llorent, V.J. Competencias sociales y emocionales de
425
adolescentes involucrados en diferentes roles de bullying y cyberbullying. Rev Psicodidact 2018, 23(2),
86-426
93. https://doi.org/10.1016/j.psicod.2017.12.001
427
27. Inglés, C.J.; Torregrosa, M.S.; García-Fernández, J.M.; Martínez-Monteagudo, M.C.; Estévez, E.; Delgado,
428
B. Conducta agresiva e inteligencia emocional en la adolescencia. Eur J Educ Psychol 2014, 7(1), 29-41.
429
https://doi.org/10.30552/ejep.v7i1.97
430
28. Euler, F.; Steinlin, C.; Stadler, C. Distinct profiles of reactive and proactive aggression in adolescents:
431
associations with cognitive and affective empathy. Child Adolesc Psychiatry Ment Health 2017, 11(1), 1-14.
432
doi:10.1186/s13034-016-0141-4
433
29. Moratto-Vásquez, N.S.; Cárdenas-Zuluaga, N.; Berbesi-Fernández, D.Y. School Climate and Family
434
Functionality as Associated Factors to Bullying in Students of Antioquia, Colombia. Pensamiento Psicológico
435
2017, 15(1), 63-72. doi:10.11144/Javerianacali.PPSI15-1.CEFF
436
30. Cutrín, O.; Gómez-Fraguela, J.A.; Maneiro, L.; Sobral, J. Effects of parenting practices through deviant peers
437
on nonviolent and violent antisocial behaviours in middle- and late-adolescence. Eur J Psychol Appl Legal
438
Context 2018, 9(2), 75-82. doi:10.1016/j.ejpal.2017.02.001
439
31. Rodríguez, A.; Revuelta, L.; Sarasa, M.; Fernández, O. The role of parental socialization styles in school
440
engagement and academic performance. Eur J Educ Psychol 2018, 11(2), 123-139.
441
https://doi.org/10.30552/ejep.v11i2.226
442
32. De la Torre, M.J.; Casanova, P.F.; Carpio, M.V.; Cerezo, M.T. Consistencia e inconsistencia parental:
443
relaciones con la conducta agresiva y satisfacción vital de los adolescentes. Eur J Educ Psychol 2013, 6(2),
444
135-149. doi:10.1989/ejep.v6i2.112
445
33. Skripkauskaite, S.; Hawk, S.T.; Branje, S.J.T.; Koot, H.M.; van Lier, P.A.C.; Meeus, V. Reactive and proactive
446
aggression: Differential links with emotion regulation difficulties, maternal criticism in adolescence.
447
Aggressive Behav 2015, 41(3), 214-226. https://doi.org/10.1002/ab.21583
448
34. Castillo-Gualda, R.; Cabello, R.; Herrero, M.; Rodríguez-Carvajal, R.; Fernández-Berrocal, P. A Three-year
449
emotional intelligence intervention to reduce adolescent aggression: the mediating role of unpleasant
450
affectivity. J Res Adolesc 2017, 28(1), 186-198. https://doi.org/10.1111/jora.12325
451
35. Paciello, M.; Muratori, P.; Ruglioni, L.; Milone, A.; Buonanno, C.; Capo, R.; Lochman, J.E.; Barcaccia, B.
452
Personal values and moral disengagement promote aggressive and rule-breaking behaviours in
453
adolescents with disruptive behaviour disorders: a pilot study. Int J Offender Ther Comp Criminol 2017, 61(1),
454
46–63. doi:10.1177/0306624X15589593
455
36. Mera, R.M.; Macías, G.L.; Bravo, G.R. La disfunción familiar y conducta de agresión entre pares: caso octavo
456
año de la Unidad del Milenio Olmedo. Revista Caribeña de Ciencias Sociales 2018 (abril 2018). En línea:
457
//www.eumed.net/rev/caribe/2018/04/disfuncion-familiar.html
458
37. Polman, H.; Orobio, B.; Koops, W.; van Boxtel, H.W.; Merk, W.M. A meta-analysis of the distinction
459
between reactive and pro active aggression in children and adolescents. J Abnorm Child Psychol 2007, 35(4),
460
522-535. doi:10.1007/s10802-007-9109-4
461
38. Marsee, M.A.; Barry, C.T.; Childs, K.K.; Frick, P.J.; Kimonis, E.R.; Muñoz, L.C.; Aucoin, K.J.; Fassnacht,
462
G.M.; Kunimatsu, M.M.; Lau, K.S. Assessing the forms and functions of aggression using self-report: Factor
463
structure and invariance of the Peer Confl ict Scale in youths. Psychol Assess 2011, 23(3), 792-804.
464
doi:10.1037/a0023369
465
39. Pérez-Fuentes, M.C.; Molero, M.M.; Martos, A.; Barragán, A.B.; Gázquez, J.J.; Sánchez-Marchán, C. Análisis
466
y validación española del Peer Conflict Scale. Eur J Educ Psychol 2016, 9(1), 56-62.
467
40. Gázquez, J.J.; Pérez-Fuentes, M.C.; Molero, M.M.; Barragán, A.B.; Martos, A.; Sánchez-Marchán, C. Drug
469
use in adolescents in relation to social support and reactive and proactive aggressive behavior. Psicothema
470
2016, 28(3), 318-322. doi:10.7334/psicothema2015.327
471
41. Bellón, J.A.; Delgado, A.; Luna, J.D.; Lardelli, P. Validez y fiabilidad del cuestionario de función familiar
472
Apgar-Familiar. Aten Prim 1996, 18(6), 289-296.
473
42. Smilkstein, G.; Ashworth, C.; Montano, D. Validity and reliability of the Family APGAR as a test of family
474
function. J Fam Pract 1982, 15(2), 303-311.
475
43. Romero-Abrio, A.; Musitu, G.; Callejas-Jerónimo, J.E.; Sánchez-Sosa, J.C.; Villarreal-González, M.E.
476
Factores predictores de la violencia relacional en la adolescencia. Liberabit 2018, 24(1), 29-43.
477
https://doi.org/10.24265/liberabit.2018.v24n1.03
478
44. Bar-On, R.; Parker, J.D.A. Emotional Quotient Inventory: Youth Version (EQ-i:YV): Technical manual;
479
MultiHealth Systems: Toronto, Canada, 2000.
480
45. Pérez-Fuentes, M.C.; Gázquez, J.J.; Mercader, I.; Molero, M.M. Brief Emotional Intelligence Inventory for
481
Senior Citizens (EQ-i-M20). Psicothema 2014, 26(4), 524-530. doi:10.7334/psicothema2014.166
482
46. Bermúdez, A.M.; Méndez, I.; García-Munuera, I. Inteligencia emocional, calidad de vida y alexitimia en
483
personas mayores institucionalizadas. Eur J Health Research 2017, 3(1), 17-25.
484
https://doi.org/10.30552/ejhr.v3i1.52
485
47. Antolín, L.; Oliva, A.; Pertegal, M.A.; López, A.M. Desarrollo y validación de una escala de valores para el
486
desarrollo positivo adolescente. Psicothema 2011, 23(1), 153-159.
487
48. Cortés-Morales, G.; Valdez-Menchaca, A.G. ; Vázquez, L.C.; Hernández-Gutiérrez, L.E. Análisis de los
488
valores en los adolescentes utilizando las tecnologías de la información. Rev Sist & Gest Educ 2015, 2(3),
609-489
615.