CAD-Based Shielding Analysis for ITER Port Diagnostics
Arkady Serikov1,*,
Ulrich Fischer1,
David Anthoine2,
Luciano Bertalot2,
Maartin De Bock2
, Richard O’Connor2,
Rafael Juarez3,and Vitaly Krasilnikov2
1Karlsruhe Institute of Technology (KIT), Institute for Neutron Physics and Reactor Technology, Hermann-von-Helmholtz-Platz 1, 76344 Eggenstein-Leopoldshafen, Germany
2ITER Organization, Route de Vinon-sur-Verdon, CS 90 046, 13067 St. Paul Lez Durance Cedex, France 3Departamento de Ingeniería Energética, ETSII-UNED, Calle Juan del Rosal 12, Madrid 28040, Spain
Abstract. Radiation shielding analysis conducted in support of design development of the contemporary diagnostic systems integrated inside the ITER ports is relied on the use of CAD models. This paper presents the CAD-based MCNP Monte Carlo radiation transport and activation analyses for the Diagnostic Upper and Equatorial Port Plugs (UPP #3 and EPP #8, #17). The creation process of the complicated 3D MCNP models of the diagnostics systems was substantially accelerated by application of the CAD-to-MCNP converter programs MCAM and McCad. High performance computing resources of the Helios supercomputer allowed to speed-up the MCNP parallel transport calculations with the MPI/OpenMP interface. The found shielding solutions could be universal, reducing ports R&D costs. The shield block behind the Tritium and Deposit Monitor (TDM) optical box was added to study its influence on Shut-Down Dose Rate (SDDR) in Port Interspace (PI) of EPP#17. Influence of neutron streaming along the Lost Alpha Monitor (LAM) on the neutron energy spectra calculated in the Tangential Neutron Spectrometer (TNS) of EPP#8. For the UPP#3 with Charge eXchange Recombination Spectroscopy (CXRS-core), an excessive neutron streaming along the CXRS shutter, which should be prevented in further design iteration.
1 Introduction
The most (~80%) of ITER diagnostic systems are hosted by the Port Plugs which are arranged at 3 levels (Upper, Equatorial, and Lower) depicted in Fig. 1 as UPP, EPP, and LP. The plugs have dual purpose: provide the access for diagnostic instruments to measure the plasma characteristics (density, energy, etc.), and at the same way plug the ports against the neutron and gamma radiation and vacuum leakage. Therefore, the designing of the port diagnostics must be supported by the radiation shielding analysis for each of port system. At ITER the design developing process is performing in the Computer Aided Design (CAD) models with ENOVIA software platform. In order to follow all the important from neutronic point of view changes in the CAD models, the nuclear analyst should be capable to use the CAD model in creation of the neutronics models in the CAD-based shielding analysis. The main objective of the nuclear analyses of the ports is to guarantee radiation shielding of the personnel access to the Port Interspace (PI) areas behind the ports shown in Fig. 1 with compliances to the ITER project restrictions of nuclear safety, weight and consistency with port interfaces to the blanket and vacuum vessel. For the shielding optimization of the ports, the objective function was the Shut-Down Dose Rate (SDDR) at PI with the target of the SDDR minimization following the ALARA (As Low As Reasonable Achievable) principle. Because according
to the ITER project requirements, the SDDR in PI have to be ALARA and below the limit of 100 Sv/hr after ~12 days of cooling for hands-on maintenance activities. Currently, many port systems have predicted SDDR in PI above this limit, therefor shielding design improvements should be investigated. Several shielding approaches to bring these values down and to minimize the dose to a worker have been proposed in the paper.
This paper presents new results of CAD-based neutronics analyses performed with the Monte Carlo MCNP5 code [1] and the Rigorous 2-Step mesh (R2Smesh) method [2] for SDDR-calculations. The ITER tokamak geometry complexity and multiple diagnostic instruments inside the Upper and Equatorial Port Plugs (UPP and EPP) shown in Fig. 2, make the MCNP simulation challenging. Some of challenges are discussed in work [3].
Fig. 2. Drawing of ITER with multiple diagnostic instruments integrated inside the Diagnostics Port Plugs and Port Interspace (PI) behind the plugs where the personnel access is expected for the diagnostics maintenance.
The results for three particular ports are discussed in Section 3 with the following diagnostic systems: (1) Tritium and Deposit Monitor (TDM) integrated in EPP#17; (2) Tangential Neutron Spectrometer (TNS) with 6 optical diagnostic systems inside EPP#8; and (3) Charge eXchange Recombination Spectroscopy (CXRS-core) in UPP#3, and (4) Diagnostic Generic Upper Port Plug (DGUPP) of ITER.
2 Methodology
Fusion neutronics calculations in general are conducted by Monte Carlo (MC) codes such as MCNP using the geometry representations which are well adapted from the engineering CAD model. In approach of this paper, the geometry of CAD model is converted to MCNP model. Reflecting boundary conditions are implemented on the poloidal vertical planes which are located at ±20° from the center of the mid-plane port in order to create a 40 degree toroidal sector of the MCNP model of ITER machine. This sector is symmetrically duplicated 9 times to simulate full 360 degree machine shown in Fig. 3, the CAD model of 40 degree sector is presented in Fig. 4. The reflective planes cut through the center of the ports at the ±20 lateral sides, therefore only symmetrical ports can be modelled on those sides and modelled as port halves. The geometry of central port is modelled completely, and any design features could be reproduced in the model. This 40 degree model includes all the major components of ITER such as blanket, vacuum vessel, toroidal and poloidal magnets, 3 levels of the ports, bioshield, and so on. Therefore, it is calls “ITER
global MCNP model”. It exists in several modifications and the latest MCNP ones are C-lite v.2 released in 2015 and C-Model 2016.
Fig. 3. Simulation of the entire 360° tokamak by reflective boundary conditions at each toroidal end of the 40° torus sector with reflective planes at ±20°.
Fig. 4. CAD model of ITER 40 degree sector corresponded to the MCNP global C-Model 2016 – Diagnostics Generic Upper Ports (DGUPP) are highlighted.
cell given by a semi-algebraic description. The conversion process could be performed automatically by means of the CAD-to-MCNP converter programs MCAM [5] and McCad [6]. In this paper, the most conversions have been carried out with MCAM.
The methodology of SDDR calculations consisted in use of recently updated Rigorous 2-Step mesh-based (R2Smesh) method [2] which allows studying decay gamma sources in particular materials with estimations of isotopic contributions to SDDR. The maximal decay sources were produced in steel of Diagnostic First Wall (DFW) and steel structure of Diagnostic Shield Module (DSM). The following nuclides were found to dominate in SDDR at 12 days inside the port interspace: 60Co, 182Ta, 58Co, 54Mn, and 59Fe. These radioactive isotopes
are generated in the steel structure of the port rear side, mostly its closure plate, rear flange and port walls.
The visualization capabilities are based on the ParaView code http://www.paraview.org, which allows overlying the MCNP mesh tally distributions with the CAD geometry written in STEP-file. The MCNP parallel runs with message passing interface (MPI) were done on the Helios supercomputer (http://www.iferc.org).
3 Results
The described CAD-based methodology is routinely applying for neutronics analyses of the ITER diagnostics. The results of particular diagnostic systems integrated inside the two Equatorial Port Plugs (EPP #17 and #8) and one Upper Plug (UPP #3) are addresses in this Section. Neutronics results for Diagnostic Generic Upper Port Plug (DGUPP) are also presented at the end of this Section.
3.1 Tritium and Deposit Monitor (TDM) integrated in EPP#17
Shielding analysis of Tritium and Deposit Monitor (TDM) is performed with the local MCNP models of EPP#17 which comprises two adjacent diagnostics: TDM and Core-Imaging X-ray Spectrometer (CIXS) elaborated in works [4, 7]. With the applied approach of local modelling all contributions from other ITER systems and ports are neglected. The MCNP 3D model was converted from the corresponding CAD model. The result of such CAD-to-MCNP conversion is visualized in Figs. 5 and 6.
Fig. 5. 3D visualization with the MCAM code of the EPP #17 MCNP local model with inclusion of only the CIXS system with 3 Line-Of-Site (LOS) x-ray beams inside the DSMs #2 and #3.
Fig. 6. Vertical cut of the MCNP local model with Diagnostics apertures of two systems: Tritium & Deposit monitor & CIXS. Neutron and photon importances and boundary conditions are specified.
The introduced modeling assumptions (e.g. homogenization in material specification) and the level of geometry details correspond to the ITER Conceptual Design Review (CDR) level of the design development. Critical neutronics issues of TDM related to radiation streaming have been resolved. For instance, it was proposed to increase the length of one segment between two particular mirrors (M4 and M5 depicted in Fig. 7) in the labyrinth optical mirror system to prevent direct neutron streaming from the plasma to the optical box in Port Interspace (PI), where maintenance is planned ~12 days after shutdown. To provide the possibility of personnel access to the PI area, Shut-Down Dose Rate (SDDR) has been calculated with the results presented as map distributions and estimates in spherical detectors. Shield block made of boron carbide behind the optical box was added to reduce the SDDR in PI.
Fig. 7. CAD model of optical system of Tritium and Deposit Monitor (TDM)
that mirror M5 pointed in Figs. 7, 8 does not present enough shift in the vertical segment M4-M5 of the bent optical pathway. Part of neutron flux can penetrate directly or through the thin shield at M5, resulting in excessive neutron streaming pathway to the PI. Therefore, we proposed to move mirror M5 up to increase the shift.
Fig. 8. Map of total neutron flux in MCNP model of EPP#17 included TD-Monitor & CIXS.
The R2Smesh method of SDDR calculations allowed us to distinguish different decay gamma sources in forming the SDDR. The SDDR results are presented for two variants of the EPP #17-CIXS models, with and without the TD-Monitor. Therefore the contribution to SDDR from the monitor was deduced. This work provides only the relative values of SDDR. The absolute values will be obtained after the finalizing of the designing work for all the EPP #17 diagnostics. This is a forthcoming task of EPP #17 diagnostics integration into the ITER-global C-lite MCNP model.
3.2 Tangential Neutron Spectrometer (TNS) with 7 optical diagnostic systems inside EPP#8
The Tangential Neutron Spectrometer (TNS) is devised to measure spectra of neutrons flying in tangential direction as a collective D-T plasma rotation. The TNS detectors should allow estimating the Doppler energy shift in the D-T source neutron spectrum emission. Such neutron spectrometer with tangential view to the plasma (TNS) has been modeled inside the Equatorial Port Plug #8 (EPP #8) of the ITER global MCNP model C-lite v.2 with 7 systems inside the port shown in Fig. 9.
Fig. 9. CAD model of 7 diagnostics have been integrated into the EPP#8, among them two TNS detectors are listed by #2.
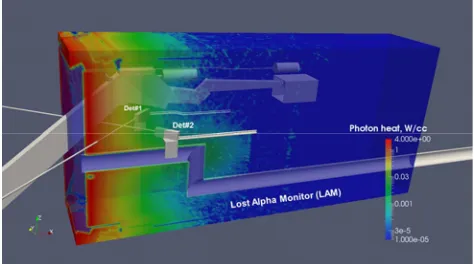
Fig. 10. Photon heating (W/cc) for EPP#8 with depicting of two TNS detectors and Lost Alpha Monitor (LAM)
The nuclear heating in the EPP#8 materials is dominated by photons. Map of photon heating distribution with the cut through the central Detector#2 of TNS and the channel of the Lost Alpha Monitor (LAM) is plotted in Fig. 10. In approximation of this neutronic analysis, the geometry of the LAM diagnostics was modelled as Z-shaped cylindrical channel and its model could be generalised as simple representation of Fast Ion Loss Detector (FILD). In this paper LAM and FILD are synonyms. It is noticeable from Fig. 10 that the LAM channel introduces radiation streaming deep inside the port plug shielding. This streaming disturbs the neutron energy spectrum detecting in the central TNS Detector #2. Such neutron spectral effect in TNS has been analyzed in the paper by modification of the MCNP C-lite model consisted in filling the LAM in EPP#8. As an alternative design option, instead of totally filling the LAM (that means LAM removing), we have proposed to turn upside-down the Z-shape channels from the original pathway in Fig. 11a to the turned pathway in Fig. 11b. The turning was implemented by symmetrical exchange of the shifted legs positions. In the MCNP model with the original shape of the LAM (FILD) channels the distance between TNS and LAM was 10 cm, by the turning the was increased to 60 cm.
Fig. 11a. MCNP cut through the original orientation of the LAM (FILD) channel.
Fig. 11b. MCNP cut through the turned upside-down LAM (FILD) channel.
neutron flux is reduced in the TNS central Detector#2, with higher 14 MeV peaking factor, which is explained by eliminating the noise of neutrons of low and intermediate energies. This is due to stronger moderation and neutron absorptions by isotope 10B in the shield material inside the LAM channel.
The neutron spectra results indicated that the turned LAM option is an equivalent to one of its absence – option of totally filled LAM (“TNS-no-LAM”). As a conclusion of this analysis, it is recommended to introduce stronger moderators and neutron absorbers around the TNS detectors in order to detect only the neutron passing through the TNS collimators.
Fig. 12. Equivalence of neutron spectra in central TNS detector for two cases: (1) totally removed LAM, and (2) turned upside-down LAM.
3.3 Charge eXchange Recombination Spectroscopy (CXRS-core) in UPP#3
The Charge Exchange Recombination Spectroscopy (CXRS) diagnostic system measures photon line emissions of several impurity isotopes in the ITER plasma. This system is going to be installed inside the ITER Upper Port Plug (UPP) #3 together with Glow Discharge Cleaning (GDC) system. To satisfy the ITER radiation requirements, nuclear analysis appropriate for the CDR stage of CXRS development has been performed for the Upper Port (UP) environment including its Port Interspace (PI). Three cases of the UPP configurations have been analyzed: Case #1 is characterized by inclusion of both systems: CXRS and GDC, in Case #2 the GDC was removed, keeping shield in its place and the CXRS, and Case #3 has no any apertures at all in the Generic Upper Port Plug (GUPP). For the GUPP design, the 3D B-lite MCNP model with more detailed description of the blanket modules around the UP has been used in the state of GUPP Final Design Review (FDR) 2013 [8] with only one modification – introduction of single labyrinth at the bottom gap of GUPP. The UPP apertures of Cases #1 and #2 were inserted in the bulk shield of the GUPP Case #3.
The CAD model files of CXRS-core and Glow Discharge Cleaning (GDC) system were prepared for neutronics analysis by means of simplification and substitution of all spline surfaces with cylinders or planes keeping the original volumes of the CXRS components unchanged. The shape of the GDC model
was updated to the newest design and its definition was simplified to the two-part geometry (front-end electrode and transmission line) with homogeneous material compositions. The final CAD model of the CXRS-core and GDC developed for the neutronics analysis is presented in Fig. 13. The properly prepared CAD files of CXRS and GDC were converted to the MCNP model by means of MCAM [5].
Fig. 13. CAD neutronics model of the CXRS-core and GDC
For calculation of neutron flux distributions over the whole space of the Upper Port Plug (UPP) and Port Interspace (PI) with the MCNP5 code, a fine mesh grid has been set up with the mesh element size of 1x1x1 cm3. The comparison of the maps of total neutron fluxes for Cases #1 and #3 is illustrated in Fig. 14 in contrast for the cases with most difference in number of apertures: Case #1 with 4 types of radiation openings (upper picture of Fig. 14), and Case #3 with opening in for of gaps around the UPP (bottom picture of Fig. 14). Radiation streaming was expected along the following pathways: 1–Gaps around the UPP; 2–CXRS shutter; 3– CXRS main optical path; 4 – GDC electrode. The map of total neutron flux plotted in Fig. 15 emphasized the neutron streaming along the CXRS shutter to the mirror M5 located deep inside the port and farther to the Port Interspace (PI) area.
Fig. 15. Total neutron flux (n/cm2/s) distribution with thresholds between (1e9 – 1e10) n/cm2/s to demonstrate strong impact of neutron streaming along the CXRS shutter to mirror M5 and then farther to Port Interspace (PI) behind the UPP.
For the MCNP calculation of nuclear heating distribution inside the UPP we have used MCNP mesh-tallies with separate contributions from neutron (n) and photons (p). The dominant contribution to the heating is coming from photon heating deposition. The maximum (n+p) heating was ~5.5 W/cm3 on the DFW, with strong attenuation to 0.06 W/cm3 at 60 cm from the DFW surface, at which distance the DSM is beginning as shown in Fig. 16.
Based on the performed neutronics analysis, it is recommended to add shielding material behind the shutter to reduce the streaming to the mirror M5 and PI. The obtained SDDR in PI is between 124 Sv/hr (behind the port closure plate) and 91 Sv/hr (PI at the bioshield) with a contribution from CXRS-core of 25 Sv/hr (at closure plate) and 10 Sv/hr (at bioshield) correspondingly, and no signification contribution to SDDR from GDC was found.
Fig. 16. Total nuclear heating (neutron and photon) in 100% steel for the Case #1 with attenuation from 5 W/cm3at the FW down to 0.06 W/cm3at 60 cm where DSM begins.
3.4 Diagnostic Generic Upper Port Plug (DGUPP) of ITER
The result of MCNP 3D model development of Diagnostic Generic Upper Port Plug (DGUPP) is shown in Fig. 17. That model will be used as standard neutronics model for ITER-related neutronics calculations and distributed among the Domestic Agencies and ITER contactors. Its geometry was
converted from the actual CAD models of ITER Upper Port, inter-space structures (ISS), and bioshield port plug. The model was created in format of the MCNP code which is suitable for fusion neutronics to perform radiation transport calculations with the Monte Carlo stochastic methodology. The model will be used for analysing any other ITER systems and ports such as Equatorial or Lower ports and it is ready for integration of any particular Diagnostic system inside its Diagnostic Shielding Module (DSM). Using this new DGUPP model certain series of neutronics analyses has been performed in order to test its shielding performance and recognize potential problems. By conducting the Shut-Down Dose Rate (SDDR) analysis one of the problems was recognized in excessive neutron streaming along the gaps around the DGUPP depicted in Fig. 18 and it draws attention of the ITER engineers to mitigate such streaming by arranging additional shielding. We have also evaluated the contribution of neutron radiation (neutron cross-talk) from Equatorial Port (EP) and Lower Port (LP) to Upper Port interspace of DGUPP as depicted in Fig. 19. The analysis performed has been recognized as an important step for investigation of shielding improvement of the Upper Port design and other ITER systems interfacing with DGUPP. The analysis outcomes result in establishing new project tasks directed to the reduction of SDDR at port inter-space area following the ALARA principle because this area is supposed to be accessible by personnel for port maintenance activities.
Fig. 17. Neutronics model of DGUPP with Diagnostic Shielding Modules (DSM), Inter-Space Structure (ISS), and Bioshield Port Plug created and integrated in ITER torus sector
Fig. 19. Total neutron flux deposition from Equatorial Port (EP) and Lower Port (LP) to Upper Port interspace of DGUPP: model with radiation streaming from EP & LP (top picture), and variant with closed EP & LP ports (bottom picture).
Acknowledgment
This work has been funded by the ITER Organization under the ITER service contract Nr. IO/4300000896 using an adaptation of the C-lite MCNP models which were developed as a collaborative effort between the FDS team of ASIPP China, University of Wisconsin-Madison, ENEA Frascati, CCFE UK, JAEA Naka, and ITER Organization. The views and opinions expressed herein do not necessarily reflect those of the ITER Organization.
This work was carried out using an adaption of the Diagnostics Generic Equatorial Port Plug MCNP model which was developed as a collaborative effort between Universidad Nacional de Educacion a Distancia (UNED) and ITER Organization.
References
1. X-5 Monte Carlo Team, MCNP—A general Monte Carlo N-particle Transport Code, Version 5, LA-UR-03-1987, Los Alamos National Laboratory (2003)
2. P. Pereslavtsev, et al., Fusion Eng. Des., 88, pp. 2719-2722 (2013),
http://dx.doi.org/10.1016/j.fusengdes.2013.02.091
3. A. Serikov, et al., SNA+MC 2013, 01502 (2014)
http://dx.doi.org/10.1051/snamc/201401502
4. A. Serikov, et al., M&C+SNA+MC 2015 conference, Nashville, TN, April 19-23, 2015, Volume 2, 2015, pp. 951-962 (2015)
5. Y. Wu, FDS Team, Fusion Eng. Des., 84, pp. 1987-1992 (2009),
http://dx.doi.org/10.1016/j.fusengdes.2008.12.041
6. D. Grosse, et al., Fusion Eng. Des., 88, pp. 2210– 2214 (2013),
http://dx.doi.org/10.1016/j.fusengdes.2013.02.146
7. A. Serikov, et al., Fusion Eng. Des., 109–111, pp. 848–854 (2016),
http://dx.doi.org/10.1016/j.fusengdes.2016.01.063
8. S. Pak, et al., Fusion Eng. Des., 102, pp. 21-27 (2016),