7
1 Laboratoire de Biologie des Ligneux et des Grandes Cultures (LBLGC), INRA USC1328, Université d’Orléans,
8
Pôle Universitaire d’Eure et Loir, 21 rue de Loigny la Bataille, F-28000 Chartres, France ;
9
samantha.drouet@univ-orleans.fr (S.D.); laurine.garros@univ-orleans.fr (L.G.); emilie.leclerc@univ-orleans.fr
10
(E.A.L.); eric.laine@univ-orleans.fr (E.L.); hano@univ-orleans.fr (CH)
11
2 Bioactifs et Cosmetiques, CNRS GDR 3711 Orleans, 45067 Orléans Cedex 2, France
12
3 Department of Pharmaceutical Botany, Faculty of Pharmacy, Mahidol University, 447 Sri-Ayuthaya Road,
13
Rajathevi, Bangkok 10400, Thailand; duangjai.tun@mahidol.ac.th (D.T.)
14
4 I.K. Gujral Punjab Technical University, Kapurthala, Punjab 144603, India; atul.kbr@gmail.com (A.K.)
15
5 Kota College of Pharmacy, Kota Rajasthan 325003, India
16
6 Department of Biotechnology, Quaid-i-Azam University, Islamabad 45320, Pakistan; bhabbasi@qau.edu.pk
17
(B.H.A.)
18
* Correspondence: hano@univ-orleans.fr; Tel: +33 2 37 30 97 53; Fax: +33 2 37 91 08 63 (C.H.)
19
20
Supplementary Materials
21
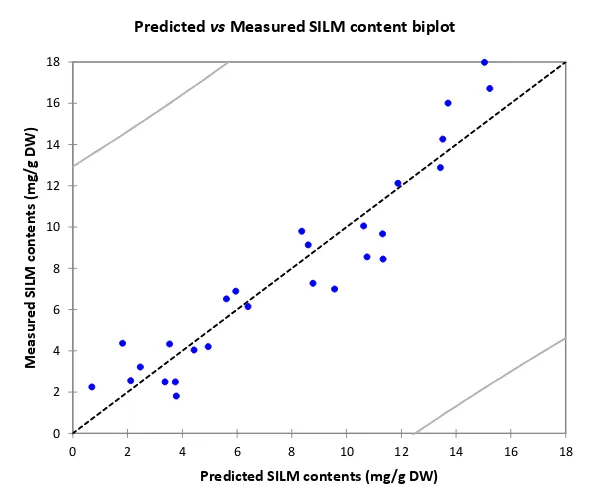
Figure S1 Biplot representation of the linear relation between predicted vs measured SILM contents in the 27 sample extracts.
22
Light blue contours represented p = 0.05.
23
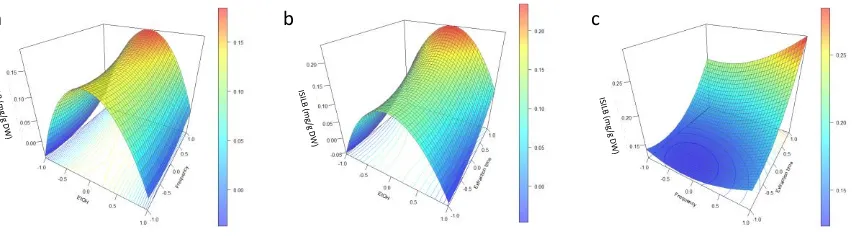
Figure S2 3D plots from the model predicted TAX extracted quantities from mature fruits of Silybum marianum as a function of
24
(a) ethanol concentration and ultrasound frequency, (b) ethanol concentration and extraction duration, and (c) ultrasound
25
frequency and extraction duration.
26
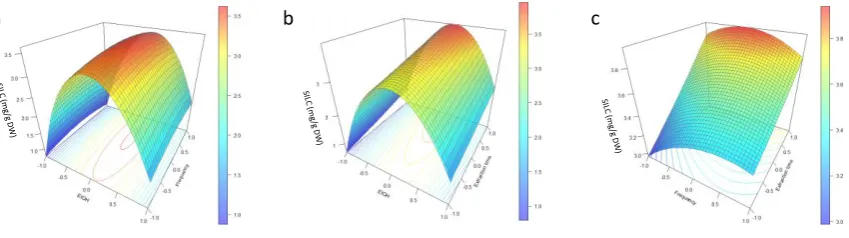
Figure S3 3D plots from the model predicted SILC extracted quantities from mature fruits of Silybum marianum as a function of
27
(a) ethanol concentration and ultrasound frequency, (b) ethanol concentration and extraction duration, and (c) ultrasound
28
frequency and extraction duration.
29
Figure S4 3D plots from the model predicted SILD extracted quantities from mature fruits of Silybum marianum as a function of
30
(a) ethanol concentration and ultrasound frequency, (b) ethanol concentration and extraction duration, and (c) ultrasound
31
frequency and extraction duration.
32
Figure S5 3D plots from the model predicted SILA extracted quantities from mature fruits of Silybum marianum as a function of
33
(a) ethanol concentration and ultrasound frequency, (b) ethanol concentration and extraction duration, and (c) ultrasound
34
frequency and extraction duration.
35
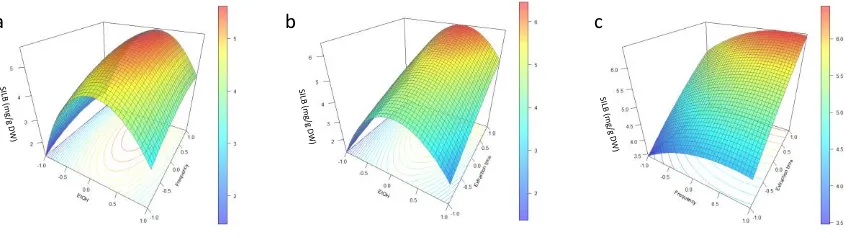
Figure S6 3D plots from the model predicted SILB extracted quantities from mature fruits of Silybum marianum as a function of
36
(a) ethanol concentration and ultrasound frequency, (b) ethanol concentration and extraction duration, and (c) ultrasound
37
frequency and extraction duration.
38
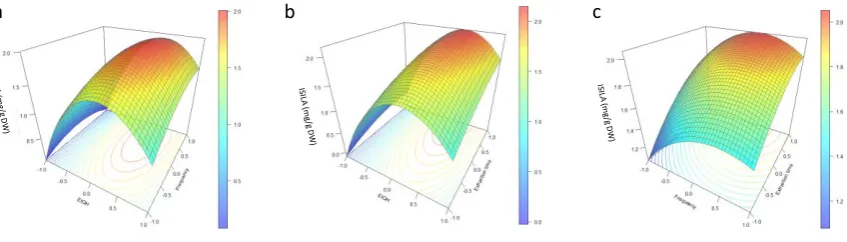
Figure S7 3D plots from the model predicted ISILA extracted quantities from mature fruits of Silybum marianum as a function of
39
(a) ethanol concentration and ultrasound frequency, (b) ethanol concentration and extraction duration, and (c) ultrasound
40
frequency and extraction duration.
41
Figure S8 3D plots from the model predicted ISILB extracted quantities from mature fruits of Silybum marianum as a function of
42
(a) ethanol concentration and ultrasound frequency, (b) ethanol concentration and extraction duration, and (c) ultrasound
43
frequency and extraction duration.
44
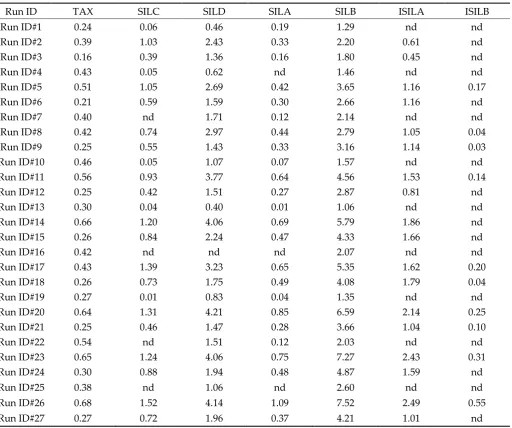
Table S1 Results of full factorial design experiments for the extraction of TAX, SILC, SILD, SILA, SILB, ISILA and ISILB from
45
mature fruits of Silybum marianum.
46
Table S2 Values, standard deviations and statistical analysis of the regression coefficients for the TAX, SILC, SILD, SILA, SILB,
47
ISILA and ISILB extraction yield from mature fruits of Silybum marianum as a function of the 3 different variables (X1: ethanol
48
52
Figure S1 Biplot representation of the linear relation between predicted vs measured SILM contents in the 27 sample
53
extracts. Light blue contours represented p = 0.05.
54
55
0 2 4 6
0 2 4 6 8 10 12 14 16 18
M
e
asur
e
d
SIL
56
Figure S1 3D plots from the model predicted TAX extracted quantities from mature fruits of Silybum marianum as
57
a function of (a) ethanol concentration and ultrasound frequency, (b) ethanol concentration and extraction duration,
58
and (c) ultrasound frequency and extraction duration.
59
61
Figure S3 3D plots from the model predicted SILC extracted quantities from mature fruits of Silybum marianum as
62
a function of (a) ethanol concentration and ultrasound frequency, (b) ethanol concentration and extraction duration,
63
and (c) ultrasound frequency and extraction duration.
64
66
Figure S4 3D plots from the model predicted SILD extracted quantities from mature fruits of Silybum marianum as
67
71
Figure S5 3D plots from the model predicted SILA extracted quantities from mature fruits of Silybum marianum as
72
a function of (a) ethanol concentration and ultrasound frequency, (b) ethanol concentration and extraction duration,
73
and (c) ultrasound frequency and extraction duration.
74
76
Figure S6 3D plots from the model predicted SILB extracted quantities from mature fruits of Silybum marianum as
77
81
Figure S7 3D plots from the model predicted ISILA extracted quantities from mature fruits of Silybum marianum as
82
a function of (a) ethanol concentration and ultrasound frequency, (b) ethanol concentration and extraction duration,
83
85
Figure S8 3D plots from the model predicted ISILB extracted quantities from mature fruits of Silybum marianum as
86
Run ID#6
0.21
0.59
1.59
0.30
2.66
1.16
nd
Run ID#7
0.40
nd
1.71
0.12
2.14
nd
nd
Run ID#8
0.42
0.74
2.97
0.44
2.79
1.05
0.04
Run ID#9
0.25
0.55
1.43
0.33
3.16
1.14
0.03
Run ID#10
0.46
0.05
1.07
0.07
1.57
nd
nd
Run ID#11
0.56
0.93
3.77
0.64
4.56
1.53
0.14
Run ID#12
0.25
0.42
1.51
0.27
2.87
0.81
nd
Run ID#13
0.30
0.04
0.40
0.01
1.06
nd
nd
Run ID#14
0.66
1.20
4.06
0.69
5.79
1.86
nd
Run ID#15
0.26
0.84
2.24
0.47
4.33
1.66
nd
Run ID#16
0.42
nd
nd
nd
2.07
nd
nd
Run ID#17
0.43
1.39
3.23
0.65
5.35
1.62
0.20
Run ID#18
0.26
0.73
1.75
0.49
4.08
1.79
0.04
Run ID#19
0.27
0.01
0.83
0.04
1.35
nd
nd
Run ID#20
0.64
1.31
4.21
0.85
6.59
2.14
0.25
Run ID#21
0.25
0.46
1.47
0.28
3.66
1.04
0.10
Run ID#22
0.54
nd
1.51
0.12
2.03
nd
nd
Run ID#23
0.65
1.24
4.06
0.75
7.27
2.43
0.31
Run ID#24
0.30
0.88
1.94
0.48
4.87
1.59
nd
Run ID#25
0.38
nd
1.06
nd
2.60
nd
nd
Run ID#26
0.68
1.52
4.14
1.09
7.52
2.49
0.55
Run ID#27
0.27
0.72
1.96
0.37
4.21
1.01
nd
92
X
3 0.054* 0.09* 0.33* 0.09* 1.05*** 0.28* 0.05nsX
12
-0.233*** -0.83*** -2.23*** -0.45*** -2.46*** -1.06*** -0.18*
X
22
-0.056ns -0.08ns -0.16ns -0.01ns -0.36ns -0.23ns 0.02ns
X
32
-0.011ns -0.03ns 0.02ns -0.02ns -0.12ns -0.13ns 0.04ns
X
1X
2
-0.010ns 0.07ns 0.03ns 0.05ns 0.04ns 0.14ns nd7ns
X
1X
3 nd08ns 0.05ns 0.03ns 0.04ns 0.33ns 0.07ns nd1nsX
2X
3 -nd8ns 0.05ns -0.10ns 0.01ns nd5ns -0.07ns nd1ns98
significant p < 0.01; * significant p < 0.05; ns not significant.
106
6
103.80
27.11
16.28
8.56
7
83.81
15.78
12.07
9.63
8
99.07
33.72
28.73
12.36
9
97.65
27.98
16.39
8.46
10
51.33
11.47
8.53
7.87
11
122.82
48.72
34.37
16.71
12
128.12
25.43
15.14
7.69
13
64.47
6.64
11.25
6.84
14
152.73
58.23
37.16
15.16
15
110.01
39.62
23.91
12.50
16
100.01
10.13
4.20
7.51
17
146.98
55.62
37.72
17.27
18
131.23
37.82
21.36
11.13
19
46.02
9.14
10.49
8.96
20
173.26
68.15
44.67
21.05
21
120.16
29.77
16.91
8.60
22
65.86
15.06
11.36
7.15
23
172.09
67.02
47.25
21.30
24
105.13
45.98
23.52
12.17
25
143.49
15.40
9.60
8.30
26
183.80
74.32
49.13
22.93
27
101.26
34.02
20.75
10.64
110
Values are means of 3 independent replicates; colours represent the relative activities or contents, from blue (for
111
relative low activities or contents) to red (for relative high activities or contents); 1 extraction conditions are
112
described in Table 2; Two antioxidant assays were conducted: CUPRAC (expressed as ascorbic acid equivalent
113
antioxidant capacity (AEAC, in µM AEAC)) and the inhibition of advanced glycation end product (AGE) formation
114
(expressed in % of inhibition relative to a control obtained by measuring the activity of the corresponding extraction