Study of thermal behavior of microlayer under
vapor bubble at liquid boiling
Anton Surtaev*, Vladimir Serdyukov, and Andrey Chernyavskiy
Kutateladze Institute of Thermophysics, Novosibirsk, 1 Akad. Lavrentiev ave., Russia
Abstract. The results of experimental study of evolution of temperature fields under single vapor bubble obtained by high-speed infrared thermometry with high spatial resolution (13 m) are presented in this paper. The data were obtained at pool boiling of saturated ethanol and deionized water at atmospheric pressure. Reconstruction of local instantaneous heat flux distribution on the heater surface was carried out with the use of numerical simulation. It is shown that maximal local heat flux was observed in the microlayer region on the bubble growth stage and reached the value an order of magnitude greater than the input heat flux. Based on the results of experimental and numerical researches the estimations of the microlayer thickness were carried out at pool boiling of water and ethanol, which are in good agreement with the experimental data presented in the literature and obtained using laser interferometry.
1 Introduction
Nucleate boiling is common and one of the most effective heat transfer mechanisms, it is widely used in various industrial applications: energy and chemical industry, nuclear power plants, electronics cooling system, etc. Despite of large number of papers published since the middle of the last century and devoted to the study of different aspects of the liquid boiling, many questions remain open and there is no generally accepted boiling theory [1]. This is associated with the fact, that boiling is very complicated process by the need to consider phenomena that occur over multiple length scales, ranging from centimeters, down to few nanometers. In particular, the importance of the evaporation from a liquid microlayer with a thickness of several microns, developing underneath a bubble during its initial growth, still debated in scientific society.
In last decade, new experimental techniques with high temporal and spatial resolution, including infrared thermometry, laser interferometry, PIV, etc., that allow to discover the boiling process on microscale are developed. For example laser interferometric method is widely used in recent years to determine the thickness of the microlayer under single vapor bubbles at different time [2-4]. With the use of PIV technique authors [5] analyzed the hydrodynamics of microflows at bubble appearance, growth and detachment from the surface. In recent years, a general method to study the evolution of temperature field under single vapor bubble is the high-speed infrared thermometry (IR) [3-9]. This technique
allows to investigate not only integral heat transfer but also the main local characteristics at boiling such as nucleation site density, nucleation frequency, local heat transfer under vapor bubble, etc. For reconstruction of local instantaneous heat flux distribution on the thin heaters some authors [3, 4] used commercially available computational fluid dynamics (CFD) software package. Also it should be noted that many of the experimental data on the evolution of the temperature field obtained using the IR method, are presented in the literature only for certain values of the heat fluxes and only for water. Therefore, for a deeper analysis of local heat transfer beneath a single vapor bubbles the further research in a wide range of heat fluxes and the use of fluids with different physical properties is needed.
The aim of this research is the experimental investigation of evolution a temperature field under single vapor bubbles using IR method with high temporal (1000 fps) and spatial (13 m) resolutions at pool boiling of water and ethanol at saturation line in wide range of heat fluxes. The second task is to develop numerical algorithm for reconstruction of local
instantaneous heat flux distribution on the heater with the use of obtained experimental
results of unsteady temperature field.
2 Experimental techniques
Experiments were carried out at pool boiling of saturated ethanol and deionized water at atmospheric pressure. Detailed description of the experimental setup and measurement techniques is presented in [9]. Thin (1 μm) conductive indium tin oxide (ITO) with exposed area of 30 × 20 mm2, vacuum deposited onto 400 μm thick sapphire substrate was used as
the heater. The main advantage of usage ITO film as a heater is its property to be opaque in the mid-IR spectrum (3-5 μm) and to be transparent for visible spectrum (380-750 nm). When it deposited onto thin sapphire substrates, which is transparent to both IR and visible spectrum, it became possible to investigate unsteady temperature field of ITO film by infrared recording and to observe the dynamics of vapor bubbles and contact line with the use of high-speed video camera.
Measurements of the surface temperature field were performed by high speed infrared thermographic recording (IR) with the use of FLIR Titanium HD 570M camera (spectral range 3.7-4.8 μm). Thermographic recording was made with frame rate of 1000 fps at resolution up to 13 μm/px. High-speed visualization (HSV) was performed using Vision
Research Phantom v. 7.0 camera with 2000 fps and resolution of 640 × 480 (1 px ≈ 0.07
mm). A quick-response incandescent lamp located under the work area was used to synchronize IR and HSV recordings in time. For correct signal conversation of the IR camera in temperature in order to account for the unknown surface emissivity the calibration experiments were carried out.
3 Numerical simulations
Reconstruction of the temperature fields and calculation of the heat fluxes based on experimental IR-thermometry data have been performed by cooperative solving of unsteady heat conductivity equation in the ITO film and sapphire substrate.
Because of small thickness of the ITO film local temperature was assumed equal throughout the thickness of the heater and solution of heat conductivity equation has been performed in 1D calculation area. With the presented assumptions heat conductivity equation looks like the following:
2 2
x T t
T
allows to investigate not only integral heat transfer but also the main local characteristics at boiling such as nucleation site density, nucleation frequency, local heat transfer under vapor bubble, etc. For reconstruction of local instantaneous heat flux distribution on the thin heaters some authors [3, 4] used commercially available computational fluid dynamics (CFD) software package. Also it should be noted that many of the experimental data on the evolution of the temperature field obtained using the IR method, are presented in the literature only for certain values of the heat fluxes and only for water. Therefore, for a deeper analysis of local heat transfer beneath a single vapor bubbles the further research in a wide range of heat fluxes and the use of fluids with different physical properties is needed.
The aim of this research is the experimental investigation of evolution a temperature field under single vapor bubbles using IR method with high temporal (1000 fps) and spatial (13 m) resolutions at pool boiling of water and ethanol at saturation line in wide range of heat fluxes. The second task is to develop numerical algorithm for reconstruction of local
instantaneous heat flux distribution on the heater with the use of obtained experimental
results of unsteady temperature field.
2 Experimental techniques
Experiments were carried out at pool boiling of saturated ethanol and deionized water at atmospheric pressure. Detailed description of the experimental setup and measurement techniques is presented in [9]. Thin (1 μm) conductive indium tin oxide (ITO) with exposed area of 30 × 20 mm2, vacuum deposited onto 400 μm thick sapphire substrate was used as
the heater. The main advantage of usage ITO film as a heater is its property to be opaque in the mid-IR spectrum (3-5 μm) and to be transparent for visible spectrum (380-750 nm). When it deposited onto thin sapphire substrates, which is transparent to both IR and visible spectrum, it became possible to investigate unsteady temperature field of ITO film by infrared recording and to observe the dynamics of vapor bubbles and contact line with the use of high-speed video camera.
Measurements of the surface temperature field were performed by high speed infrared thermographic recording (IR) with the use of FLIR Titanium HD 570M camera (spectral range 3.7-4.8 μm). Thermographic recording was made with frame rate of 1000 fps at resolution up to 13 μm/px. High-speed visualization (HSV) was performed using Vision
Research Phantom v. 7.0 camera with 2000 fps and resolution of 640 × 480 (1 px ≈ 0.07
mm). A quick-response incandescent lamp located under the work area was used to synchronize IR and HSV recordings in time. For correct signal conversation of the IR camera in temperature in order to account for the unknown surface emissivity the calibration experiments were carried out.
3 Numerical simulations
Reconstruction of the temperature fields and calculation of the heat fluxes based on experimental IR-thermometry data have been performed by cooperative solving of unsteady heat conductivity equation in the ITO film and sapphire substrate.
Because of small thickness of the ITO film local temperature was assumed equal throughout the thickness of the heater and solution of heat conductivity equation has been performed in 1D calculation area. With the presented assumptions heat conductivity equation looks like the following:
2 2 x T t TCp ITO ITO
.
(1)Volume heat sources σ could be presented as the superposition of three components:
ITO S L in q q q
,
(2)where qin – power of electric heating generated in ITO film per unit surface area, qL – heat flux density taken by the liquid, qS – heat flux density taken by the sapphire substrate. The heat flux density taken by the liquid could be obtained from (1), (2) and looks like the following:
p ITO SITO ITO ITO in L q t T C x T q q
22
,
(3)which is consistent with the mathematical formulation used in [7]. In presented work dimensional and time derivatives were calculated from experimentally obtained temperature fields. The heat flux density from ITO film to sapphire substrate was calculated using (4) from the temperature field in the sapphire which was obtained as a solution of the heat conductivity equation (5) in 2D calculation area (x,y):
0 y S
s Ty
q
(4)
2 2 2 2 y T x T t T Cp S S (5)
Temperature of the sapphire substrate on the interface with the ITO film (y = 0) was assumed to be equal to the ITO film temperature for all the calculated moments of time. On the opposite surface of the sapphire substrate (y = δs) first derivative of y-axis was assumed
to be zero. In order to smooth the edge effects temperature on the side surfaces of the substrate was assumed to be equal to the ITO film temperature. Temperature of ITO film and sapphire substrate were assumed to be equal to T0 at the initial moment of time.
4 Results and discussion
With the use of synchronized high speed IR thermography and video recording there were obtained the new experimental data of heat transfer coefficients, nucleation site density, frequency and temporal charactestics of nucleation process, dynamics of vapor bubble growth and detachment. The detailed description and analysis of these data are presented in [9, 10]. In this paper we focus on the study of local heat transfer under single vapor bubble at liquid boiling obtained by macro IR thermometry and numerical simulation.
The frames of high-speed macro IR thermography of temperature field evolution under active nucleation site at boiling of water at q = 50 kW/m2 are presented in Fig.1. Data
Fig. 1. High-speed IR camera images of evolution of temperature field under single vapour bubble at water boiling (q = 50 kW/m2). Spatial and temporal resolutions are 13 m and 1 ms, respectively.
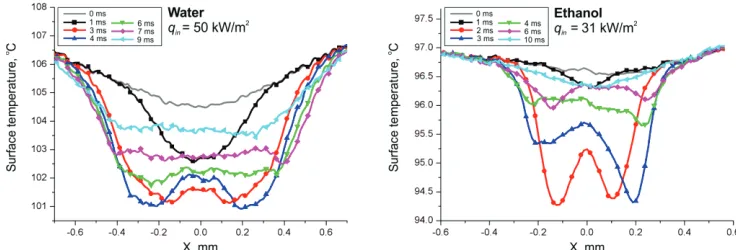
Fig. 2. The temperature distribution on the heater surface under individual vapor bubble at pool boiling of water and ethanol. x is coordinate along the bubble base (see Fig.1).
As it was shown in chapter 1 some authors for reconstruction of local instantaneous
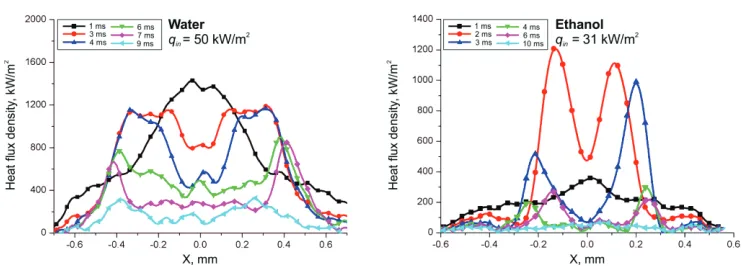
heat flux distribution on the thin heaters have used commercially available CFD software package. The aim of this research was numerical simulation of local heat transfer under individual vapor bubble at boiling with the use of obtained temperature fields and own-designed software based on the finite differences. The local heat flux distributions on the wall at different times at boiling of water and ethanol are presented on the Fig. 3 at low input heat fluxes. The graph shows that the maximum heat flux density is observed in microlayer and reaches about 1.2 MW/m2 for water and ethanol. The resulting heat flux distributions at the region of active nucleation site at boiling of water are consistent with the data of [3]. With the use of heat flux maps and temperature field under individual vapor bubble the microlayer thickness can be estimated using the following equation:
ml sat ITO fl
cond T T
q ( ). (6)
Fig. 1. High-speed IR camera images of evolution of temperature field under single vapour bubble at water boiling (q = 50 kW/m2). Spatial and temporal resolutions are 13 m and 1 ms, respectively.
Fig. 2. The temperature distribution on the heater surface under individual vapor bubble at pool boiling of water and ethanol. x is coordinate along the bubble base (see Fig.1).
As it was shown in chapter 1 some authors for reconstruction of local instantaneous
heat flux distribution on the thin heaters have used commercially available CFD software package. The aim of this research was numerical simulation of local heat transfer under individual vapor bubble at boiling with the use of obtained temperature fields and own-designed software based on the finite differences. The local heat flux distributions on the wall at different times at boiling of water and ethanol are presented on the Fig. 3 at low input heat fluxes. The graph shows that the maximum heat flux density is observed in microlayer and reaches about 1.2 MW/m2 for water and ethanol. The resulting heat flux distributions at the region of active nucleation site at boiling of water are consistent with the data of [3]. With the use of heat flux maps and temperature field under individual vapor bubble the microlayer thickness can be estimated using the following equation:
ml sat ITO fl
cond T T
q ( ). (6)
Estimations obtained by this equation show that microlayer thickness on the stage of vapor bubble growth at boiling of water and ethanol ranged from 0.5 to 5 microns, which are in good agreement with the experimental data presented in the literature and obtained using laser interferometry [2, 3].
Fig. 3. The local heat flux distribution on the heater surface under individual vapor bubble at pool boiling of water and ethanol.
In the future, on the basis of experimental data of the evolution of the temperature field under the individual vapor bubbles at boiling of water and ethanol, obtained in a wide range of heat fluxes using the high-speed infrared thermography with max. resolution of 13
m, and using the developed numerical algorithm, a detailed theoretical analysis of heat transfer in the vapor bubble will be held. This analysis will allow to define the influence of the input heat flux and liquid properties on the nucleation frequency, dynamic characteristics and the local heat transfer in the microlayer region, formed under the vapor bubbles, in order to determine the basic mechanism of highly effective heat transfer at liquid boiling and to improve the macroscopic boiling models.
This work was supported by the Russian Foundation for Basic Research (Grant No. 17-08-01342).
References
1. V. V. Yagov, Heat transfer in one-phase media and at phase transitions (Publishing House MPEI, 2014) (in Russian)
2. M. Gao, L. Zhang, P. Cheng, X. Quan, Int. J. Heat Mass Transfer 57, 1 (2013) 3. S. Jung, H. Kim, Int. J. Heat Mass Transfer 73 (2014)
4. S. Jung, H. Kim, Heat Transfer Engineering 36, 12 (2015)
5. X. Duan, B. Phillips, T. McKrell, J. Buongiorno, Exp. Heat Transfer 26, 2-3 (2013) 6. C. Gerardi, J. Buongiorno, L. W. Hu, T. McKrell, Int. J. Heat Mass Transfer 53, 19
(2010)
7. I. Golobic, J. Petkovsek, D. B. R. Kenning, Int. J. Heat Mass Transfer 55, 4 (2012) 8. J. Petkovsek, Y. Heng, M. Zupancic, H. Gjerkes, F. Cimerman, I. Golobic, Int. J.
Refrigeration 61 (2016)