Article
A Novel Hybrid Approach Based on Instance Based
Learning Classifier and Rotation Forest Ensemble for
Spatial Prediction of Rainfall-Induced Shallow
Landslides Using GIS
Quang-Khanh Nguyen 1, Dieu Tien Bui 2,*, Nhat-Duc Hoang 3, Phan Trong Trinh 4, Viet-Ha Nguyen 5 and Isık Yilmaz 6
1 Faculty of Information Technology, Hanoi University of Mining and Geology, Duc Thang, Bac Tu Liem, Hanoi 100000, Vietnam; e-mail: [email protected]
2 Geographic Information System Group, Department of Business and IT, University College of Southeast Norway, Gullbringvegen 36, N-3800 Bø i Telemark, Norway
3 Faculty of Civil Engineering, Institute of Research and Development, Duy Tan University, P809 - K7/25 Quang Trung, Danang, Vietnam; e-mail: [email protected]
4 Institute of Geological Sciences, Vietnam Academy of Sciences and Technology (VASC), 84 Chua Lang Street, Dong da, Hanoi, Vietnam; e-mail: [email protected]
5 Faculty of Geomatics and Land Administration, Hanoi University of Mining and Geology, Duc Thang, Bac Tu Liem, Hanoi 100000, Vietnam; e-mail: [email protected]
6 Department of Geological Engineering, Faculty of Engineering, Cumhuriyet University, Sivas, Turkey; e-mail: [email protected]
* Correspondence: [email protected]/[email protected]; Tel.: +47-96677678
Abstract: This study proposes a novel hybrid machine learning approach for modeling of rainfall-induced shallow landslides. The proposed approach is a combination of an instance-based learning algorithm (k-NN) and Rotation Forest (RF), state of the art machine techniques that have seldom explored for landslide modeling. The Lang Son city area (Vietnam) is selected as a case study. For this purpose, a spatial database for the study area was constructed, and then, was used to build and evaluate the hybrid model. Performance of the model was assessed using Receiver Operating Characteristic (ROC), area under the ROC curve (AUC), success rate and prediction rate, and several statistical evaluation metrics. The results showed that the model has high performance with both the training data (AUC = 0.948) and the validation data (AUC = 0.848). The results were compared with those obtained from soft computing techniques i.e. Random Forest, J48 Decision Trees, and Multilayer Perceptron Neural Networks. Overall, the performance of the proposed model is better than those obtained from the above methods. Therefore, the proposed model is a promising tool for landslide modeling. The research result can be highly useful for land use planning and management in landslide prone areas.
Keywords: landslide;classifier ensemble; instance based learning; Rotation Forest; GIS; Vietnam
1. Introduction
Development of landslide mitigation strategy is considered to be the most effective and economical way to reduce landslide losses and minimize landslide risks [1]. Therefore, reliable landslide susceptibility and hazard maps is a key point for the development and is clearly stated by the United Nations [2]. However, producing of these reliable maps is not a simple task because landslides are triggered by complex processes and relate to many causal factors. Although the recent developments of Remote Sensing and GIS (Geographic Information Systems) have provided powerful tools for acquisition and processing of high quality data for landslide studies, however, the prediction power of landslide models is still a debated subject because the quality of susceptibility
maps is clearly dependent on the method used [3-6]. Thus, the overall performance (the goodness of fit and the prediction power) of landslide models is not only dependent on the quality of input data but also on methods and techniques used. Therefore various approaches have been proposed in the literature for landslide susceptibility mapping. These methods and techniques vary from simple expert knowledge to sophisticated mathematical procedures and in general, they could be divided into qualitative and quantitative groups [7]. The first group is clearly subjective because they depend heavily on expert knowledge whereas the second one is relatively objective [8].
The second group could be further categorized into three main topics: deterministic methods, statistical methods, and data mining. In general, the deterministic methods have the most accurate results due to data dependency and site-specific nature and are most suitable for site-specific locations in localized scales [9]. For large areas, application of deterministic methods is almost impossible due to the difficulty of collecting detailed geo-engineering data, therefore the use of statistical and soft computing methods has increased [10]. The statistical methods are considered to be suitable for the mapping of landslide susceptibility over large areas and using the statistical hypothesis that future landslides will occur under the same geo-environmental conditions that produce them in the past. Therefore, large amounts of data need to be collected and processed and these tasks are time consuming and involve various complex processes [11]. More importantly, because the prediction capability of statistical models is still not sufficient, data mining has been considered.
Being a branch of artificial intelligence, data mining can be defined as processes of analyzing observational data to find internal relationships and representing them in novel ways that are useful and easier understandable [12,13]. Data mining includes multiple steps i.e. data selection, pre-processing and transformation, analysis with computational algorithms, interpretation and evaluation of the results [14]. The most common data mining methods used in landslide modelling are artificial neural networks [11,15,16], support vector machines [17-21], decision trees [10,20,22], and neuro-fuzzy [23,24]. Literature review shows that new data mining algorithms are suitable for landslide modeling for large and complex areas with good results [3,25-28], and in general, data mining models outperform conventional methods [10,29-31]. However, recent studies on landslide modeling show that the overall performance of prediction models could be enhanced with the use of ensemble frameworks [29,32,33]. Therefore, investigation of these frameworks for landslide modeling should be carried out.
Starting in the early 1990s, ensemble-based systems have become an important research area in machine learning with various techniques have been proposed. These systems can be established through combinations of two or more methods and techniques [34-38] or ensemble frameworks such as Stacking, Bagging, AdaBoost, Random Subspace, MultiBoost, Random Forests, DECORATE, and Rotation Forest [39,40]. Although these ensemble-based systems often improve performances of base classifiers, the Rotation Forest outperforms the others in term of accuracy and diversity in various datasets [39]. In addition, exploration of the Rotation Forest for landslide analysis has seldom been carried out.
2. Study area and data
2.1 Study area
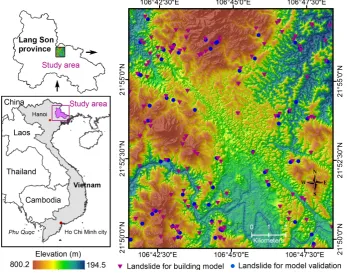
The study area is located in the Lang Son city area, near the Vietnam-China border, which belongs to the north-eastern part of Vietnam (Figure 1). It covers an area of about 168 km2, between longitudes 106°41′34′′E and 106°48′32′′E, and latitudes 21°49′43′′N and 21°57′13′′N. The altitude varies from 194.5 m to 800 m above sea level with the mean of the altitude is 328 m and the standard deviation is 84.7 m. Slope angles in the study area are from 0o to 84o. Approximately 23.7% of the
study area has ground slopes less than 8° and about 10.2% fall in slopes from 8o-15o. Around 21.1% of
the study area falls in slopes 15°-25° whereas areas with slope 25°- 45° account 43.5% of the total study area. Only 1.5% of the study area has slopes larger than 45°.
Forest land covers around 43.4% of the total study area, in which, 35.7% of the land is productive forest and 7.7% of the land is protective forest. Settlement areas cover 6.9% of the total study area whereas barren land and paddy land cover 20.4% and 21.5% paddy land of the total study area. The soil types are mostly ferralic acrisols that accounts for 78.5% of the total study area. The distribution of other soil types as: dystric gleysols (6.1%), rhodic ferralsols (5.8%), eutric fluvisols (4.8%), plinthic acrisols (1.3%), and dystric fluvisols (1.2%).
Geologically, Quaternary deposits cover around 16% of the total study area that consists of granule, grit, breccia, boulder, sand, and clay. The other areas are covered by six lithological formations i.e. Na Khuat, Tam Lung, Khon Lang, Lang Son, Tam Danh, and Mau Son. The main lithologies are marl, siltstone, tuffaceous conglomerate, gritstone, sandstone, basalt, and clay shale.
The study area is characterized by monsoonal climate with rainy or dry seasons. The rainy season is normally from May to September whereas the dry season is from October to April. The average rainfall is in the range from 1200 mm - 1600 mm annually [42].
2.2 Data used
Historical landslide records are the first required data for the assessment of landslide susceptibility. In the study, the landslide inventory map with a total of 172 historical landslides prepared earlier by [42] was used. This map was constructed from several sources such as: (i) interpretation of orthorectified aerial photographs with spatial resolution of 1 m that were acquired by the Aerial Photo - Topography Company (Vietnam) in 2003; (ii) a landslide inventory map constructed by Tam, et al. [43]; (iii) a landslide inventory map compiled by Truong, et al. [44]; (iv) landslide locations identified from field surveys in 2012.
Among the historical landslides, 86 locations are rotational slides that account for 50% of the total landslides, whereas 52 locations are translational slides and account for 30.2% of the total landslides. The remaining inventories are debris slides with 34 locations and account for 19.8% of the total landslides. It is noted that rock falls are very few in this study and were excluded in this analysis.
Figure 1. Location of the study area and landslide inventory
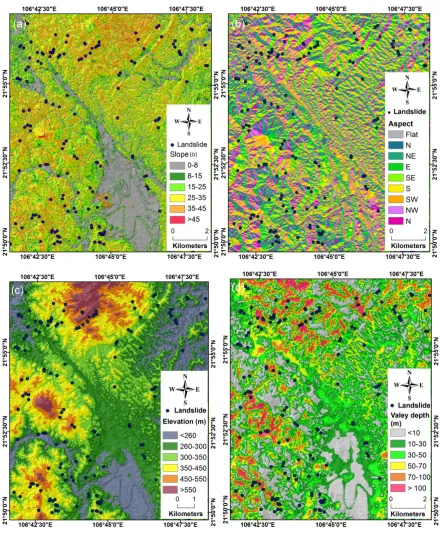
Figure 2. (a) Slope map; (b) Aspect; (c) Elevation; (d) Valley depth
Data mining techniques for the assessment of landslide susceptibility at a regional scale require the use of large amounts of non-morphometric factors for reliable analysis [10,51], therefore factors in the geographical and geological domains i.e. landuse, soil type, lithology and distance to faults
were used [11]. The landuse map for the study area was extracted from the Land Use Status Map of the Lang Son province at a scale of 1:50,000, a result of the Status Land Use Project of the National
Land Use Survey in Vietnam in 2010. For analysis, the landuse map was constructed with nine classes (Figure 2e). These classes were generalized from 21 original types in the the Land Use Status
Figure 2 (continue). (e) Landuse ; (f) Soil type; (g) Lithology; (h) distance to faults. ACL: Annual crop land; PA: Populated area; PTL: Protective forest land; PDL: Productive forest land; PL: Paddy land;
BL: Barren land; PCL: Perennial crop land; WSL: Water surface land; GL: Grass land; FA: Ferralic acrisols; DG: Dystric gleysols; PA: Plinthic acrisols; WA: Water area; DF: Dystric fluvisols; EF: Eutric
fluvisols; RF: Rhodic ferralsols; RM: Rocky mountain; CO: Conglomerate; and QD: Quaternary deposit.
and Khon Lang formations); (iii) basalt (Tam Danh formation); (iv) siltstone (Na Khuat và Dong Dang formations); (v) limestone (Diem He and Bac Son formations); (vi) sandstone (Lang Son, Mau Son, and Ha Coi formations), and (vii) Tuff (Tam Lung formation). Distance to faults was included in this analysis because fracturing and shearing play critical roles in slope instability [54]. In this study, the distance to faults map (Figure 2h) was compiled by buffering the fault lines. Five fault buffer categories were constructed based on an analysis of the landslide inventory map: 0–100, 100–200, 200–300, 300–400, and >400 m.
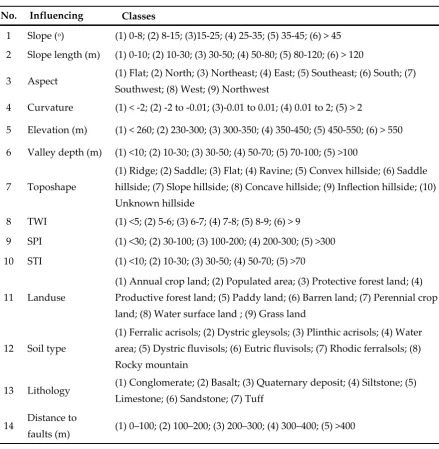
Table 1. Landslide influencing factors and their classes used in this study.
No. Influencing Classes
1 Slope (o) (1) 0-8; (2) 8-15; (3)15-25; (4) 25-35; (5) 35-45; (6) > 45
2 Slope length (m) (1) 0-10; (2) 10-30; (3) 30-50; (4) 50-80; (5) 80-120; (6) > 120
3 Aspect (1) Flat; (2) North; (3) Northeast; (4) East; (5) Southeast; (6) South; (7) Southwest; (8) West; (9) Northwest
4 Curvature (1) < -2; (2) -2 to -0.01; (3)-0.01 to 0.01; (4) 0.01 to 2; (5) > 2
5 Elevation (m) (1) < 260; (2) 230-300; (3) 300-350; (4) 350-450; (5) 450-550; (6) > 550
6 Valley depth (m) (1) <10; (2) 10-30; (3) 30-50; (4) 50-70; (5) 70-100; (5) >100
7 Toposhape
(1) Ridge; (2) Saddle; (3) Flat; (4) Ravine; (5) Convex hillside; (6) Saddle hillside; (7) Slope hillside; (8) Concave hillside; (9) Inflection hillside; (10)
Unknown hillside
8 TWI (1) <5; (2) 5-6; (3) 6-7; (4) 7-8; (5) 8-9; (6) > 9
9 SPI (1) <30; (2) 30-100; (3) 100-200; (4) 200-300; (5) >300
10 STI (1) <10; (2) 10-30; (3) 30-50; (4) 50-70; (5) >70
11 Landuse
(1) Annual crop land; (2) Populated area; (3) Protective forest land; (4)
Productive forest land; (5) Paddy land; (6) Barren land; (7) Perennial crop land; (8) Water surface land ; (9) Grass land
12 Soil type
(1) Ferralic acrisols; (2) Dystric gleysols; (3) Plinthic acrisols; (4) Water area; (5) Dystric fluvisols; (6) Eutric fluvisols; (7) Rhodic ferralsols; (8)
Rocky mountain
13 Lithology (1) Conglomerate; (2) Basalt; (3) Quaternary deposit; (4) Siltstone; (5) Limestone; (6) Sandstone; (7) Tuff
14 Distance to
faults (m) (1) 0–100; (2) 100–200; (3) 200–300; (4) 300–400; (5) >400
3. Theoretical background of the methods used
3.1 Instance based learning algorithm
Consider a training dataset (X,Y) with X =(X1, X2, …, Xn) and Yϵ[1,0]. In current context of
landslide susceptibility analysis, Xi is an input vector that represents the 14 influencing factors
(slope, slope length, aspect, curvature, elevation, valley depth, toposhade, TWI, SPI, STI, landuse, soil type, lithology, and distance to faults), and Yi is the two classes, landslide and non-landslide. In
the training phase, the input dataset is mapped into feature space and then the feature space is partitioned into multiple regions where decision boundaries are based on the similarity in the content of the dataset [55]. In the prediction phase, distances between pixels in the new dataset and all the training pixels are calculated. Based on k thresholds, the determination of nearest neighbors is carried out by sorting these distances. Then landslide and non-landslide classes for each of the nearest neighbors are determined. Finally, the prediction value for each pixel is obtained using simple majority of the class of nearest neighbors.
The decision rule of the k-NN model could be written as
i
i i i i
kNN
( , ) sim( , ) Z( , Y )
∈
=
X
f newdata Y newdata X X (1)
where sim(newdata,Xi) is the similarity between new data and the training data Xi; Z(Xi,Yi) is the
category value of the training data Xi.
3.2 Rotation Forest ensemble
An ensemble-based system can be constructed by combining individual classifiers in which the individual classifiers could be trained using different (i) subsets of features; (ii) training data sets; (ii) parameters of a given classifier; or (iv) classifier models [57]. The Rotation forest ensemble refers to the first case and is a technique formally introduced by Rodriguez, Kuncheva and Alonso [39]. This ensemble framework is a combination of the Random Subspace and Bagging techniques with Principal Component Analysis (PCA) to construct an ensemble classifier [40].
Using the training dataset (X,Y) with X =(X1, X2, …, Xn) and Yϵ[1,0], the training phase of Rotation
Forest ensemble is as follows:
Step1. Setup parameters: choose k-NN algorithm as the base classifier, the ensemble size (L), the number of feature subsets (K).
Step2.Training the classifier ensemble model: for i = 1… L
(a) Split X into K subsets (each subset contains M features): Si,j, for j = 1…K
- Generate S’i,j byeliminating randomly a subset of classes from.
- Generate new set S”i,j by selecting a bootstrap sample with a size 75% from S’i,j.
- Perform Principle Component Analysis on S’i,j to obtain coefficients
a ,...,a
(1)i,j (M )i,jK and then storein a matrix Ci,j.
- Arrange the matrix
C
i j, in a rotation matrixR
i as bellows:
[ ]
[ ]
[ ]
[ ]
[ ]
[ ]
1 2 K (M ) (1) ,1 ,1 (M ) (1) ,2 ,2 (M ) (1) ,K ,Ka ,...,a
0
...
0
0
a ,...,a
...
0
R
...
...
...
...
0
0
... a ,...,a
=
i i i i i i i (2)- Construct
R
iaby rearrange the rows ofR
i to match the order of the influencing factors in the(b) Construct base classifier Di using the training set
a i
YR
.Step3. Calculating landslide susceptibility index
The operation of the rotation forest for new data
X
N is as follows: (i) Build the transformeddata
Y
N=
X R
N ia run it through the L classifiers to get degree of support for the landslide and thenon-landslide classes,
d
i j, with i = 1,…,L; j = 1, 2 for the landslide and the non-landslide classes,respectively; (ii) Landslide susceptibility index (LSI) is then estimated for each pixel of
X
N usingthe average combination method as follows:
1 1
1
LSI
=
=
L ii
d
L
(3)4. Proposed hybrid modeling approach based on instance based learning algorithm and Rotation
Forest ensemble for spatial prediction of rainfall-induced shallow landslides
This section presents the proposed hybrid modeling approach for spatial prediction of rainfall-induced shallow landslides. The hybrid model was established based on an instance based
learning algorithm (k-NN) and Rotation Forest ensemble (RF). It is noted that the data preparation and processing were carried out using ArcGIS@10.2, IDRISI Selva 17.0, R programming, and
Microsoft Excel@13. The RF ensemble code is available at Kuncheva [58], whereas the proposed
hybrid model was programmed by the authors in Matlab environment. Overall concept of the
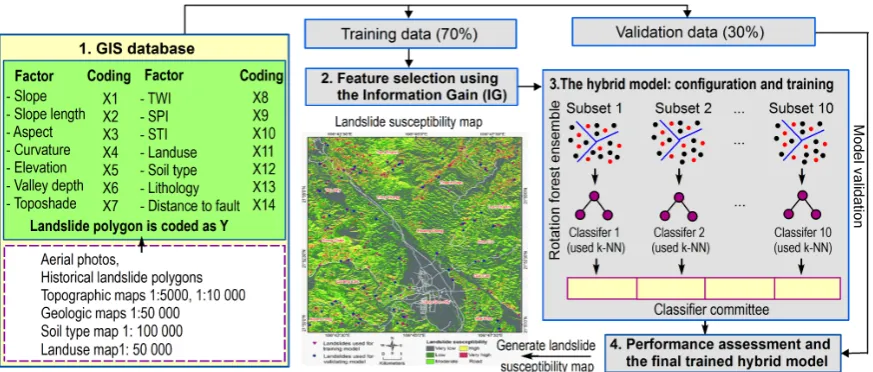
proposed hybrid modeling approach is shown in Figure 3.
Figure 3.Overall concept of the proposed hybrid modeling approach in this study
4.1 The GIS database
First, a GIS database for the study area was constructed. The database includes: (i) a landslide
aspect, curvature, elevation, valley depth, toposhade, topographic wetness index (TWI), stream power index (SPI), sediment transport index (STI), landuse, soil type, lithology, and distance to faults). These influencing factors were converted into a grid format with a resolution of 5 m.
For building susceptibility models, a total of 120 landslide locations (70%, 3973 landslide pixels) were randomly selected for training the models, whereas the remaining landslides (1664 landslide
pixels) were used for the model validation. The same amount of non-landslide pixel cells were randomly generated in the landslide-free area of the study area, and then an extraction process was
conducted to obtain values of the fourteen landslide influencing factors for the training and validation data [23]. Lastly, a coding process proposed by [11] was used to prepare the training data
and validation data for the proposed hybrid model.
4.2 Feature selection
The quality of models may be affected negatively with the use of some redundant input
variables [3]. Therefore, predictive abilities of influencing factors should be assessed using feature selection. The results could be used for the determination of the best subset of influencing factors
that not only have high predictive abilities to the output but are also uncorrelated with each other [3]. For this study, the Information Gain technique that has been successfully used recently for
feature selection and predictive ability assessment was [59] used. The information Gain (IG) is estimated using the equations as follows:
j
1
IG ( )
S =
−
mj
S Info D
=Info(D) ;
(
)
(
)
2
2 i 1
i, log i,
=
Info(D)= n Y S n Y S
S
S (2)
where D is the landslide dataset that consists of n samples and m influencing factor; n (Yi,D) is the number of samples associated with the class Yi , landslide or non-landslide; Sj is the class j of
influencing factor S.
4.3 The hybrid model: configuration and training
With the k-NN is selected as the based classifier, the configuration of the hybrid model includes determination of: (i) k value and the distance metric; (ii) ensemble size (L) and the number of feature subsets (K). Since, no rule of thumb exists for finding the optimal value of k. We use a trial and error method as suggested by Pandya, et al. [60] for finding the best value of k. Accordingly, the best value of k for this study was determined using the ten folds cross-validation method [40] by varying values of k versus classification accuracy estimated on the training data and the validation data. For distance metrics, Euclidean, Chebyshev, and Minkowski distances are widely used [61], therefore a trial and error test was carried out on the three distance metrics to select the best one.
Regarding the ensemble size, the size of 10 was used due to ability to obtain high prediction performance of classifier ensembles as suggested in Kuncheva and Rodríguez [62]. Thus, the training dataset were separated into 10 subsets, and each subset was used to build a k-NN classifier. Finally, a committee was established with 10 k-NN classifier members. The number of feature subsets (K) influences also to performance of the hybrid model. In this study, K is selected based on a
trial and error method and K of 8 is the best for the data at hand.
Finally, the model was trained and validated using the training dataset and the validation
4.4 Performance assessment and the final trained hydrid model
Modeling of landslide susceptibility can be considered to be a two-class problem where the outputs are labelled as landslide (LS) and non-landslide (NLS) classes. Therefore, four possible
outcomes such as true positive (TP), false positive (FT), true negative (TN), and false negative (FN) are used to estimate performance evaluation metric such as sensitivity, specificity, positive and
negative predictive values [3,40]. Accordingly, the performance of landslide susceptibility models was evaluated using classification accuracy, area under the Receiver Operating Characteristic
(AUC), Kappa statistic, and several statistics evaluation measures [28,63-65].
Classification accuracy is considered to be a primary statistical metric that gives a proxy measure of overall performance of susceptibility models and is defined as the percentage of
landslide and non-landslide pixels that are correctly classified. Goodness of fits and prediction capability of landslide models can be summarized with the use of AUC that is calculated from the
area under the Receiver Operating Characteristic (ROC) curve. Interpretation of AUC values were defined as poor (<0.7), fair (0.7–0.8), good (0.8–0.9), and excellent (0.9–1.0) [66].
For the case of Kappa statistic, since this metric is a percent reduction in estimation measure that takes the cost of error into account, therefore, Kappa statistic is a good statistical measure for the
inspection of landslide models. Kappa statistic value of 0 means that the agreement between the landslide models and input data is same as to be found by chance, whereas Kappa statistic value larger than 0.9 indicates that more than 90% better than random.
5. Results and analysis
5.1. Feature selection and predictive ability of landslide influencing factors
To detect if the influencing factors are correlated, the Tolerance (TOL) and Variance Inflation Factors (VIF, VIF =1/TOL) indices [67-69] that are widely used to measures of the degree
of multicollinearity was used. If VIF exceeds 10 or TOL is less than 0.1 indicates multicollinearity [70]. The analysis result in this study shows that no multicollinearity existed between any of the 14
influencing factors (Table 2).
Table 2. Correlation assessment and Information Gain (IG) of influencing factors
No. Influencing factor Tolerance VIF IG
1 Aspect 0.88 1.14 0.20
2 Slope 0.38 2.63 0.19
3 Sediment transport index 0.16 6.15 0.11
4 Stream power index 0.18 5.68 0.06
5 Distance to faults 0.90 1.11 0.05
6 Toposhade 0.68 1.46 0.05
7 Topographic wetness index 0.59 1.69 0.05
8 Curvature 0.68 1.47 0.05
9 Lithology 0.88 1.14 0.04
10 Landuse 0.91 1.10 0.03
11 Slop length 0.46 2.19 0.03
12 Soil type 0.94 1.07 0.03
13 Valley depth 0.91 1.10 0.02
The result of the feature selection analysis using the Information Gain techniques is shown in Table 2. We observe that the aspect (IG = 0.2) and the slope (IG = 0.19) have the highest predictive ability values. It is closely followed by Sediment transport index (IG = 0.11) and the stream power
index (IG = 0.06). It is reasonable because the slope is considered as the most important factors in landslide modeling [71-73]. The aspect reveals a high predictive ability because in this study 82.8%
of the landslide pixels are occurred in south, southeast, and southwest facing slopes [41]. These slopes are the main facing directions of tropical rainstorms in the northeast of Vietnam [74].
The distance to faults, the toposhade, the topographic wetness index, the curvature and the lithology have almost equal predictive ability. The lowest predictive ability is for the elevation factor
where IC is of 0.01. Although IG value is varies among factors, none of them reveals null value; therefore all the factors were used for building the hybrid model.
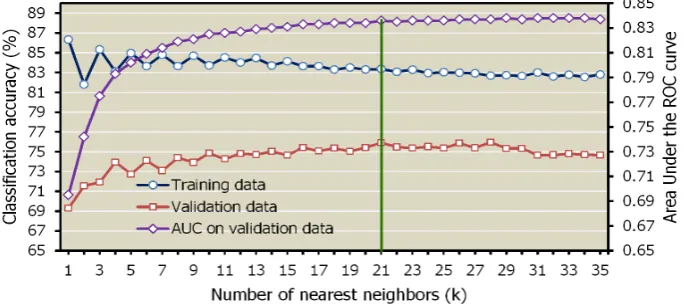
5.2 Determination of the best distance metric and k value
Figure 4 describes the change of the classification accuracies and AUC when the value of k is varied. The classification accuracy on the training data is generally decreased when the value of k is increased. The highest accuracy is 86.7% with k equal 1, decreased to 83.4% with k equal 21 and then the accuracy is generally stabilized. In contrast, the classification accuracy on the validation data is
increased when we increase the k value. The accuracy increases from the lowest one (69.4%) with k
equal 1 to the highest one (75.9%) with k is 21. The AUC of the validation data is also increased with the increasing of k, from the lowest value 0.698 with k equal 1 to 0.832 with k is 21, and at this point AUC is generally stabilized. Therefore, the nearest neighbor k equal 21 is selected for this analysis.
Figure 4. Nearest neighbor (k) versus classification accuracy Table 3. Classification accuracy of the k-NN model with different distance metrics.
No Distance metrics Classification accuracy (%)
Training data Validation data
1 Euclidean 83.3 74.4
2 Manhattan 83.4 75.9
3 Chebyshev 79.6 73.4
4 Minkowski 83.3 74.4
Table 3 showed the test result on four distance metrics for this study. We see that the landslide
distance is selected for this study. This finding agrees with Bours [75],[76], who concluded that Manhattan distance yielded the best performance in various studies.
5.3 Model training and assessment
The training result of the proposed hybrid model is shown in Table 4. We see that the hybrid model has a high degree of fit with the training data where the classification accuracy is 85.8 % and
AUC is of 0.948. The classification accuracy of the hybrid model is higher than 2.4% those obtained by the base classifier. The positive predictive value is 94.4% indicating that the probability the hybrid
model classifies pixels correctly in the landslide class is 94.4%. The negative predictive value is 77.3 %, it explains that the probability the hybrid model classifies pixels to the non-landslide class is
77.3%. The sensitivity is 80.6% indicating that 80.6% of the landslide pixels in this study are classified to the landslide class correctly. The specificity is 93.2% indicating 93.2% of non-landslide pixels are
classified to the non-landslide class correctly. Kappa statistic is 0.716 demonstrating that 71.6% better than random, a substantial agreement between the models and the training data.
Table 4 Model performance using the training data (PPV: Positive predictive value; NPV: Negative predictive value).
No Parameter Proposed hybrid
model
Random Forest model
J48 Decision Trees model
Neural Nets model
1 True positive 3579 3637 3531 3528 2 True negative 2931 3385 3296 2781
3 False positive 214 156 262 265
4 False negative 862 408 497 1012
5 PPV (%) 94.4 95.9 93.1 93.0
6 NPV (%) 77.3 89.2 86.9 73.3
7 Sensitivity (%) 80.6 89.9 87.7 77.7 8 Specificity (%) 93.2 95.6 92.6 91.3
9 Accuracy (%) 85.8 92.6 90.0 83.2
10 Kappa index 0.716 0.851 0.799 0.663 11 AUC 0.948 0.981 0.942 0.905
The prediction performances of the hybrid model are assessed using the validation data that
has not been used during the training phase. The detailed result is shown in Table 5. The result shows that the hybrid model performs well where the classification accuracy is 76.1 % and AUC is of
0.848. The positive predictive value of 75.5% indicating that the probability the ensemble model classifies pixels correctly in the landslide class is 75.5%. The negative predictive value is 76.8 %
indicating that the probability the hybrid model classifies pixels to the non-landslide class is 76.8%. The sensitivity of 76.5% indicates that 76.5% of the landslide pixels are classified correctly to the
Table 5. Model validation using the validation data (PPV: Positive predictive value; NPV: Negative predictive value).
No Parameter Proposed hybrid
model
Random Forest model
J48 Decision Trees model
Neural Nets model
1 True positive 1256 762 1017 1227 2 True negative 1278 1528 1421 1176 3 False positive 408 902 647 437 4 False negative 386 135 242 488
5 PPV (%) 75.5 45.8 61.1 73.7
6 NPV (%) 76.8 91.9 85.5 70.7
7 Sensitivity (%) 76.5 85.0 80.78 71.6 8 Specificity (%) 75.8 62.9 68.71 72.9 9 Accuracy (%) 76.1 68.8 73.3 72.2 10 Kappa index 0.523 0.376 0.466 0.444
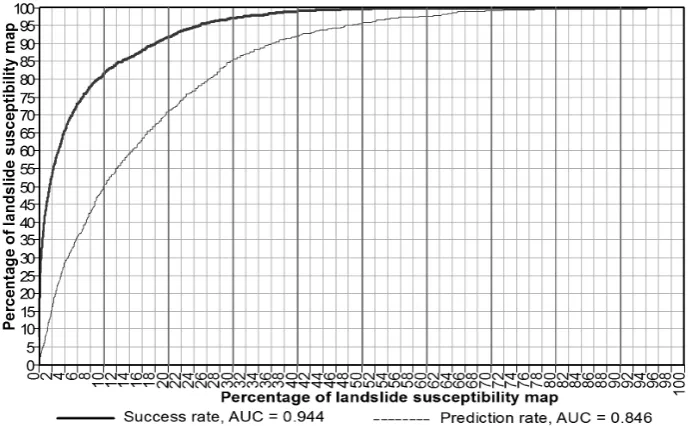
The performance and prediction power of the hybrid model is further verified using the
success-rate and prediction-rate method [77] as suggested in [33]. The success-rate curve was obtained by comparing the landslide susceptibility indices with the landslide pixels in the training data (3793 landslide pixels). In the same way, the prediction-rate curve was constructed but using
the landslide pixels in the validation data (1164 landslide pixels). Then the areas under the two curves (AUC) were estimated (Figure 5). It could be observed that the AUC of the success-rate is
0.944 indicating a high degree of fit of the ensemble model with the training pixels. The AUC of the prediction rate is 0.846 indicating that the prediction power of the model is high.
Figure 5. Success-rate, prediction-rate curves, and their area under the curve (AUC) for landslide susceptibility map in this study
5.4 Cartographic presentation of the landslide susceptibility map
Once the ensemble model was successfully constructed, it was used to calculate the landslide
GIS format to open in the ArcGIS 10.1 software using an application developed in C++ programming. One of critical concerns in landslide susceptibility modeling is to interpret the classes of the resulting landslide susceptibility map. For this purpose, a graphical curve was constructed
based on the cumulative percentage of landslide pixels versus landslide susceptibility map (Figure 6). First, the landslide inventory map was overlaid with the landslide susceptibility map to extract a
landslide pixel value table. Then the landslide pixel values were descending sorted corresponding to landslide susceptibility indices and cumulative percentages of landslide pixels and the susceptibility
maps were estimated.
Figure 6. Cumulative percentage of landslide pixels versus landslide susceptibility map. According to Chung, et al. [78], the study area should be classified into 5 classes based on the susceptibility index values and five percent of pixels with the highest values can be classified into
the “very high” susceptibility class. Therefore, the landslide susceptibility map in this study is classified as follows: (i) very low (40%); (ii) low (20%); (iii) moderate (20%); (iv) high (15%), and (iv)
very high (5%). Finally, thresholds that are used to separate these five susceptibility degrees are determined. The landslide susceptibility map result is shown in Figure 7.
Landslide density analysis was carried out for these susceptibility classes by overlaying all the landslide pixels on the landslide susceptibility map, and then density values were calculated.
Figure 7. Landslide susceptibility map using the proposed hybrid model for the study area
5.5. Usability assessment of the proposed hybrid model
Since this study aims to propose a new approach for landslide susceptibility mapping, therefore
the usability of the proposed hybrid model should be assessed. Accordingly, the performance of the hybrid model was compared with those produced by several state-of-the art methods such as
Random Forest, J48 Decision Trees, and Multi-layer Perceptron Neural Networks (Neural Nets). Random Forestis selected because this is aninnovative technique and has just recently used for
this method has successfully applied in many fields with high accuracy, including landslide susceptibility [29,32]. To construct the J48 Decision Trees model in this study, 10 pixels per leaf and the confident factor of 0.15 were used. These are the best parameter values that were determined
based on a test in Tien Bui, Pradhan, Revhaug and Trung Tran [32]. Neural Netis considered to be one of the best methods for modeling of complex problems such as landslides [3]. For building the
Neural Nets model, the logistic sigmoid is used as the activation function. Training iteration, learning rate, momentum were used as 500, 0.3, and 0.2, respectively as suggested in [82,83]. The
best structure of the Neural Nets model with 14 input layers, one hidden layer (6 neurons), and an output layer was determined using the method in Tien Bui, Tuan, Klempe, Pradhan and Revhaug
[3].
Figure 8. Landslide density plots of susceptibility classes for the study area (VH: Very high). The results of the training landslide susceptibility models Random Forest, J48 Decision Trees,
and Neural Net are shown in Table 4. The results show that all the three models have high performances with the training data. The highest degree of fit is for the Random Forest model (AUC
= 0.981 and Accuracy is 92.57%). The performances of the hybrid model and J48 Decision Trees models are almost the same. In contrast the Neural Net model performed worst. The prediction
performances of the three models were assessed using the validation data and the results are shown in Table 5. It could be observed that the overall prediction performances of the three susceptibility
models are lower than those obtained from the proposed hybrid model, in term of accuracy, kappa index, and PPV. Although AUC of the Random forest model (0.857) in Figure 9 is almost equal that
of the proposed model (0.848). However PPV of the landslide class is only 45.8% (Table 5) indicating that the AUC of the Random forest model is strongly influenced by the non-landslide pixels. Therefore, the prediction capability of landslides and AUC of the Random Forest model were not
corresponding strictly. This finding is in agree with [33] and [84]. In addition, the Random forest
model presents an overfitting problem (Tables 4 and 5). This is because the prediction is made based
Figure 9. ROC curves and AUC analysis using the validation data for (a) the proposed hybrid model; (b) the Random Forest model; (c) the J48 Decision Trees model; and (d) the Neural Net model.
In order to confirm the prediction performances of the proposed hybrid model better than the three susceptibility models in this study, McNemar’s test at the 95% significant level is used. The
null hypothesis is that there is no difference of the prediction performances between the classifier
ensemble model and each of the three landslide susceptibility models. The Chi-square (
χ
2) is thencalculated (using Eq.5) and then Chi-square comparisons with the critical table values at the significant level α = 5% are employed to assess the significance of differences between the
susceptibility models. If the Chi-square value exceeds the critical table values of 3.841, the null hypothesis is rejected and the prediction power of the two susceptibility models is said to be
significantly different [58].
(
)
2 ij ji 2
ij ji
1
−
−
=
+
χ
PI
PI
PI
PI
(5)where
PI
ijis the number of pixels misclassified by the susceptibility model i;PI
jiis the number ofTable 6. Statistical comparison of the prediction power of the landslide susceptibility models in this
study using Mc Nemar’s test.
No Pairwise comparison Chi-square (
χ
2) p-value Significance1 The hybrid model vs. Random Forest 687.077 < 0.0001 Yes
2 The hybrid model vs. J48 Decision Trees 181.845 < 0.0001 Yes
3 The hybrid model vs. Neural Net 10.081 0.0015 Yes
The result is shown in Table 6. We see that the lowest Chi-square (10.081) is for the proposed hybrid model vs. the Neural Net model that exceeds the critical table values of 3.841whereas p-value (0.0015) less than 0.05. The other Chi-square values are far larger than the critical table values and the p-values are also far smaller than 0.05, therefore we conclude that the prediction performance of the proposed hybrid model is significantly higher than the other landslide models in this study.
6. Discussion and conclusion
The most effective way to prevent casualties and economic losses due to landslides is to avoid constructions in the vicinity of steep terrains [88]. However, it is not possible in many areas due to
limitation of land and the rapid growth of human population [89], therefore high quality of landslide susceptibility and hazards maps is an important tool for reducing landslide risk through landuse
planning and management. However, the prediction performances of landslide susceptibility models is still one of the most debated subjects in recent decades [90]. Literature review shows that a
perfect landslide model which makes no error is almost impossible; therefore a highly accurate model for particular area requires assessment studies to find an algorithm with the highest overall performances. For this purpose, classifier ensemble approaches have been considered to be
important strategies to enhance model performances [58]. Only several of the increment of percentage of the prediction accuracy could influence the resulting landslide susceptibility [3,91].
We address this issue in this study by proposing a novel hybrid machine learning approach for mapping of rainfall-induced shallow landslides using GIS.
The proposed model is a combination of an instance base learning algorithm (k-NN) and the Rotation Forest ensemble that has seldom been used for modelling of landslide. The k-NN is one of the most well-known nonparametric algorithm and belong to the top 10 algorithms in data mining [56]. Although the k-NN algorithm is considered to be a lazy learner due to its simplicity, the algorithm has demonstrated to be one of the most useful and effective algorithms in data mining
applications [92]. The result of this study shows that the base k-NN model has a high performance (classification is 83.4%). For the case of the Rotation Forest, this is current state-of-the art ensemble
that outperforms other frameworks i.e. Bagging, AdaBoost, and Random Forest [93]. The performance of the based classifier (k-NN, classification is 83.4%, Figure 4) was increased 2.4% with the used of the Rotation Forest ensemble (classification is 85.8%, Table 4). The result in this study confirmed that the proposed model performs well in both the training and validation data in terms
The overall performance of the proposed model was further compared with those produced by J48 Decision Trees, and Neural Net. They are state-of-the art methods that are widely used in data mining [58]. Although these models in this study fits well on the training data, however their
prediction capabilities are clearly lower than the proposed model (Tables 3, 4, and 5). To confirm the difference of the prediction performances of the classifier ensemble model and the other
susceptibility assessment models, McNamar’s test should further used. The test result shows that statistically, the prediction performance of the proposed model is significantly higher (Table 6).
The determination of landslide influencing factors is a crucial point and has been discussed [95] and 14 factors have been selected for this analysis based on analysis of the landslide types as well as
the failure mechanisms, however, the influence of specific factor on the classification performance should be quantified with the use of feature selection procedures [3]. Redundant factors where
predictive ability values are null or negative should be removed from the original dataset. This will help to improve overall performances of resulting models [3,59]. In this study, the predictive abilities of the fourteen influencing factors are quantified with the use of the Information Gain technique.
The result shows that aspect and slope have the highest predictive ability value whereas the lowest value is for elevation (Table 2). The result is reasonable because most of the landslides in this study
occurred in south, southeast, and southwest facing slopes [41] and they are the main facing directions of tropical rainstorms in the northeast of Vietnam [74]. For slope, this factor is considered
to be the most important factor that influences occurrences of landslides in many areas i.e. [72], [73], and [11]. For the case of elevation factor, the elevation in this study area varies from 194.5 m to 800
m and the distribution of landslide pixels are quite even regarding to the altitude.
Overall, the results of this study have demonstrated the effectiveness of a classifier ensemble strategy with the use of the k-NN algorithm and the Rotation Forest framework for the assessment of landslide susceptibility. The classifier ensemble model outperforms the three susceptibility models in this study, therefore the proposed model is promising that could considered
as an alternative for the susceptibility mapping of rainfall-induced shallow landslides. As a final conclusion, the results in this study may useful for land use planning and management in landslide
prone areas.
Conflict of interest
The authors declare that there is no conflict of interest.
Acknowledgements
This research was supported by the Geographic Information System group, Department of Business and IT, School of Business, University College of Southeast Norway, Bø i Telemak, Norway. The authors would like to thank four anonymous reviewers for their valuable and constructive
comments on the earlier version of the manuscript
Reference
1. Elliott, C.S.; Paula, L.G. National landslide hazards mitigation strategy --a framework for loss reduction. U.S.
Geological Survey: 2005; p 64.
2. Nations;, U. International strategy for disaster reduction: Living with risk: A global review of disaster reduction
3. Tien Bui, D.; Tuan, T.A.; Klempe, H.; Pradhan, B.; Revhaug, I. Spatial prediction models for shallow
landslide hazards: A comparative assessment of the efficacy of support vector machines, artificial
neural networks, kernel logistic regression, and logistic model tree. Landslides 2016, 13, 361-378.
4. Hong, H.; Pradhan, B.; Xu, C.; Tien Bui, D. Spatial prediction of landslide hazard at the yihuang area
(china) using two-class kernel logistic regression, alternating decision tree and support vector
machines. Catena 2015, 133, 266-281.
5. Althuwaynee, O.F.; Pradhan, B.; Lee, S. A novel integrated model for assessing landslide susceptibility
mapping using chaid and ahp pair-wise comparison. International Journal of Remote Sensing 2016, 37,
1190-1209.
6. Dou, J.; Tien Bui, D.; P. Yunus, A.; Jia, K.; Song, X.; Revhaug, I.; Xia, H.; Zhu, Z. Optimization of
causative factors for landslide susceptibility evaluation using remote sensing and gis data in parts of
niigata, japan. PLoS One 2015, 10, e0133262.
7. Chung, C.-J.; Fabbri, A.G. Predicting landslides for risk analysis — spatial models tested by a
cross-validation technique. Geomorphology 2008, 94, 438-452.
8. Fell, R.; Corominas, J.; Bonnard, C.; Cascini, L.; Leroi, E.; Savage, W.Z. Guidelines for landslide
susceptibility, hazard and risk zoning for land-use planning. Engineering Geology 2008, 102, 99-111.
9. Gokceoglu, C.; Aksoy, H. Landslide susceptibility mapping of the slopes in the residual soils of the
mengen region (turkey) by deterministic stability analyses and image processing techniques.
Engineering Geology 1996, 44, 147-161.
10. Pradhan, B. A comparative study on the predictive ability of the decision tree, support vector machine
and neuro-fuzzy models in landslide susceptibility mapping using gis. Computers & Geosciences 2013,
51, 350-365.
11. Tien Bui, D.; Pradhan, B.; Lofman, O.; Revhaug, I.; Dick, O.B. Landslide susceptibility assessment in
the hoa binh province of vietnam: A comparison of the levenberg-marquardt and bayesian regularized
neural networks. Geomorphology 2012, 171–172, 12–29.
12. Mennis, J.; Guo, D. Spatial data mining and geographic knowledge discovery—an introduction.
Computers, Environment and Urban Systems 2009, 33, 403-408.
13. Shamseldin, A.Y.; O’Connor, K.M. A non-linear neural network technique for updating of river flow
forecasts. Hydrol. Earth Syst. Sci. 2001, 5, 577-598.
14. Fayyad, U.M.; Piatetsky-Shapiro, G.; Smyth, P.; Uthurusamy, R. Advances in knowledge discovery
and data mining. 1996.
15. Yilmaz, I. Landslide susceptibility mapping using frequency ratio, logistic regression, artificial neural
networks and their comparison: A case study from kat landslides (tokat-turkey). Computers &
Geosciences 2009, 35, 1125-1138.
16. Dou, J.; Yamagishi, H.; Pourghasemi, H.R.; Yunus, A.P.; Song, X.; Xu, Y.; Zhu, Z. An integrated
artificial neural network model for the landslide susceptibility assessment of osado island, japan.
Natural Hazards 2015, 1-28.
17. Yao, X.; Tham, L.G.; Dai, F.C. Landslide susceptibility mapping based on support vector machine: A
case study on natural slopes of hong kong, china. Geomorphology 2008, 101, 572-582.
18. Yilmaz, I. Comparison of landslide susceptibility mapping methodologies for koyulhisar, turkey:
Conditional probability, logistic regression, artificial neural networks, and support vector machine.
19. Kavzoglu, T.; Sahin, E.; Colkesen, I. Landslide susceptibility mapping using gis-based multi-criteria
decision analysis, support vector machines, and logistic regression. Landslides 2014, 11, 425-439.
20. Tien Bui, D.; Pradhan, B.; Lofman, O.; Revhaug, I. Landslide susceptibility assessment in vietnam
using support vector machines, decision tree and naïve bayes models. Mathematical Problems in
Engineering 2012, 2012, 1-26.
21. Tien Bui, D.; Pradhan, B.; Lofman, O.; Revhaug, I.; Dick, O.B. In Application of support vector machines in
landslide susceptibility assessment for the hoa binh province (vietnam) with kernel functions analysis,
Proceedings of the iEMSs Sixth Biennial Meeting,: International Congress on Environmental
Modelling and Software (iEMSs 2012). International Environmental Modelling and Software Society,
Leipzig, Germany, July 2012, 2012; Seppelt, R.; Voinov, A.A.; Lange, S.; Bankamp, D., Eds.
22. Nefeslioglu, H.A.; Sezer, E.; Gokceoglu, C.; Bozkir, A.S.; Duman, T.Y. Assessment of landslide
susceptibility by decision trees in the metropolitan area of istanbul, turkey. Mathematical Problems in
Engineering 2010.
23. Tien Bui, D.; Pradhan, B.; Lofman, O.; Revhaug, I.; Dick, O.B. Landslide susceptibility mapping at hoa
binh province (vietnam) using an adaptive neuro-fuzzy inference system and gis. Computers &
Geosciences 2012, 45, 199-211.
24. Pradhan, B.; Sezer, E.A.; Gokceoglu, C.; Buchroithner, M.F. Landslide susceptibility mapping by
neuro-fuzzy approach in a landslide-prone area (cameron highlands, malaysia). IEEE Transactions on
Geoscience and Remote Sensing 2010, 48, 4164-4177.
25. Dou, J.; Chang, K.-T.; Chen, S.; Yunus, A.P.; Liu, J.-K.; Xia, H.; Zhu, Z. Automatic case-based reasoning
approach for landslide detection: Integration of object-oriented image analysis and a genetic
algorithm. Remote Sensing 2015, 7, 4318-4342.
26. Pham, B.T.; Tien Bui, D.; Prakash, I.; Dholakia, M.B. Hybrid integration of multilayer perceptron
neural networks and machine learning ensembles for landslide susceptibility assessment at himalayan
area (india) using gis. Catena 2017, 149, Part 1, 52-63.
27. Tien Bui, D.; Pham, T.B.; Nguyen, Q.-P.; Hoang, N.-D. Spatial prediction of rainfall-induced shallow
landslides using hybrid integration approach of least squares support vector machines and differential
evolution optimization: A case study in central vietnam. International Journal of Digital Earth. Doi:
10.1080/17538947.2016.1169561 2016.
28. Tien Bui, D.; Nguyen, Q.-P.; Hoang, N.-D.; Klempe, H. A novel fuzzy k-nearest neighbor inference
model with differential evolution for spatial prediction of rainfall-induced shallow landslides in a
tropical hilly area using gis. Landslides. Doi: 10.1007/s10346-016-0708-4 2016.
29. Tien Bui, D.; Ho, T.C.; Revhaug, I.; Pradhan, B.; Nguyen, D. Landslide susceptibility mapping along
the national road 32 of vietnam using gis-based j48 decision tree classifier and its ensembles. In
Cartography from pole to pole, Buchroithner, M.; Prechtel, N.; Burghardt, D., Eds. Springer Berlin
Heidelberg: 2013; pp 303-317.
30. Tien Bui, D.; Pradhan, B.; Lofman, O.; Revhaug, I.; Dick, O. Regional prediction of landslide hazard
using probability analysis of intense rainfall in the hoa binh province, vietnam. Natural Hazards 2013,
66, 707-730.
31. Cheng, M.-Y.; Hoang, N.-D. A swarm-optimized fuzzy instance-based learning approach for
predicting slope collapses in mountain roads. Knowledge-Based Systems 2014.
32. Tien Bui, D.; Pradhan, B.; Revhaug, I.; Trung Tran, C. A comparative assessment between the
prediction of shallow landslides at lang son city, vietnam. In Remote sensing applications in environmental
research, Srivastava, P.K.; Mukherjee, S.; Gupta, M.; Islam, T., Eds. Springer International Publishing:
Cham, Switzerland, 2014; pp 87-111.
33. Tien Bui, D.; Ho, T.-C.; Pradhan, B.; Pham, B.-T.; Nhu, V.-H.; Revhaug, I. Gis-based modeling of
rainfall-induced landslides using data mining based functional trees classifier with adaboost, bagging,
and multiboost ensemble frameworks. Environmental Earth Sciences. Doi:10.1007/s12665-016-5919-4
2016.
34. Xiong, L.; O'connor, K.M. Comparison of four updating models for real-time river flow forecasting.
Hydrological Sciences Journal 2002, 47, 621-639.
35. Shamseldin, A.Y.; O'connor, K.M.; Nasr, A.E. A comparative study of three neural network forecast
combination methods for simulated river flows of different rainfall—runoff models. Hydrological
Sciences Journal 2007, 52, 896-916.
36. Young, C.-C.; Liu, W.-C. Prediction and modelling of rainfall–runoff during typhoon events using a
physically-based and artificial neural network hybrid model. Hydrological Sciences Journal 2015, 60,
2102-2116.
37. Young, C.-C.; Liu, W.-C.; Chung, C.-E. Genetic algorithm and fuzzy neural networks combined with
the hydrological modeling system for forecasting watershed runoff discharge. Neural Computing and
Applications 2015, 26, 1631-1643.
38. Young, C.-C.; Liu, W.-C.; Wu, M.-C. A physically based and machine learning hybrid approach for
accurate rainfall-runoff modeling during extreme typhoon events. Applied Soft Computing 2017, 53,
205-216.
39. Rodriguez, J.J.; Kuncheva, L.I.; Alonso, C.J. Rotation forest: A new classifier ensemble method. Pattern
Analysis and Machine Intelligence, IEEE Transactions on 2006, 28, 1619-1630.
40. Witten, I.H.; Frank, E.; Mark, A.H. Data mining: Practical machine learning tools and techniques (third
edition). Morgan Kaufmann: Burlington, USA, 2011; p 558.
41. Tien Bui, D.; Pradhan, B.; Revhaug, I.; Nguyen, D.B.; Pham, H.V.; Bui, Q.N. A novel hybrid evidential
belief function-based fuzzy logic model in spatial prediction of rainfall-induced shallow landslides in
the lang son city area (vietnam). Geomatics, Natural Hazards and Risk 2015, 6, 243-271.
42. Tien Bui, D.; Pradhan, B.; Revhaug, I.; Nguyen, D.; Pham, H.; Bui, Q. A novel hybrid evidential belief
function based fuzzy logic model in spatial prediction of rainfall-induced shallow landslides in the
lang son city area (vietnam). Geomatics, Natural Hazards and Risk. Doi: 10.1080/19475705.2013.843206
2013.
43. Tam, V.T.; Tuy, P.K.; Nam, N.X.; Tuan, L.C.; Tuan, N.D.; Trung, N.D.; Thang, D.V.; Ha, P.V. Geohazard
investigation in some key areas of the northern mountainous area of vietnam for the planning of socio-economic
development; Vietnam Institute of Geosciences and Mineral Resources: Hanoi, 2006; p 83.
44. Truong, P.D.; Nghi, T.H.; Phuc, P.N.; Quyet, H.B.; The, N.V. Geological mapping and mineral resource
investigation at 1:50 000 scale for lang son area; Northern Geological Mapping Division: Hanoi 2009.
45. Tien Bui, D. Modeling of rainfall-induced landslide hazard for the hoa binh province of vietnam.
Norwegian University of Life Sciences. Ph.D Thesis, Aas, Norway, 2012.
46. Meinhardt, M.; Fink, M.; Tünschel, H. Landslide susceptibility analysis in central vietnam based on an
incomplete landslide inventory: Comparison of a new method to calculate weighting factors by means
47. Lanni, C.; Borga, M.; Rigon, R.; Tarolli, P. Modelling shallow landslide susceptibility by means of a
subsurface flow path connectivity index and estimates of soil depth spatial distribution. Hydrology and
Earth System Sciences 2012, 16, 3959-3971.
48. Kavzoglu, T.; Kutlug Sahin, E.; Colkesen, I. An assessment of multivariate and bivariate approaches in
landslide susceptibility mapping: A case study of duzkoy district. Natural Hazards 2015, 76, 471-496.
49. Nefeslioglu, H.A.; Duman, T.Y.; Durmaz, S. Landslide susceptibility mapping for a part of tectonic
kelkit valley (eastern black sea region of turkey). Geomorphology 2008, 94, 401-418.
50. Tien Bui, D.; Pradhan, B.; Lofman, O.; Revhaug, I.; Dick, O.B. Spatial prediction of landslide hazards in
hoa binh province (vietnam): A comparative assessment of the efficacy of evidential belief functions
and fuzzy logic models. Catena 2012, 96, 28-40.
51. Mancini, F.; Ceppi, C.; Ritrovato, G. Gis and statistical analysis for landslide susceptibility mapping in
the daunia area (italy). Natural Hazards and Earth System Sciences 2010, 10, 1851-1864.
52. Ayalew, L.; Yamagishi, H. The application of gis-based logistic regression for landslide susceptibility
mapping in the kakuda-yahiko mountains, central japan. Geomorphology 2005, 65, 15-31.
53. Quoc, N.K.; Dan, T.H.; Hung, L.; Huyen, D.T. Geological map (binh gia group); Vietnam Institute of
Geosciences and Mineral Resources: Hanoi 1992.
54. Brideau, M.-A.; Yan, M.; Stead, D. The role of tectonic damage and brittle rock fracture in the
development of large rock slope failures. Geomorphology 2009, 103, 30-49.
55. Wan, C.H.; Lee, L.H.; Rajkumar, R.; Isa, D. A hybrid text classification approach with low dependency
on parameter by integrating k-nearest neighbor and support vector machine. Expert Systems with
Applications 2012, 39, 11880-11888.
56. Wu, X.; Kumar, V.; Quinlan, J.R.; Ghosh, J.; Yang, Q.; Motoda, H.; McLachlan, G.J.; Ng, A.; Liu, B.;
Philip, S.Y. Top 10 algorithms in data mining. Knowl. Inf. Syst. 2008, 14, 1-37.
57. Polikar, R.; DePasquale, J.; Mohammed, H.S.; Brown, G.; Kuncheva, L.I. Learn++. Mf: A random
subspace approach for the missing feature problem. Pattern Recognition 2010, 43, 3817-3832.
58. Kuncheva, L.I. Combining pattern classifiers: Methods and algorithms. Second Edition ed.; John Wiley &
Sons: Hoboken, New Jersey, USA, 2014.
59. Martínez-Álvarez, F.; Reyes, J.; Morales-Esteban, A.; Rubio-Escudero, C. Determining the best set of
seismicity indicators to predict earthquakes. Two case studies: Chile and the iberian peninsula.
Knowledge-Based Systems 2013, 50, 198-210.
60. Pandya, D.; Upadhyay, S.; Harsha, S. Fault diagnosis of rolling element bearing with intrinsic mode
function of acoustic emission data using apf-knn. Expert Systems with Applications 2013, 40, 4137-4145.
61. Premaratne, P. Effective hand gesture classification approaches. In Human computer interaction using
hand gestures, Springer: 2014; pp 105-143.
62. Kuncheva, L.I.; Rodríguez, J.J. An experimental study on rotation forest ensembles. In Multiple classifier
systems, Springer: 2007; pp 459-468.
63. Tien Bui, D.; Anh Tuan, T.; Hoang, N.-D.; Quoc Thanh, N.; Nguyen, B.D.; Van Liem, N.; Pradhan, B.
Spatial prediction of rainfall-induced landslides for the lao cai area (vietnam) using a novel hybrid
intelligent approach of least squares support vector machines inference model and artificial bee colony
optimization. Landslides. Doi: 10.1007/s10346-016-0711-9 2016.
64. Pham, B.T.; Pradhan, B.; Tien Bui, D.; Prakash, I.; Dholakia, M.B. A comparative study of different
machine learning methods for landslide susceptibility assessment: A case study of uttarakhand area
65. Hoang, N.-D.; Tien Bui, D. A novel relevance vector machine classifier with cuckoo search
optimization for spatial prediction of landslides. Journal of Computing in Civil Engineering.
doi:10.1061/(ASCE)CP.1943-5487.0000557 2016.
66. Kantardzic, M. Data mining: Concepts, models, methods, and algorithms. John Wiley & Sons: Hoboken,
New Jersey, 2011.
67. Tien Bui, D.; Lofman, O.; Revhaug, I.; Dick, O. Landslide susceptibility analysis in the hoa binh
province of vietnam using statistical index and logistic regression. Natural Hazards 2011, 59, 1413–1444.
68. O’brien, R.M. A caution regarding rules of thumb for variance inflation factors. Quality & Quantity
2007, 41, 673-690.
69. Mansfield, E.R.; Helms, B.P. Detecting multicollinearity. The American Statistician 1982, 36, 158-160.
70. Dormann, C.F.; Elith, J.; Bacher, S.; Buchmann, C.; Carl, G.; Carré, G.; Marquéz, J.R.G.; Gruber, B.;
Lafourcade, B.; Leitão, P.J. Collinearity: A review of methods to deal with it and a simulation study
evaluating their performance. Ecography 2013, 36, 27-46.
71. Van Den Eeckhaut, M.; Vanwalleghem, T.; Poesen, J.; Govers, G.; Verstraeten, G.; Vandekerckhove, L.
Prediction of landslide susceptibility using rare events logistic regression: A case-study in the flemish
ardennes (belgium). Geomorphology 2006, 76, 392-410.
72. Pradhan, B.; Lee, S. Regional landslide susceptibility analysis using back-propagation neural network
model at cameron highland, malaysia. Landslides 2010, 7, 13-30.
73. Costanzo, D.; Rotigliano, E.; Irigaray, C.; Jiménez-Perálvarez, J.D.; Chacón, J. Factors selection in
landslide susceptibility modelling on large scale following the gis matrix method: Application to the
river beiro basin (spain). Nat. Hazards Earth Syst. Sci. 2012, 12, 327-340.
74. Chen, T.-C.; Huang, W.-R.; Yen, M.-C. Interannual variation of the late spring–early summer monsoon
rainfall in the northern part of the south china sea. Journal of Climate 2011, 24, 4295-4313.
75. Bours, P. Continuous keystroke dynamics: A different perspective towards biometric evaluation.
Information Security Technical Report 2012, 17, 36-43.
76. Simari, G.I.; Earp, D.; Martinez, M.V.; Sliva, A.; Subrahmanian, V. Forecasting group-level actions
using similarity measures. In Handbook of computational approaches to counterterrorism, Springer: 2013; pp
181-199.
77. Chung, C.J.F.; Fabbri, A.G. Validation of spatial prediction models for landslide hazard mapping.
Natural Hazards 2003, 30, 451-472.
78. Chung, C.J.F.; Fabbri, A.G.; Van westen, C.J. Multivariate regression analysis for landslide hazard
zonation. In Geographical information systems in assessing natural hazards, Carrara, A.; Guzzetti, F., Eds.
Springer: New York, 1995; Vol. 5, pp 107-133.
79. Trigila, A.; Iadanza, C.; Esposito, C.; Scarascia-Mugnozza, G. Comparison of logistic regression and
random forests techniques for shallow landslide susceptibility assessment in giampilieri (ne sicily,
italy). Geomorphology 2015.
80. Catani, F.; Lagomarsino, D.; Segoni, S.; Tofani, V. Landslide susceptibility estimation by random
forests technique: Sensitivity and scaling issues. Nat. Hazards Earth Syst. Sci. 2013, 13, 2815-2831.
81. Stevens, F.R.; Gaughan, A.E.; Linard, C.; Tatem, A.J. Disaggregating census data for population
mapping using random forests with remotely-sensed and ancillary data. PLoS One 2015, 10, e0107042.
82. Were, K.; Tien Bui, D.; Dick, Ø.B.; Singh, B.R. A comparative assessment of support vector regression,
artificial neural networks, and random forests for predicting and mapping soil organic carbon stocks
83. Tien Bui, D.; Pradhan, B.; Nampak, H.; Quang Bui, T.; Tran, Q.-A.; Nguyen, Q.P. Hybrid artificial
intelligence approach based on neural fuzzy inference model and metaheuristic optimization for flood
susceptibility modelling in a high-frequency tropical cyclone area using gis. Journal of Hydrology 2016,
540, 317-330.
84. Zêzere, J.; Pereira, S.; Melo, R.; Oliveira, S.; Garcia, R. Mapping landslide susceptibility using
data-driven methods. Science of the Total Environment 2017, 589, 250-267.
85. Francke, T.; López-Tarazón, J.; Schröder, B. Estimation of suspended sediment concentration and yield
using linear models, random forests and quantile regression forests. Hydrological Processes 2008, 22,
4892-4904.
86. Shah, A.D.; Bartlett, J.W.; Carpenter, J.; Nicholas, O.; Hemingway, H. Comparison of random forest
and parametric imputation models for imputing missing data using mice: A caliber study. American
Journal of Epidemiology 2014, 179, 764-774.
87. Bui, K.-T.T.; Tien Bui, D.; Zou, J.; Van Doan, C.; Revhaug, I. A novel hybrid artificial intelligent
approach based on neural fuzzy inference model and particle swarm optimization for horizontal
displacement modeling of hydropower dam. Neural Computing and Applications 2016, 1-12.
88. Bell, F.G. Engineering geology. Second Edition ed.; Butterworth-Heinemann, Elsevier: Oxford, UK, 2007.
89. Chau, K.T.; Sze, Y.L.; Fung, M.K.; Wong, W.Y.; Fong, E.L.; Chan, L.C.P. Landslide hazard analysis for
hong kong using landslide inventory and gis. Computers & Geosciences 2004, 30, 429-443.
90. Costanzo, D.; Chacón, J.; Conoscenti, C.; Irigaray, C.; Rotigliano, E. Forward logistic regression for
earth-flow landslide susceptibility assessment in the platani river basin (southern sicily, italy).
Landslides 2014, 11, 639-653.
91. Jebur, M.N.; Pradhan, B.; Tehrany, M.S. Optimization of landslide conditioning factors using very
high-resolution airborne laser scanning (lidar) data at catchment scale. Remote Sensing of Environment
2014, 152, 150-165.
92. Garcia, S.; Derrac, J.; Cano, J.R.; Herrera, F. Prototype selection for nearest neighbor classification:
Taxonomy and empirical study. Pattern Analysis and Machine Intelligence, IEEE Transactions on 2012, 34,
417-435.
93. Rodríguez, J.; García-Osorio, C.; Maudes, J.; Díez-Pastor, J. An experimental study on ensembles of
functional trees. In Multiple classifier systems, El Gayar, N.; Kittler, J.; Roli, F., Eds. Springer Berlin
Heidelberg: 2010; Vol. 5997, pp 64-73.
94. Althuwaynee, O.F.; Pradhan, B.; Park, H.-J.; Lee, J.H. A novel ensemble decision tree-based
chi-squared automatic interaction detection (chaid) and multivariate logistic regression models in
landslide susceptibility mapping. Landslides 2014, 11, 1063-1078.