1
Structure-function correlations in sputter deposited
gold/fluorocarbon multilayers for tuning optical response
Pallavi Pandit1*, Matthias Schwartzkopf1, André Rothkirch1, Stephan V. Roth1, 2,
Sigrid Bernstorff3 and Ajay Gupta4*
1 Deutsches Elektronen-Synchrotron (DESY), Notkestraße 85, D-22607 Hamburg, Germany 2KTH Royal Institute of Technology, Department of Fibre and Polymer Technology, Teknikringen
56-58, SE-100 44 Stockholm, Sweden
3Elettra-Sincrotrone Trieste, SS 14, Km 163.5, I-34149 Basovizza, Trieste, Italy 4Center for Spintronic Materials, Amity University, UP Noida 201 313, India
Abstract:
A new strategy to nanoengineer gold/fluorocarbon multilayer (ML) nanostructures is reported. We have investigated the morphological changes occuringat the metal-polymer interface in multilayer structures with varying volume fraction of
gold (Au) and the kinetic growth aspect of the microscale properties of nano-sized Au
in plasma polymer fluorocarbon (PPFC). Investigations were carried out at various
temperatures and annealing time by means of grazing incidence small-angle and
wide-angle X-ray scattering (GISAXS and GIWAXS). We have fabricated a series of
multilayers with variying volume fraction (0.12, 0.27, 0.38) of Au and bilayer periodicity
in ML structure. They show an interesting granular structure consisting of nearly
spherical shaped nanoparticles within the polymer layer. The nanoparticle (NP)
morphology changes due to the collective effects of NPs diffusion within ensembles in
the in-plane vicinity and inter-layer with increasing temperature. The in-plane NPs size
distinctly increases (from 1.9 to 4 nm) with increasing temperature. The NPs become
more spherical thus reducing the surface energy. Linear growth of NPs with
temperature and time shows diffusion-controled growth of NPs in the ML structure. The
structural stability of the multilayer is controlled by the volume ratio of the metal in
polymer. At room temperature UV-Vis shows a blueshift of the plasmon peak from 560
nm in ML Au/PTFE_1 to 437 nm in Au/PTFE_3. We have identified the fabrication and
post-deposition annealing conditions to limit the Local Surface Plasmon resonance
(LSPR) shift (from ∆𝜆𝐿𝑆𝑃𝑅=180 nm (Au/PTFE_1) to ∆𝜆𝐿𝑆𝑃𝑅=67 nm (Au/PTFE_3 ML)) and their optical response over a wide visible wavelength range. A variation in the
dielectric constant of the polymer in precence of varying Au inclusion is found to be the
main factor affecting the LSPR frequency. Our finding may provide insights in Nano
2
engineering ML structure can be useful to systematically control the growth of NPs in
polymer matrix.
Keywords: nanocomposite, metal-polymer-interface, multilayer, structure-function correlation, indirect band gap, GISAXS, GIWAXS, UV-Vis.
Introduction:
Easy processability, high flexibility and tunable physical properties, make nanocomposites very attractive for a broad range of applications. Recently, thecombination of metal nanoparticles with dielectric media such as polymers has gained
great pertinence both in fundamental as well as technological aspects. Their fine
control and possible tuning of physical properties could lead to the fabrication of
materials with novel functional, electric and optical properties and engender their
accessibility to various applications in the field of optics, electronics and biomedicine[1–5]. These physical properties of the metal are strongly morphology dependent [6–9]. In particular, the metal undergoes a significant property change
compared to the bulk due to the quantum confinement towards nanoscale and their
large surface to volume ratio. Interfacial energy variation may also enhance their
functionality [1]. Incorporation of metallic nanoparticles (NP) into a polymer improves
the functionality of the polymer; govern by the metal-polymer interactions, which generally differ from the polymer−polymer interactions, the properties of the composite material are thus dominated by their interfacial interactions[10–13]. The morphologies
of the embedded metal NPs can be artificially modified by controlling their processing
parameters as preparation method, rate of deposition, thermal annealing etc.
[6,9,10,14]. Besides this, the volume fraction of the metal in the polymer matrix plays
a significant role in deciding the morphological structure. The conductivity of
metal-polymer nanocomposites (MPNC) varies from insulating to conducting as a function of
metal concentration. The resistivity drops by several orders of magnitude near
percolation [15]. The conductivity depends exponentially on the cluster separation near
the percolation threshold (insulator metal transition), which is proved by varying the
metal-polymer volume fraction 𝜑 = 𝑉𝑚
𝑉𝑝
with 𝑉𝑚 & 𝑉𝑃 being the volume of metal and
polymer, respectively. Furthermore, in-plane growth of nanoparticles and their effect
on the properties is limited by the percolation threshold as the metal layer above the
percolation threshold gains a three-dimensional structure[1,6,16]. Varying the metallic
volume fraction in the dielectric matrix also influences the refractive index and this can
3
MPNC can also artificially modify the morphological structure due to enhancement of
atomic mobility and diffusivity at higher temperature[18]. The resulting structure of NPs
is then driven by nucleation, thermal mobility and growth. However, the fabrication and
even more the control of the growth of nanoparticles for desired applications of such
materials is still a major challenge. To study the individual particle growth, emphasis
has been given to the MPNC multilayer (ML) structure of fixed volume fraction below
the percolation threshold of metal in varying polymer layers. Such arrangement allows
inter alia control growth of NPs in the polymer matrix. MPNC MLs have been prepared
via sputter deposition having nanofabrication capability of sequential deposition of
metal and polymer with the same precision[16,19]. Particularly, gold nanoparticles (Au
NPs) modified plasma polymer fluorocarbon (PPFC)[20] (sputtered
Polytetrafluorethylen (PTFE)) MLs has been prepared by alternating sputtering from
an Au and a PTFE target. Au NPs in the PPFC matrix show long-term stability, brilliant
optical properties and lead to a spectral optical shift upon variation in their size, shape
and surrounding dielectric matrix[21]. PTFE has high chemical stability and
comparatively high glass transition temperature with heat resistance capacity. It has
low surface free energy that supports to grow spherical shape NPs, and a high sputter
yield with low crosslinking tendency[22] making this polymer especially suitable for
sputter deposition and for such studies. The correlation of the Au NPs morphology with
the resulting optical properties of the MLs has been investigated in this study. The
structural properties of the nanocomposites and kinetic growth of NPs in polymer
matrix have been studied using grazing incidence small and wide angle X-ray
scattering (GISAXS & GIWAXS). GISAXS yields the statistically pertinent horizontal
and vertical correlation information of the changing electron density distribution [23,24]
during growth, while GIWAXS can provide information about NPs crystallinity and
kinetic growth of nanoparticles in polymer[25,26]. UV-Vis spectroscopy has been used
to study the optical properties of nanocomposites[27,28]. The optical behavior of the
nanocomposite evolves upon metal volume fraction variation due to the rearrangement
of the NPs in the polymeric matrix. The range of the plasmon peak shift depends upon
the density of implanted nanoparticles and the thickness of intermediate polymer layer.
To contextualize further the structure-function correlations, we have performed
isochronal thermal annealing of the ML structure and then compared the growth
tendencies to the optical behavior. Hereby, the first question addressed is the effect of
4
The second one is the effect of temperature induced Au NPs growth behavior in PPFC
matrix. Thus the relation of structural and optical properties during this growth is
discussed.
Experimental Details:
Sample preparation: ML structure has been prepared on optically polished Si (100) substrate (Si-Mat, Germany). Prior to the deposition the Si wafers have been
ultrasonically cleaned with acetone, iso-propanol and de-ionized water for 10 min. each
followed by piranha cleaning. This strongly oxidizing chemical cleaning removes most
organic matter and ion contamination from the substrate[29]. MPNC MLs were
prepared by radio frequency (rf) ion beam sputtering, using alternating two
independent gold (Mateck, Germany, purity 99.99%) and PTFE targets (Disk 2800 g/
mol; Science Fellow Industries, India, purity 98%). Ion bombardment is initiated by a
plasma glow discharge using a 3 cm broad-beam Kaufman-type hot-cathode at a low
argon pressure (2.5 sccm), which thus generates Ar ions. The base pressure in the
chamber was 3×10⁻⁷ mbar. The chamber was flushed with pure Ar (99.995%) a few times before deposition to minimize oxygen and water vapor contamination. The
accelerating voltage and current were 1000 V and 30 mA, respectively. The target was kept at 45˚ with respect to the argon beam direction. The substrate was kept parallel
to the target at a distance of 150 mm. The deposition pressure was 2.6×10⁻³ mbar. A
schematic diagram for sputtering setup involved is shown in SI fig. S1. Three
nanocomposites have been prepared by varying the Au volume fraction. The
deposition rate of each of the materials (Au and PTFE) was determined separately at
the same pressure and gas flow rate which was used for alternate sputtering.
Deposited PTFE is named thereafter plasma polymer fluorocarbon (PPFC), due to
their structural and chemical changes during sputtering. The effective thickness rates
monitored were JAu=0.92±0.03 Å/s and JPTFE =3.4±0.2 Å/s. The filling factor of gold in
three samples was 0.12, 0.27 and 0.38 which is below the gold percolation threshold
of 0.45 as reported for gold in amorphous fluoroplastics[15]. The volume fraction was
estimated by considering the film thickness ratio of Au and PTFE inside the ML
structure. The thickness estimation for the various volume fractions has been detailed
in the SI. The in-plane thickness of each gold layer was kept constant at 1.0±0.1 nm in
the entire three MLs, whereas the thickness of the polymer layer varied in the three
5
Au in PPFC. The total thickness of the multilayer stack in all three cases was 140±5nm.
The structures of the films were as follows: Si/SiO2/ [Au(1nm)/PPFC(19nm)]7;
[Au(1nm)/PPFC(9nm)]14 and [Au(1nm)/PPFC(5.6nm)]21. The indices in subscript
denote the total number of bi-layers in the three MLs. The samples named thereafter
are Au/PPFC_1, Au/PPFC_2 and Au/PPFC_3.
Characterization: A monochromatic X-ray beam with a wavelength of 0.154 nm was used for the simultaneous GISAXS and GIWAXS measurements at the SAXS
beamline (BL 5.2), Elettra synchrotron, Trieste[30]. The incident beam had a cross section of 1.2 mm (H) × 100 μm (V). The small angle scattering signal was recorded with a 2D image plate detector (MAR 300; pixel size of 150 × 150 μm2). The image
plate was kept in the forward direction at a distance of 1850±1 mm from the sample,
to measure the scattered intensity in forward direction. The intensity of the incident and
specular beam near qy=0 nm-1 was attenuated with a partly transparent aluminum filter
in the beam path. Measurements were performed at constant grazing incidence angle αi ~ 0.45˚. For in-plane GIWAXS measurements, a Pilatus 100K (Dectris Ltd.,
Switzerland; pixel size of 172 × 172 μm2) detector was kept at a distance of 327.7±0.5
mm in the film plane (tilted 55˚; sketch of detector position used for experiment is
shown in SI fig. S2.) This detector distance had been fixed to cover the required
angular range. The exposure time for each measurement was set to 300s for GISAXS
and GIWAXS. To address possible effects of X-ray irradiation on the structure, the ML
was initially exposed to the photon beam for a longer time: up to 20 min exposure, no
significant change in the scattering pattern has been observed. Beyond a time of 20
min, a small broadening of the diffraction peaks and a decrease in peak intensities
were observed. Accordingly, to avoid any effect of radiation damage during the
measurements, after every scan the sample was shifted across the beam by 2 mm
(sample size 20 × 20 mm2) to expose a fresh area of the film. The angular detector
ranges have been converted from pixel to the scattering vector q using as two standard
samples calibration reference; rat tail tendon collagen for GISAXS and Cu foil for
GIWAXS. The width of the calibrant Cu diffraction lines (Wins) has been used as
instrumental width for estimating the experimental crystalline size in the GIWAXS data
of MLs using the Scherer formula[31]. The MLs were isochronally annealed at 373 K,
473K and 573 K in-situ during the measurement to study the kinetic growth of particles
6
sample rotation stage) was used for controlled heating of the sample, which was kept
in a protective atmosphere of nitrogen gas. The sample temperature was maintained
with an accuracy of ±0.5K. The optical reflectance spectra of the MPNCs were
measured ex-situ with a UV-Vis spectrophotometer (Perkin Elmer, USA. Model:
Lambda 950). The scans (normal incidence; reflectance mode) have been recorded in
the wavelength range of 200nm to 800 nm. The main interest was to see the variation
in surface plasmons of Au.
Results & discussion:
Structural properties at room temperature: An overview of the setup used for simultaneous GISAXS and GIWAXS measurements at the SAXS beamline (BL 5.2)
Elettra, Trieste given in the supporting information (SI) fig. S3 (a).
GIWAXS: The 1D diffraction pattern (fig. S3 (b)) has been extracted from the 2D in-plane diffraction image of the sample in θ-2θ geometry. The GIWAXS pattern confirms the formation of well-established nanocrystalline particles due to the appearance of two diffraction peaks around 2θ = 38.60±0.008˚ and 43.30±0.003˚,
ascribed to the (111) and (200) planes of fcc crystalline Au. The peak positions are
shifted to some extent from the bulk position which reflects the strain and which
may be caused by the geometry and the polymer-filler interfacial interaction. Two
Gaussians peak (red line in SI fig. S3 (b)) have been fitted to the data and the
minimum crystalline size of a NP (
𝐷
𝑛𝑝) has been derived from the width obtainedfor the (111) peak in the diffraction pattern, after deducting the instrumental width
using the Scherer formula[31]:
𝐷
𝑛𝑝=
0.94𝜆𝐵 cos 𝜃 , 𝐵 = √𝑊𝐸
2− 𝑊
𝑖𝑛𝑠2 (1)
where λ is the wavelength of the X-rays and B is the full width at half maximum in
radians. WE and Wins (0.35 rad.) are the experimental and instrumental width,
respectively. Results obtained are given in table 1. The lattice constant a nearly
matches with the bulk value of Au (0.408 nm) which confirms crystalline gold
nanoparticles in the polymer matrix. Diffraction plots of all three samples at room
temperature are shown in the SI fig. S4 (d). As one can see from table 1, the
crystalline size in all three MLs is almost the same despite of the varying volume
fraction of gold in ML. This is as per expectation, since the deposited in-plane mass
7
the relative metal content is varied only by varying the thickness of the polymer
layers.
Table 1: Au and polymer layer thicknesses, minimum crystalline size [111] (D), lattice
constant (a), in-plane inter-particle distance (ξ𝐻) of all three multilayers at room temperature. Errors indicated only in the first line hold for all values.
Sample δ(Au)
(nm)
δ(PPFC)
(nm)
D (nm) a (nm) ξ𝐻 (nm)
Au/PPFC_1
Au/PPFC_2
Au/PPFC_3
1±0.1
1
1
19±0.8
9
5.6
2.43±0.004
2.46
2.45
0.403±0.001
0.404
0.406
4.30±0.05
4.34
4.32
GISAXS: In-plane cuts I(qy) were made at the Yoneda peak of Si (qz = 0.236 nm−1)
and the software package DPDAK[32] was used to extract quantitative information
from the data sequence. Last Image taken at particular temperature is illustrated in fig.
S5. Please note that a small tilt can be observed in the measured 2D pattern which we
associate to an initial tilt in the heater assembly at which specimen was mounted (see
SI fig. S3 for details of the setup). Tilt was accounted when making the cuts, see
indicated area in fig. S5, first left column. The GISAXS pattern shows a broad side
peak that emerges at large qy values (fig. S3 (c)). This peak is related to a maximum
interference of scattered waves describing the nanoparticle correlation distance, often
called inter particle distance ξ𝐻[16,25,33]. From the position of the side peak (horizontal) one can estimate the average inter-particle (ξ𝐻) using the formula[16],
ξ
𝐻≈
2𝜋𝑞𝑦
(2)
where, qy is the position of the side peak in y direction. In the Yoneda cut I(qy) at
constant qz= 0.236 nm-1 the presence of a peak (fig. S3(c)) evidences that the island
distribution is not completely random, but are separated by a preferential nearest neighbor distance ξ (center-to-center), indicating short range ordering of Au NPs in
PPFC. The side maxima observed for pristine MLs are dominated by the structure
factor signals and indicate a substantial lateral ordering of the nanoparticles. The peak
in the qy range of 1.45−1.46 nm−1 corresponds to the inter particle distance ξ𝐻≈ 4.3 ±
0.05 nm in real space, obtained by simulation (see SI for details). Yoneda cuts of three
8
were obtained for all three samples (see table 1), which corroborates a constant
in-plane thickness of gold resulting in a uniform interlayer morphology. Similar to eq. 2,
the vertical interlayer-particle distance ξ𝑉 was derived using,
ξ𝑉 ≈ 2𝜋
𝑞𝑧 (3)
Where, qz denotes the position of the first order Bragg peak in the off-detector cut.
The off-detector cut demonstrates the vertical ordering in MPNC, executed (along qz)
for 1.85nm−1 < qy < 1.89 nm−1 (fig. S3 (d)). In the vertical direction an estimable
inter-particle correlation is observed due to the periodic structure of the MPNC ML. As the
first Au layer is deposited on the Si wafer, Au NPs are formed which exhibit in-plane
local ordering of a granular nanoclusters assembly[16,34]. The next deposited PPFC
amorphous layer perfectly covers the Au NPs layer. The successive alternate
deposition of Au and PPFC layers leads to the appearance of small undulations/
waviness with a period order given by the vertically interlayer-particle distance (ξ𝑉), see also fig. S4 (a). Layer-by-layer self-organized growth of NPs is the origin of this
vertical order. The vertical order leads to well defined Bragg peaks in the scattering
intensity from the MLs. The Bragg peaks in vertical direction show the strong structural coherence between the individual layers of the multilayers[35–37]. The off detector
cuts of three MLs are given in S4 (f). The Bragg peak is shifted towards higher q values
from sample Au/PPFC_1 to Au/PPFC_3. In these three films the polymer layer
thickness has been intentionally reduced from Au/PPFC_1 to Au/PPFC_3 in order to
obtain different volume fractions of gold in the total ML stack (fig. S4(a-c)). Thus the
shift in the Bragg peak position signals the fact that the as the PPFC layer thickness
decreases and hence the separation of the Bragg peaks increases (fig S4 (f)). The
presence of a successive number of Bragg peaks in the GISAXS pattern of the MLs
indicates that the NPs in the layers are well separated and the spacing between the
Au NP layer is rather well established in Au/PPFC_1 as compared to Au/PPFC_2 and
Au/PPFC_3. In addition, the peaks broaden from sample Au/PPFC_1 to Au/PPFC_3
(fig. S4 (f)). This can be understood such that the interfaces are not sharp, but rather
show a diffuse compositional profile which is evidence of a strong intermixing of metal
due to metal embedment in polymer at the interfaces in the pristine sample itself. This
can be understood in terms of interface modulation[38] and stress in the three MLs
according to the volume fraction of Au in PPFC. On the other hand Amarandei et al.
9
considered[33,39]. For MLs Au/PPFC_2 and Au_PPFC3 the ratio of NP radius to
polymer thickness is low enough that embedding interlayer interaction is
thermodynamically favored[40]. The undulated structure of the PPFC films increases
with decreasing PPFC layer thickness because of the thinner PPFC layer covers the
waviness of the Au layers less efficient (see schematic structures shown in fig. S4
(a-c)). Consequently, the embedding of the Au inclusions in the intervening PPFC matrix
increments, and the vertical coherence length decreases[37]. We further note that the
intensity of the first Bragg peak (indicated by arrow in fig. S4 (f)) depends on the
effective interdiffusivity/ embeding in the MLs.
Table 2: Interlayer-particle distance (𝜉𝑉) calculated from the first order Bragg peak of the multilayers at various temperatures. The errors have given in one row hold for all
three MLs with varying temperature. N.q.: not quantifiable.
Multilayer 𝜉𝑉 (nm) 273K
𝜉𝑉 (nm) 373K
𝜉𝑉 (nm) 473K
𝜉𝑉 (nm) 573K
Au/PPFC_1
Au/PPFC_2
Au/PPFC_3
10.45±0.03
6.86
3.82
9.79±0.04
6.61
7.02
9.18±0.07
4.65
n.q.
5.13±0.1
n.q.
n.q.
The interlayer-particle distance (ξ𝑉) is decreasing from ML Au/PPFC_1 to Au/PPFC_3, due to the decrease in the period in successive MLs (from 10.5 to 3.8 nm). This is in
conformity with the constant in-plane gold thickness and varying polymer thickness in
the three successive MLs. From the off detector cuts of pristine MLs (as given in fig.
S4 (f)), the structure and morphology of the NPs in a vertical stack can be estimated.
For extracting the lateral distance ξ𝐻, we performed a simulation of the GISAXS signal in the Yoneda cut using the software IsGISAXS [41]. Details are described in the SI
(Fig. S6).
Structural Changes during and after Annealing:
GIWAXS: Annealing of the nanocomposite thin films well above the glass transition temperature (Tg) reduces the interaction bond strength between metal NPs and
polymer molecules. The ML structure undergoes reorganization because of the change
in the physical structure of the polymer at higher temperatures. The mobility of the NPs
10
entanglement density of the polymer chains. As a result, NPs start to diffuse through
the polymer network. More and more NPs come in contact with each other, and
eventually coagulation of these particles occurs[18,42]. This would increase the
average crystalline/ nanoparticle size, inter-particle distance and may modify NPs
morphology. As mentioned earlier, to study the effect of temperature on the
nanocomposite properties isochronal thermal annealing of the MLs has been done at
various temperatures. A number of scattering patterns has been recorded in period of
20 to 30 min. with exposure time of 298s each at intervals of 5 min. for statistical study.
Thus, at each temperature a number of scattering pattern were recorded as a function
of time. To estimate the kinetic behavior of the nanoparticles in the polymer matrix, the
diffusion of NPs was estimated using the equation of diffusion[43,44],
𝐷𝑛𝑝2 = 2𝐷𝑓𝑡 (4)
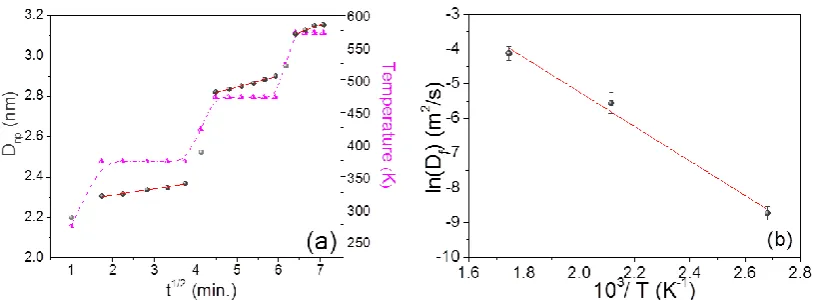
where 𝐷𝑛𝑝 denotes the minimum crystalline size (Eq. 1), 𝐷𝑓is the diffusion constant and t is the annealing time. Figure 1(a) shows the variation of minimum crystalline size
in Au/PPFC_3 as a function of √𝑡 at different annealing temperatures. One can see that the crystalline size increases linearly as a function of √𝑡 at all investigated temperatures, suggesting a diffusion-controlled growth of nanoparticles in the polymer
matrix at the varying temperatures. The slope of the straight line is proportional to the diffusivity on NP’s in polymer matrix. The variation in crystalline size was found to be systematic in all the samples (see SI figure S7 (a) & (b)). The obtained values of ‘𝐷𝑓’
are used to find the activation energy (𝐸𝑎) from the equation[37,45]
𝐷𝑓 = 𝐷0exp( −𝐸𝑎
𝑅𝑇) (4)
with 𝑅 gas constant, 𝐷0 pre-exponential factor and 𝑇 the annealing temperature. From
11
Figure 1: (a) Crystalline size (from GIWAXS) variation in Au/PPFC_3 as a function of
annealing time (√𝑡) at varying temperature; the dotted (pink) curve represents the temperature profile of the sample with time and temperature (b) Arrhenius-plot showing
the relationship between ln(Df) (where, Df is the diffusion constant) and 103/T for the
Au/PPFC_3 ML obtained from in-situ temperature dependent in-plane GIWAXS.
The glass transition temperature of bulk PTFE is around 394 K. It is interesting to see
from figure 1(b) that even at 373 K, which is below the glass transition temperature the
diffusion of nanoparticles in polymer matrix is governed by the same activation energy
as evidenced by the Arrhenius plot. A change in viscosity across the glass transition
temperature is expected to result in a significant change in the diffusion mechanism of
nanoparticles. The NP diffusion at all the three temperatures studied in the present
work is governed by the same activation energy and suggests that no glass transition
takes place in the temperature range investigated. The glass transition temperature is
known to get reduced in the thin film form or with the inclusion of nanofillers[46,47].
Thus, it is quite likely that in the present system the glass transition temperature has
gone below 373K (well above RT (273K) but less than 394K). The activation energy
has been found decreasing from Au/PPFC_1 (1.03±0.02) eV to Au/PPFC_3
(0.340±0.02) eV [Au/PPFC_2 (0.429±0.02)]. This is due to the fact that the polymer
intermediate barrier layer between two Au layers was successively decreased in the
three MLs. Thus, the polymer layer mass density is in decreasing order, ensuring a
decrease in activation energy.
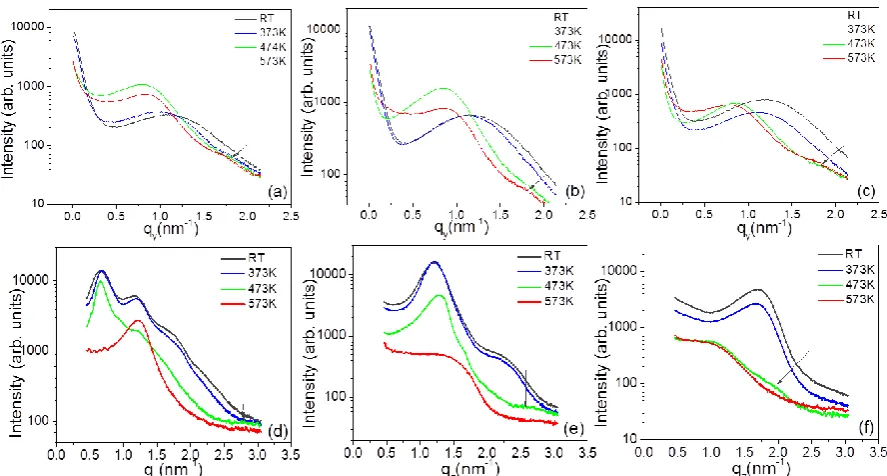
GISAXS: The film morphology at various temperatures was accessed with GISAXS. 2D GISAXS pattern recorded at various temperatures are shown in figure S5. The
12
gives Yoneda cuts made for the three MLs at different temperatures The lateral
correlation peak in Au/PPFC_1 and Au/PPFC_2 is continuously shifting towards lower
qy up to 473 K and then slightly shifts to higher qy at 573K signalizing first an increase
in the inter particle distance of the NPs and then a slight decrease at 573K. In
Au/PPFC_3 the inter-particle distance is continuously increasing with temperature up
to 573K. In the ML structure, the diffusion of NPs at lower temperature is mostly
confined within the Au layers, i.e. parallel to the substrate. But the NPs are gaining
higher mobility both in horizontal and vertical direction with increasing temperature. At
573 K the polymer is close to its molten state and the NPs are thus gaining more
freedom in both directions. The maximum in scattering intensity related to the NPs
layer is fastly moving towards lower qyat 573 K indicating a change in the particle
distance 𝜉𝐻 in the layer. Thus the inter-particle distance at higher temperature is due to the NPs mobility in both directions. However, Au/PPFC_3 has the lowest polymer
layer thickness; due to this insufficient intermediate polymer thickness, it is not
separating completely the Au NPs layers. Hence, the NPs are getting highest mobility
already at lower temperature and the inter-particle distance is continuously increasing
as a collective response of the mobility of NPs in both vertical and horizontal directions
in the ML. It is worth mentioning that at higher temperature a higher order peak at
larger qy values (marked in fig. 2) occurs. This indicates a more ordered state of the
structure due to the thermal annealing.
The in-plane average NPs radius R has been derived from the effective layer thickness (δ) of gold and inter-particle distance based on geometrical model by Schwartzkopf et
al.[16] by applying it to spherical shaped NPs. The geometrical model assumes that
the effective deposited material is locally separated into a hexagonal array of spherical
shaped clusters in a distance ξ𝐻. According to this model assumption, the average radius of the supported clusters can be calculated by:
𝑅 = √31.5 8𝜋 ξ𝐻
2 𝛿 3
(6)
13
Figure 2: Cuts obtained from MLs various temperatures. Yoneda cuts are shown in (a,
b, c) and off-detector cuts in (d, e, f) for MLs the MLs Au/PPFC_1, Au/PPFC_2 and
Au/PPFC_3, respectively. In each plot, the arrow at higher q values denotes the
presence of a higher order peak.
Particle radius has slightly decreased in MLs Au/PFC_1 and Au_PPFC_2 from
temperature 473K to 573K. This might be to slight form change. Particle growth at
various temperatures and their corresponding activation energy (0.109 ± 0.01eV) for
interdiffusion of adjacent NPs through the polymer matrix is shown in fig. 3(a) & (b).
One can observe a decrease in. activation energy from Au/PPFC_1 (0.572 ± 0.01eV)
to Au/PPFC_2 (0.129 ± 0.01eV) given in fig S8. The activation energy is found to be
lower in analysis of the particle growth study by GISAXS than by using the minimum
crystalline size estimation via GIWAXS. The linear incremental trend in activation
energy plot is same in both calculated from crystalline size (GIWAXS) and particle size
(GISAXS). The results are consistent, as minimum crystalline size is less than the
14
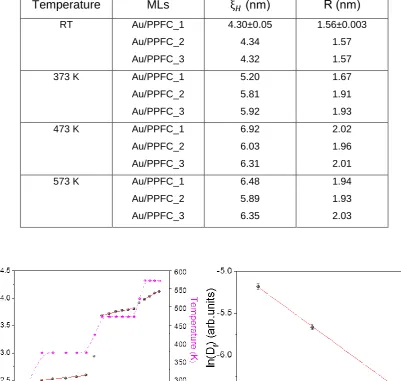
Table 3: NPs radius (R) and inter-particle distance (ξ𝐻) variation in three MLs with temperature. The values for the errors are given in line1 hold for all values in the
columns.
Figure 3: (a) Particle size variation in Au/PPFC_3 as a function of annealing time (√𝑡)
at varying temperature; the dotted (pink) curve represents the temperature profile of
the sample with time and temperature (b) Arrhenius-plot showing the relationship
between ln(Df) and 103/T for the Au/PPFC_3 ML obtained from in-situ temperature
dependent in-plane GISAXS; red line showing linear fit.
Off-detector cuts were also made from the data to analyze the changes occurring
during annealing more carefully, they are shown in fig. 2(d,e & f). One can notice that
at 373 K there is not a yet significant change in the Bragg peak position in all three
Temperature MLs ξ𝐻 (nm) R (nm)
RT Au/PPFC_1
Au/PPFC_2
Au/PPFC_3
4.30±0.05
4.34
4.32
1.56±0.003
1.57
1.57
373 K Au/PPFC_1
Au/PPFC_2
Au/PPFC_3
5.20
5.81
5.92
1.67
1.91
1.93
473 K Au/PPFC_1
Au/PPFC_2
Au/PPFC_3
6.92
6.03
6.31
2.02
1.96
2.01
573 K Au/PPFC_1
Au/PPFC_2
Au/PPFC_3
6.48
5.89
6.35
1.94
1.93
15
MLs showing that the ordering is preserved below the glass transition temperature (Tg)
(one should expect change in morphology crossing glass transition temperature),
although there is small decrease in intensity that is due to the gradual mixing at the
interfaces. However a further increase in temperature to 473 K results in a significant
change in the structure. At 473 K the first Bragg peak in Au/PPFC_1 ML is slightly
shifted towards lower qz while for other two MLs the Bragg peak is shifting towards
higher qz and the higher order Bragg peaks become suppressed. This might be
because of a rearrangement of the NPs in PPFC leading to a more compact structure
of the ML with higher intermixing at the metal-polymer interface. A further increase in
temperature results in a rapid decrease in interlayer particle distance (ξ𝑉). Although ξ𝑉
is decreased remarkably at 573K the presence of a broad Bragg peak or hump shows
that the layered structure is still sustained. The Bragg peak is increasingly broadening
from ML Au/PPFC_1 to Au/PPFC_3 as a result of higher intermixing at elevated
temperature. This transformation shows that the MLs are converted into a diffused
metal-polymer structure at 573K. The interlayer particle distance of the MLs at various
temperatures is listed in table 2.
Optical properties at room temperature: Ordered nanoparticles are promising structures that enable interconversion of the propagation of electromagnetic waves
and thus thereby promote strongly enhanced local fields used for a number of practical
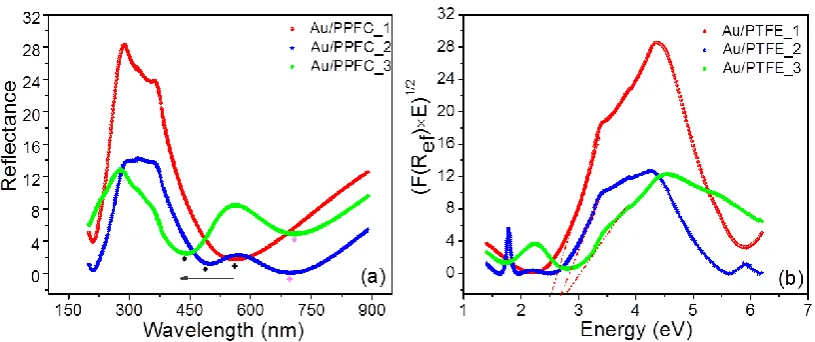
applications like photonics, optical sensors etc[42,48,49]. UV-Vis spectra of the three
pristine multilayers are shown in fig. 4. The spectra have been taken in off-specular
reflection mode; dips in the spectra are due to absorption. One can notice characteristic
features associated with NP assembly and their arrangement in the ML structure. In
the wavelength range of 250 nm to 400 nm some interference effect is seen[50]
because of the multilayer structure. In the higher wavelength region a surface plasmon
is emerging in the spectrum, indicated by the diamond symbols in fig. 4. UV-Vis spectra
of nanocomposites are showing strong absorption in the range of 440 nm to around
520 nm. In present case we will refer this as local surface plasmon (LSPR) as in ML
structure NPs layer are buried in polymer matrix. One can notice the presence of a
single plasmon in ML Au/PPFC_1 while for Au/PPFC_2 and Au/PPFC_3 the plasmon
16
Figure 4: (a) UV-Vis spectra of Au/PPFC MPNCs room temperature; the local
surface plasmon resonance (LSPR) in the three MLs are indicated by a diamond
symbol (♦) and the arrow indicates the shift in LSPR (b) Plot of [ 𝐹 (𝑅𝑒𝑓)× (h𝜈)] vs.
Energy for indirect band gap calculation by applying linear approximations (fits are
indicated by the red dash-dotted lines).
A single broad Gaussian plasmon dip in the reflection spectra can be indication for a
spherical shape of the NPs[51,52]. The analysis has been done considering the
spherical shape of the nanoparticles, which was also confirmed by the GISAXS data.
The optical study shows that the electric field distribution across the surface of the
spherical particle seems to be uniform, and thus all the free conduction electrons
oscillate in-phase, resulting in one plasmon, regardless of the type of incident
polarization[53,54]. The isotropic optical response of the spherical particles can be
altered either by increasing their aspect ratio (changing the particles morphology) or coupling, i.e. placing them in close proximity of other particles[49,55–57]. In
Au/PPFC_1 the periodic polymer thickness is 19 nm which ensures that the voids
between NPs become completely filled with PPFC. The structurally continuous
polymer barrier layer completely separates the metallic layer vertically, which in turn
hinders the effective movement of nanoparticles in vertical direction (fig. S4 (a)). Thus
an ultra-fine constant thickness of 1 nm of gold ensures local monodispersion of
in-plane particles with small size variation which supports the appearance of a single
plasmon in Au/PPFC_1. Local monodisperse distribution of NPs has also been
confirmed by GISAXS. In the other 2 MLs. because of the lower thicknesses of polymer
(9 nm and 5.6 nm, respectively), the polymer film is not continuous, but PPFC grows
17
thickness is not capable to isolate metal NPs completely in a vertical stack. As a
consequence, the NPs distance becomes small enough to give rise to plasmon
coupling between the interacting particles, which changes the distribution of the
induced surface dipoles and hence the electric field (fig. S4 (b & c)). This yields a
disturbance in the electronic oscillations which can result in a change in the optical response and thus lead to the excitation of more than one plasmon mode (PM)[55–
57]. The broadening of plasmon indicates a broad distribution of particle sizes in the
MLs. The reflection amplitude increases with the metal filling factor, which shows that
the NP density is directly proportional to the absorption intensity[58]. Sequels to this
plasmon are shifted to lower wavelength (blue shift) from sample Au/PPFC_1 to
Au/PPFC_3. There are a number of reasons that can lead to the observed blue
plasmon shift. The optical properties of nanocomposites are highly sensitive to the
morphology and the surrounding dielectric medium. The decrease in particle size or
increase in inter-particle distance can result in a blue shift of the plasmon[3,59,60]. In
the present case, the Au NP size and inter-particle distance in the three pristine
samples have been found to be almost the same (confirmed by GISAXS & GIWAXS),
so we may exclude this reason for the blue shift of the plasmon in our system. Amongst
the possible causes for this effect, the only possible reason for the observed blue shift
in the present case should be related to a possible variation in the refractive index of
the polymer in the vicinity of the metal particles[7,48]. As in the present study we have
varied the polymer thickness in the multilayers, this may induce that the mass density
of the polymer has been varied. Due to this, the polymer-filler bonding would vary; this
structural change can alter the refractive index of the polymer[61,62]. From the
perspective of this information we think that this could be the possible reason of the
plasmon blue shift in the present case. LSPR of gold nanoparticles can be used to
assess the information on the binding energy. To quantify this, the indirect band gape energy of the three MLs has been calculated using the Kubelka–Munck radiative transfer model[63–65].
𝐹(ℎ𝜈) = (𝐹 (𝑅𝑒𝑓) × 𝐸)1⁄2, 𝐹(𝑅𝑒𝑓) = (1−𝑅𝑒𝑓)2
2𝑅𝑒𝑓 (7)
with 𝑅𝑒𝑓 is the reflectance. The model allows the calculation of the reflectance from a layer that both scatters and absorbs light. The linear fit through the LSPR yield the
indirect band gap energy of the system. Figure 4(b) depicts the plot of (𝐹 (𝑅𝑒𝑓) × 𝐸)1⁄2
18
Resulting extrapolated values are given in table 4. One can see that, as one goes from
sample Au/PPFC_1 to Au/PPFC_3, the indirect band gap exhibits a systematic
increase. According to the Penn model[66] for the dielectric constant of semiconductor
materials[67,68] and other materials[69] varies inversely with the band gap energy.
Thus as one goes from Au/PPFC_1 to Au/PPFC_3 the dielectric constant is expected
to decrease which should results in blue shift of SPR, as observed in the present case
and corroborates our hypothesis. These findings elucidate the nature of plasmon
modes in this ML system, which involves strong light-matter coupling, and set the level
for the controlled bond formation by light excitation.
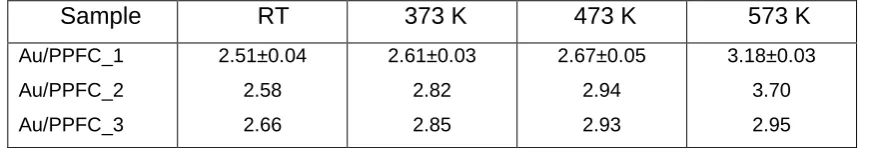
Table 4: Evaluated indirect band gap energy (in eV) for three multilayers at different
temperature. The uncertainty is mentioned in line 1 only holds for all values in the
column.
Sample RT 373 K 473 K 573 K
Au/PPFC_1
Au/PPFC_2
Au/PPFC_3
2.51±0.04
2.58
2.66
2.61±0.03
2.82
2.85
2.67±0.05
2.94
2.93
3.18±0.03
3.70
2.95
Temperature dependent optical response: The sensitivity of the nanocomposite film to the host medium was tested by monitoring the change in the Au-LSPR position as
a function of temperature. The multilayers were ex-situ annealed at 373K, 473K and
573K with same annealing protocol used for GISAXS and GIWAXS measurements
and their UV-Vis spectra have been recorded. From figure S9, one can see that in all
the three cases the LSPR peak exhibits a blue shift with increasing annealing
temperature. Further, the magnitude of the shift decreases as one goes from sample
Au/PPFC_1 to Au/PPFC_3 (fig. S10). Even a slight change from non-spherical to
spherical shape can lead to a blue shift of the plasmon[70,71]. The band width of the
LSPR band of the annealed sample indicates only a small variation in the size
distribution. In general, by annealing the samples well above Tg of the polymer, the
response to the dielectric environment significantly enhanced. The increased
sensitivity of the annealed sample is attributed to the increased mobility of both polymer
chains and gold nanoparticles in the close molten state of the polymer. As discussed
earlier, the polymer layer thickness between two gold layers has been intentionally
19
polymer layer thickness the embedding of the gold nanoparticles has changed from
sparse to a denser form. The NPs size getting higher with thermal annealing and more
massive particles move slowly and this is why the magnitude of the shift is decreased
from Au/PPFC_1 to Au/PPFC_3 (fig. S10). The results obtained are summarized in
table 4. The results show that, by using adequate post deposition annealing, a tailoring
of the optical properties of such Au/PPFC MPNC MLs is possible and could be
preferential for plasmonic-driven applications. From table 4 one can see an increase
in the band gap energy with increasing temperature. This shows a higher mismatch of
the crystal momentum in valence and conduction band[72]. Qualitatively, according to
the Penn model, this is particularly showing the decrement of the dielectric constant
(refractive index). An increase of the dielectric constant would lead to a shift of the
absorption maximum towards longer wavelengths[73,74]. However, the present results
are in conformity with a decreasing dielectric constant, as the dielectric constant is
supposed to decrease from Au/PPFC_1 to Au/PPFC_3, which leads to a blue shift of
Plasmon.
Conclusion:
As promising Nano engineered ML structure, considered as a simple and practical system, enables us to control optical response that can be highly tuned.A well-defined interlayer inter-particle correlation is observed in all the three pristine
MLs with an average in-plane inter-particle distance of about 4.30±0.05 nm in
conformity with simulations. Furthermore, a strong inter-particle correlation is observed
in vertical direction as well, in corroboration of the bilayer period variation in the three
MLs. With thermal annealing the reordering of nanoparticles occurs and morphological
changes were observed. The dependence of the nanoparticles size on the square root
of the annealing time suggests a diffusion controlled growth of nanoparticles. These
findings indicate that the mobility of metal nanoparticles can be affected by the volume
fraction of metal in a polymer, and annealing significantly influences the NPs growth
and ordering in a layered structure. An enhanced diffusion and intermixing is the main
reason for the structure changes. It is worth noting that after annealing at 573K the
inter particle correlation became more isotropic in both in-plane/ horizontal and vertical
directions. At the same time NP size increases with increasing temperature and they
become more spherical due to a reduction in the surface energy. The fraction of
embedded NPs can be controlled by the annealing time and temperature. Thus, overall
20
to higher temperature by varying the intermediate polymer layer thickness, which can
be useful in device applications. UV-Vis analysis shows that the LSPR frequency
exhibits a systematic variation with the volume fraction as well as with thermal
annealing. The variation in the dielectric constant of the material is found to be the
main factor affecting the LSPR frequency. The structural properties of the MLs are
found in good agreement with their optical response. This work opens the way to tune
the optical properties via controlling the growth of metal NPs. By virtue of our current
approach one can systematically control the structural and optical properties of
nanocomposite systems.
References:
1. Faupel, F.; Zaporojtchenko, V.; Strunskus, T.; Elbahri, M. Faupel. Advanced
Engineering Materials 2010, 12, 1177–1190.
2. Sanchez, C.; Belleville, P.; Popall, M.; Nicole, L. Applications of advanced hybrid organic–inorganic nanomaterials: from laboratory to market. Chemical
Society Reviews 2011, 40, 696–753.
3. Srivastava, S.; Haridas, M.; Basu, J.K. Optical properties of polymer
nanocomposites. Bulletin of Materials Science 2008, 31, 213–217.
4. Lopes, W.A.; Jaeger, H.M. Hierarchical self-assembly of metal nanostrucures
on diblock copolymer scaffolds. Nature 2001, 414, 735–738.
5. Turković, A.; Dubček, P.; Juraić, K.; Drašner, A.; Bernstorff, S. SAXS Studies of
tio2 Nanoparticles in Polymer Electrolytes and in Nanostructured Films.
Materials 2010, 3, 4979–4993.
6. Schwartzkopf, M.; Santoro, G.; Brett, C.J.; Rothkirch, A.; Polonskyi, O.; Hinz,
A.; Metwalli, E.; Yao, Y.; Strunskus, T.; Faupel, F.; et al. Real-Time Monitoring
of Morphology and Optical Properties during Sputter Deposition for Tailoring
Metal-Polymer Interfaces. ACS Applied Materials and Interfaces 2015, 7, 13547–13556.
7. Alsawafta, M.; Badilescu, S.; Paneri, A.; Truong, V. Van; Packirisamy, M.
Gold-poly(methyl methacrylate) nanocomposite films for plasmonic biosensing
applications. Polymers 2011, 3, 1833–1848.
8. Roth, S. V.; Santoro, G.; Risch, J.F.H.; Yu, S.; Schwartzkopf, M.; Boese, T.; Döhrmann, R.; Zhang, P.; Besner, B.; Bremer, P.; et al. Patterned Diblock
Co-Polymer Thin Films as Templates for Advanced Anisotropic Metal
21
9. Hua, Y.; Chandra, K.; Dam, D.H.M.; Wiederrecht, G.P.; Odom, T.W.
Shape-Dependent Nonlinear Optical Properties of Anisotropic Gold Nanoparticles. The
Journal of Physical Chemistry Letters 2015, 6, 4904–4908.
10. Torrisi, V.; Ruffino, F. Metal-Polymer Nanocomposites:
(Co-Evaporation/(Co)Sputtering Approaches and Electrical Properties. Coatings
2015, 5, 378–424.
11. Ciprari, D.; Jacob, K.; Tannenbaum, R. Characterization of Polymer
Nanocomposite Interphase and Its Impact on Mechanical Properties.
Macromolecules 2006, 39, 6565–6573.
12. Li, S.; Meng Lin, M.; Toprak, M.S.; Kim, D.K.; Muhammed, M. Nanocomposites
of polymer and inorganic nanoparticles for optical and magnetic applications.
Nano Reviews 2010, 1, 5214.
13. Shen, Y.; Lin, Y.; Nan, C.W. Interfacial effect on dielectric properties of polymer
nanocomposites filled with core/shell-structured particles. Advanced Functional
Materials 2007, 17, 2405–2410.
14. Guozhong C Nanostructures & Nanomaterials: Synthesis, Properties &
Applications; 2nd, Ed.; Imperial College Press: London, UK, 2004; ISBN
1-86094-4159.
15. Takele, H.; Schürmann, U.; Greve, H.; Paretkar, D.; Zaporojtchenko, V.;
Faupel, F. Controlled growth of Au nanoparticles in co-evaporated
metal/polymer composite films and their optical and electrical properties. The
European Physical Journal Applied Physics 2006, 33, 83–89.
16. Schwartzkopf, M.; Buffet, A.; Körstgens, V.; Metwalli, E.; Schlage, K.; Benecke,
G.; Perlich, J.; Rawolle, M.; Rothkirch, A.; Heidmann, B.; et al. From atoms to
layers: in situ gold cluster growth kinetics during sputter deposition. Nanoscale
2013, 5, 5053.
17. Kelly, K.L.; Coronado, E.; Zhao, L.L.; Schatz, G.C. The Optical Properties of
Metal Nanoparticles: The Influence of Size, Shape, and Dielectric Environment.
The Journal of Physical Chemistry B 2003, 107, 668–677.
18. Heilmann A Polymer Films with Embedded Metal Nanoparticles; Springer:
Berlin, Germany, 2003; ISBN 978-3540431510.
19. Zaporojtchenko, V.; Podschun, R.; Schürmann, U.; Kulkarni, A.; Faupel, F.
Physico-chemical and antimicrobial properties of co-sputtered Ag-Au/PTFE
22
20. Kim, S.H.; Kim, M.; Lee, J.H.; Lee, S.-J. Self-Cleaning Transparent Heat Mirror
with a Plasma Polymer Fluorocarbon Thin Film Fabricated by a Continuous
Roll-to-Roll Sputtering Process. ACS Applied Materials & Interfaces 2018, 10, 10454–10460.
21. Lahav, M.; Vaskevich, A.; Rubinstein, I. Biological sensing using transmission
surface plasmon resonance spectroscopy. Langmuir 2004, 20, 7365–7367.
22. Zekonyte, J.; Zaporojtchenko, V.; Faupel, F. Investigation of the drastic change
in the sputter rate of polymers at low ion fluence. Nuclear Instruments and
Methods in Physics Research B 2005, 236, 241–248.
23. Schwartzkopf, M.; Roth, S. Investigating Polymer–Metal Interfaces by Grazing
Incidence Small-Angle X-Ray Scattering from Gradients to Real-Time Studies.
Nanomaterials 2016, 6, 239.
24. Kaune, G.; Ruderer, M.A.; Metwalli, E.; Wang, W.; Couet, S.; Schlage, K.; Röhlsberger, R.; Roth, S. V.; Müller-Buschbaum, P. In Situ GISAXS Study of
Gold Film Growth on Conducting Polymer Films. ACS Applied Materials &
Interfaces 2009, 1, 353–360.
25. Müller-Buschbaum, P. Applications of Synchrotron Light to Scattering and
Diffraction in Materials and Life Sciences: A Basic Introduction to Grazing
Incidence Small-Angle X-Ray Scattering. Lect. Notes in Phys. 2009, 776, 61–
89.
26. Hexemer, A.; Müller-Buschbaum, P. Advanced grazing-incidence techniques
for modern soft-matter materials analysis. IUCrJ 2015, 2, 106–125.
27. Choi, J.; Choi, M.-J.; Yoo, J.-K.; Park, W.I.; Lee, J.H.; Lee, J.Y.; Jung, Y.S.
Localized surface plasmon-enhanced nanosensor platform using
dual-responsive polymer nanocomposites. Nanoscale 2013, 5, 7403.
28. Novotny, L.; Hecht, B. Surface plasmon -. In Principles of Nano-Optics; Cambridge University Press., 2012; pp. 407–450 ISBN 9780511813535.
29. Pandit, P.; Banerjee, M.; Pandey, K.K.; Sharma, S.M.; Gupta, A. Role of
substrate in melting behavior of Langmuir-Blodgett films. Colloids and Surfaces
A: Physicochemical and Engineering Aspects 2015, 471, 159–163.
30. Amenitsch, H.; Bernstorff, S.; Kriechbaum, M.; Lombardo, D.; Mio, H.; Rappolt,
M.; Laggner, P. Performance and First Results of the ELETTRA High-Flux
Beamline for Small-Angle X-ray Scattering. Journal of Applied Crystallography
23
31. Bushroa, A.R.; Rahbari, R.G.; Masjuki, H.H.; Muhamad, M.R. Approximation of
crystallite size and microstrain via XRD line broadening analysis in TiSiN thin
films. Vacuum 2012, 86, 1107–1112.
32. Benecke, G.; Wagermaier, W.; Li, C.; Schwartzkopf, M.; Flucke, G.; Hoerth, R.;
Zizak, I.; Burghammer, M.; Metwalli, E.; Müller-Buschbaum, P.; et al. A
customizable software for fast reduction and analysis of large X-ray scattering
data sets: Applications of the new DPDAK package to small-angle X-ray
scattering and grazing-incidence small-angle X-ray scattering. Journal of
Applied Crystallography 2014, 47, 1797–1803.
33. Levine, J.R.; Cohen, J.B.; Chung, Y.W. Thin film island growth kinetics: a
grazing incidence small angle X-ray scattering study of gold on glass. Surface
Science 1991, 248, 215–224.
34. Babonneau, D.; Petroff, F.; Maurice, J.L.; Fettar, F.; Vaurès, A.; Naudon, A.
Evidence for a self-organized growth in granular Co/Al2O3multilayers. Applied
Physics Letters 2000, 76, 2892–2894.
35. Fullerton, E.E.; Schuller, I.K.; Vanderstraeten, H.; Bruynseraede, Y. Structural
refinement of superlattices from x-ray diffraction. Physical Review B 1992, 45, 9292–9310.
36. Fullerton Eric E.; Kumar S; Grimsditch M.; Kelly David M; Schuller Ivan K
X-ray-diffraction characterization and sound-velocity measurements of W/Ni
multilayers. Physsical Review B 1993, 48, 2560–2567.
37. Reddy Raghavendra, V.; Gupta, A.; Gome, A.; Leitenberger, W.; Pietsch, U. In
situ x-ray reflectivity and grazing incidence x-ray diffraction study of L 10
ordering in 57Fe/Pt multilayers. Journal of Physics Condensed Matter 2009,
21.
38. Shia D; Hui C. Y.; Burnside S. D.; Giannelis E. P. An Interface Model for the Prediction of Young ’ s Modulus of Layered S i I icate-Elast om er Na nocom
posi tes. Polymer Composites 1998, 19, 608–617.
39. Amarandei, G.; O’Dwyer, C.; Arshak, A.; Corcoran, D. The stability of thin
polymer films as controlled by changes in uniformly sputtered gold. Soft Matter
2013, 9, 2695.
40. Amarandei, G.; Clancy, I.; O’Dwyer, C.; Arshak, A.; Corcoran, D. Stability of
Ultrathin Nanocomposite Polymer Films Controlled by the Embedding of Gold
24
41. Lazzari, R. IsGISAXS: A program for grazing-incidence small-angle X-ray
scattering analysis of supported islands. Journal of Applied Crystallography
2002, 35, 406–421.
42. Etrich, C.; Fahr, S.; Hedayati, M.; Faupel, F.; Elbahri, M.; Rockstuhl, C.
Effective Optical Properties of Plasmonic Nanocomposites. Materials 2014, 7, 727–741.
43. Pradell, T.; Crespo D; Clavaguera N; Clavaguer-Mora M T. Diffusion controlled grain growth in primary crystallization : Avrami exponents revisited Diffusion controlled grain growth in primary crystallization : Avrami exponents revisited.
Journal of Physics: Condensed Matter 1998, 10, 3833–3844.
44. Gupt, P.; Gupta, A.; Shukl, A.; Ganguli, T.; Sinha, A.K.; Principi, G.;
Maddalena, A. Structural evolution and the kinetics of Cu clustering in the
amorphous phase of Fe-Cu-Nb-Si-B alloy. Journal of Applied Physics 2011,
110.
45. Gupta, A.; Gupta, M.; Chakravarty, S.; Wille, H.; Leupold, O. Fe diffusion in
amorphous and nanocrystalline alloys studied using nuclear resonance
reflectivity. Physical Review B 2005, 72, 1–8.
46. Bansal, A.; Yang, H.; Li, C.; Cho, K.; Benicewicz, B.C.; Kumar, S.K.; Schadler,
L.S. Quantitative equivalence between polymer nanocomposites and thin
polymer films. Nature Materials 2005, 4, 693–698.
47. Forrest, J.A.; Mattsson, J. Reductions of the glass transition temperature in thin
polymer films: Probing the length scale of cooperative dynamics. Physical
Review E 2000, 61, 53–56.
48. Garcia, M.A. Surface plasmons in metallic nanoparticles: fundamentals and
applications. Journal of Physics D: Applied Physics 2011, 44, 283001.
49. Reinhard, B.M.; Siu, M.; Agarwal, H.; Alivisatos, A.P.; Liphardt, J. Calibration of
Dynamic Molecular Rulers Based on Plasmon Coupling between Gold
Nanoparticles. Nano Letters 2005, 5, 2246–2252.
50. Kats, M.A.; Capasso, F. Optical absorbers based on strong interference in
ultra-thin films. Laser and Photonics Reviews 2016, 10, 735–749.
51. Felidj, N.; Auberd, J.; Levi, G. Discrete Dipole Approximation for
Ultraviolet-Visible Extiction Spectra Simulation of Silver and Gold Colloids. J. Chem. Phys
1999, 111, 1195–1208.
25
S.A.; Boritz, C. Synthesis and study of silver nanoparticles. Journal of chemical
education 2007, 84, 322.
53. Jensen, T.R.; Schatz, G.C.; Van Duyne, R.P. Nanosphere Lithography: Surface
Plasmon Resonance Spectrum of a Periodic Array of Silver Nanoparticles by Ultraviolet−Visible Extinction Spectroscopy and Electrodynamic Modeling. The
Journal of Physical Chemistry B 1999, 103, 2394–2401.
54. Hulteen, J.C.; Van Duyne, R.P. Nanosphere lithography: A materials general
fabrication process for periodic particle array surfaces. Journal of Vacuum
Science & Technology A: Vacuum, Surfaces, and Films 1995, 13, 1553–1558.
55. Voshchinnikov, N. V.; Farafonov, V.G. Optical properties of spheroidal
particles. Astrophysics and Space Science 1993, 204, 19–86.
56. Chu, Y.; Banaee, M.G.; Crozier, K.B. Double-resonance plasmon substrates for
surface-enhanced raman scattering with enhancement at excitation and stokes
frequencies. ACS Nano 2010, 4, 2804–2810.
57. Zhou, Y.; Li, X.; Ren, X.; Yang, L.; Liu, J. Designing and fabricating double resonance substrate with metallic nanoparticles–metallic grating coupling
system for highly intensified surface-enhanced Raman spectroscopy. The
Analyst 2014, 139, 4799–4805.
58. Hedayati, M.K.; Fahr, S.; Etrich, C.; Faupel, F.; Rockstuhl, C.; Elbahri, M. The
hybrid concept for realization of an ultra-thin plasmonic metamaterial
antireflection coating and plasmonic rainbow. Nanoscale 2014, 6, 6037–6045.
59. El-Brolossy, T.A.; Abdallah, T.; Mohamed, M.B.; Abdallah, S.; Easawi, K.;
Negm, S.; Talaat, H. Shape and size dependence of the surface plasmon
resonance of gold nanoparticles studied by Photoacoustic technique. The
European Physical Journal Special Topics 2008, 153, 361–364.
60. Ahmad, T.; Wani, I.A.; Ahmed, J.; Al-Hartomy, O.A. Effect of gold ion
concentration on size and properties of gold nanoparticles in TritonX-100
based inverse microemulsions. Applied Nanoscience 2014, 4, 491–498.
61. Ghanipour, M.; Dorranian, D. Effect of Ag-Nanoparticles Doped in Polyvinyl
Alcohol on the Structural and Optical Properties of PVA Films. Journal of
Nanomaterials 2013, 2013, 1–10.
62. Scaffardi, L.B.; Tocho, J.O. Size dependence of refractive index of gold
nanoparticles. Nanotechnology 2006, 17, 1309–1315.
26
Phys. Ch. 1976, 80, 567–583.
64. MURPHY, A. Band-gap determination from diffuse reflectance measurements
of semiconductor films, and application to photoelectrochemical water-splitting.
Solar Energy Materials and Solar Cells 2007, 91, 1326–1337.
65. R, L.; R, G. Band-gap energy estimation from diffuse reflectance
measurements on sol–gel and commercial TiO2: a comparative study. Journal
of Sol-Gel Science and Technology 2012, 61, 1–7.
66. Penn, D.R. Wave-number-dependent dielectric function of semiconductors.
Physical Review 1962, 128, 2093–2097.
67. Ravindra, N.M.; Ganapathy, P.; Choi, J. Energy gap-refractive index relations
in semiconductors - An overview. Infrared Physics and Technology 2007, 50, 21–29.
68. Aziz, S.B.; Rasheed, M.A.; Ahmed, H.M. Synthesis of polymer nanocomposites based on [methyl cellulose]<inf>(1-x)</inf>:(CuS)<inf>x</inf> (0.02M ≤ x ≤ 0.08
M) with desired optical band gaps. Polymers 2017, 9, 194.
69. Gupta K., S.; Singh, J.; Akhtar, J. Materials and Processing for Gate Dielectrics
on Silicon Carbide (SiC) Surface. In Physics and Technology of Silicon Carbide
Devices; 2013; pp. 207–234 ISBN 978-953-51-0917-4.
70. Portalès, H.; Pinna, N.; Pileni, M.P. Optical response of ultrafine spherical silver
nanoparticles arranged in hexagonal planar arrays studied by the DDA method.
Journal of Physical Chemistry A 2009, 113, 4094–4099.
71. Pileni, M.P. Optical properties of nanosized particles dispersed in colloidal
solutions or arranged in 2D or 3D superlattices. New Journal of Chemistry
1998, 22, 693–702.
72. Trainer, D.J.; Putilov, A. V.; Di Giorgio, C.; Saari, T.; Wang, B.; Wolak, M.;
Chandrasena, R.U.; Lane, C.; Chang, T.R.; Jeng, H.T.; et al. Inter-Layer
Coupling Induced Valence Band Edge Shift in Mono- to Few-Layer MoS 2.
Scientific Reports 2017, 7, 1–10.
73. Hilger, A.; Tenfelde, M.; Kreibig, U. Silver nanoparticles deposited on dielectric
surfaces. Applied Physics B: Lasers and Optics 2001, 73, 361–372.
74. Berg, K.J.; Berger, A.; Hofmeister, H. Small silver particles in glass surface
layers produced by sodium-silver ion exchange - their concentration and size