Article
1
Influence of Abrasive Waterjet Parameters on the
2
Cutting and Drilling of CFRP/UNS A97075 and
3
UNS A97075/CFRP stacks.
4
Raul Ruiz-Garcia 1, Pedro F. Mayuet 1,*, Juan Manuel Vazquez-Martinez 1 and Jorge Salguero
5
Gómez 1
6
1 Department of Mechanical Engineering & Industrial Design, Faculty of Engineering, University of Cadiz.
7
Av. Universidad de Cadiz 10, E-11519 Puerto Real-Cadiz, Spain; raul.ruizgarcia@uca.es (R.R.G);
8
juanmanuel.vazquez@uca.es (J.M.V.M); jorge.salguero@uca.es (J.S.G).
9
* Correspondence: pedro.mayuet@uca.es; Tel.: +34-616-852-858
10
11
Abstract: The incorporation of plastic matrix composite materials into structural elements of the
12
aeronautical industry requires contour machining and drilling processes along with metallic
13
materials prior to final assembly operations. These operations are usually performed using
14
conventional techniques, but they present problems derived from the nature of each material that
15
avoid implementing One Shot Drilling strategies that work separately. In this work, the study
16
focuses on the evaluation of the feasibility of Abrasive Waterjet Machining (AWJM) as a substitute
17
for conventional drilling for stacks formed of Carbon Fiber Reinforced Plastic (CFRP) and aluminum
18
alloy UNS A97050 through the study of the influence of abrasive mass flow rate, traverse feed rate
19
and water pressure in straight cuts and drills. For the evaluation of the straight cuts, Stereoscopic
20
Optical Microscopy (SOM) and Scanning Electron Microscopy (SEM) techniques are used inspection
21
techniques have been used. In addition, the kerf taper through the proposal of a new method and
22
the surface quality in different cutting regions have been evaluated. For the study of holes, the
23
macrogeometric deviations of roundness, cylindricity and straightness have been evaluated. Thus,
24
this experimental procedure reveals the conditions that minimize deviations, defects, and damage
25
in straight cuts and holes obtained by AWJM.
26
Keywords: AWJM; Stack; CFRP; Aluminium UNS A97050; SOM/SEM; Kerf Taper; Surface Quality;
27
Macrogeometric deviations.
28
29
1. Introduction
30
Over the last few decades, the aeronautical industry has been highlighted for its capacity to
31
develop and manufacture structural elements built with advanced materials, having achieved a
32
leading position in this area of activity with respect to other sectors.
33
In this sense, aeronautical industry has demonstrated its capacity for the development and
34
manufacture of complex elements built with advanced materials. Thus, the main manufacturers
35
(Airbus and Boeing) have increased the use of new materials, mainly plastic matrix composites, in
36
combination with those traditionally used such as Duralumin alloys of 2XXX or the Al-Zn of 7XXX
37
series with the aim of reducing aircraft weight, maintaining the structural integrity of the assembly.
38
These materials have undoubted advantages linked to the demand of greater safety, and lower
39
energy consumption and maintenance costs that characterize the air-transport today. Also, they
40
provide an excellent relationship between mechanical strength and weight, rigidity and an increase
41
in the life-cycle thanks to its good behaviour to fatigue and corrosion [1,2].
42
Most of the structural elements used in aircraft construction need to undergo different
43
machining operations, mainly drilling or milling of contours, prior to assembly work through rivets
44
in the Final Assembly Lines (FAL) [3,4]. During the assembly tasks in aeronautical structures, these
45
materials are joined in form of stacks, which must be processed with drilling cycles under strict
46
dimensional and geometric requirements, making difficult to keep these tolerances under control
47
when the nature of the materials is different [5–8].
48
Indeed, the combination of materials of a different nature has a negative impact during
49
machining operations. On the one hand, both the heterogeneity of the material and the abrasive
50
behaviour of the carbon fibre negatively affect the tool life. Therefore, machining conditions and tool
51
geometry must be adapted to these materials in order to reduce tool wear and thermal and
52
mechanical defects produced during the cutting process, such as delamination or thermal damage to
53
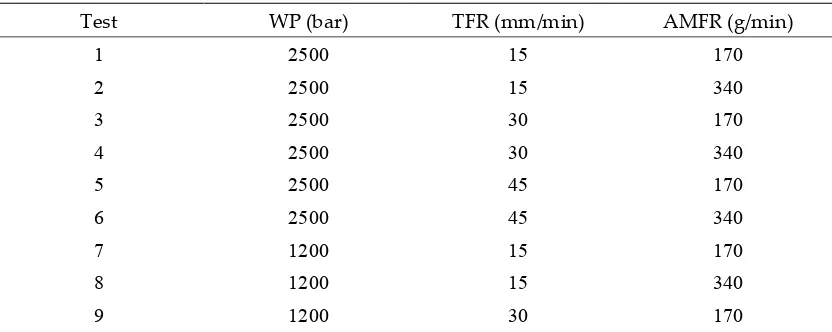
the composite matrix [9,10]. On the other hand, aluminium alloys tend to modify the geometry of the
54
tool [11], especially by the development of adhesive phenomena such as Build Up Layer (BUL) or
55
Build Up Edge (BUE) [5,12]. The union of these phenomena causes accelerated wear of the tool
56
through the loss of geometry and the increase in temperature reached during the cutting process,
57
which causes a reduction in tool life due to the synergy of the wear mechanisms produced.
58
This is compounded by problems at the stack interface, such as burring and cleaning due to
59
accumulated chip residues. As a result, the drilling process is complex to carry out in a single step
60
[13]. Instead, different successive drilling steps must be carried out until the final diameter is
61
obtained, including cleaning the rework at the interface, which does not allow One Way Assembly
62
(OWA) to be achieved as a key technology for process automation.
63
Alternatively, some authors have conducted studies of machining stacks with unconventional
64
technologies such as laser or Abrasive Water Jet Machining (AWJM) [10,14–17]. In particular, AWJM
65
has been widely studied as one of these machining alternatives, especially to replace contour milling
66
processes [2,18]. This is mainly due to different factors that positively affect the surface integrity of
67
the final parts. Among them, and in comparison with conventional machining processes, the absence
68
of tool wear, the reduction of residual stresses induced on the surface of the material and the
69
reduction of surface thermal damage as a result of low cutting temperatures should be highlighted
70
[10,19,20].
71
However, the AWJM process shows its own limitations that lead to the appearance of specific
72
defects during the cutting process, Figure 1. The most common defects in the process are the kerf
73
taper, the Erosion Affected Zone (EAZ) and the formation of three possible different roughness zones
74
along the machined surface [21]:
75
- Initial Damage Region (IDR). Area where the water jet hits on the material producing EAZ.
76
The roughness in this region is high due to the abrasive particles impacting the material.
77
- Smooth Cutting Region (SCR). Region of variable thickness depending on the cutting
78
parameters. It is the region with the best surface quality because it does not suffer the impact of
79
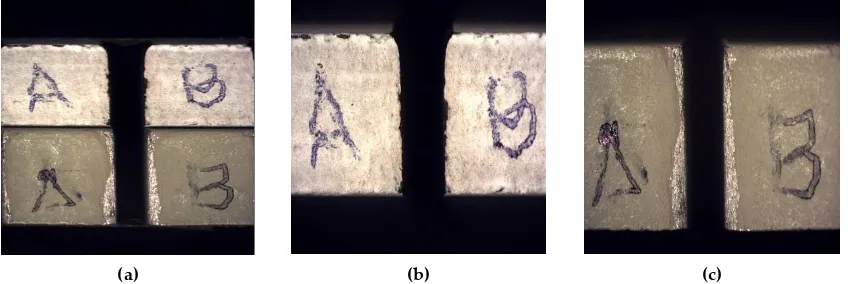
particles and the jet still has enough kinetic energy to cut.
80
- Rough Cutting Region (RCR). Final region where the jet ends of cut material. The jet has
81
lost enough cutting capacity and produces macro geometrical defects as striation marks.
82
Figure 1. Scheme with the main defects associated with AWJM: (a) Erosion affected zone and kerf
83
taper defined by inlet width (Wt) and outlet width (Wb); (b) Different roughness zones that can be
84
formed in AWJM.
85
Specifically, the removal of material through AWJM is produced by erosion caused by particles
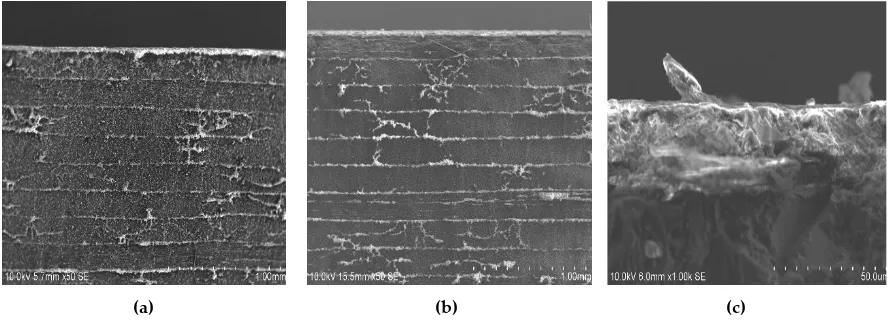
86
that impact the material at high velocity and affect each material differently. In the case of carbon
87
fibre reinforced with plastic matrix, the formation of the erosion process produces the breakage of
88
the fibres and the degradation of the matrix. This prevents the layers of the material from remaining
89
bonded causing the formation of initial cracks that result in delaminations when abrasive particles
90
penetrate between the layers of the composite [22].
91
However, some characteristic defects in the final part may occur as a result of the effect of the
92
combination of different parameters. In this article it is proposed to carry out a study based on the
93
influence of the main cutting parameters on AWJM in order to reduce the appearance of the defects
94
mentioned in stacks formed by the aluminium alloy UNSA97050 and CFRP. To this end, two
95
experiments have been carried out based on the operations most required in the machining of
96
aeronautical structures: straight cuts to analyse the cutting profile and drills to study the viability of
97
the process. Finally, the state of the cuts has been evaluated through the use of microscopic inspection
98
techniques and macro and microgeometric deviations.
99
2. Materials and Methods
100
For the experimental development, a plate of composite material CFRP AIMS 05-01-002 and
101
another one of aluminium alloy UNS A97075 have been used. Both 5 mm thickness plates have been
102
mechanically joined by 8 bolts to obtain two stack configurations: CFRP/UNS A97075 and UNS
103
A97075/CFRP.
104
As technological parameters, combinations have been made for each configuration of the three
105
most significant parameters: final water pressure (WP), abrasive mass flow (AMFR) and transverse
106
feed capacity (TFR), due to the influence analyzed in [23]. The separation distance has been kept
107
constant at 3 mm throughout the experimental phase and the abrasive selected is garnet with an
108
average particle size of 80 µm in order to optimize aluminium penetration [24]. Under these
109
considerations, the experimental design based on levels shown in Table 1 has been established.
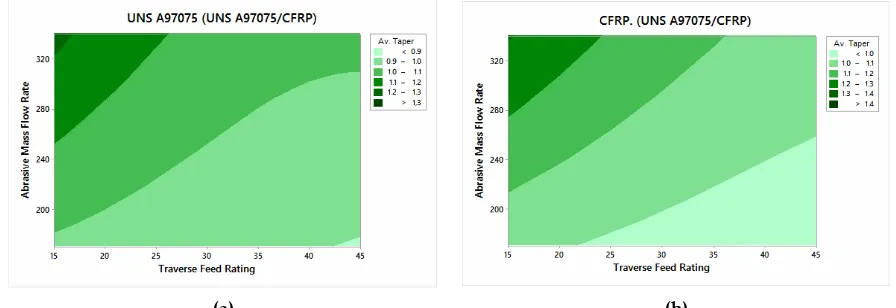
110
To carry out the tests, two experimental blocks for each stack have been made. On the one hand,
111
straight cuts were made in order to study the influence on the kerf taper and the different roughness
112
zones. On the other hand, holes with a 8 mm diameter have been drilled to study macrogeometry.
113
For this purpose, the experimental design and presimulation have been carried out using the
114
CAD/CAM software Lantek® edition 34.02.02.02.02.02.02, making a total of 48 tests mechanized with
115
a TCI water jet cutting machine model BPC 3020.
116
117
118
Table 1. Parameters used for each configuration
119
Test WP (bar) TFR (mm/min) AMFR (g/min)
1 2500 15 170
2 2500 15 340
3 2500 30 170
4 2500 30 340
5 2500 45 170
6 2500 45 340
7 1200 15 170
8 1200 15 340
10 1200 30 340
11 1200 45 170
12 1200 45 340
120
For the evaluation of straight cuts, an optical evaluation of the machined material using
121
Stereoscopic Optical Microscopy (SOM) and Scanning Electron Microscopy (SEM) techniques have
122
been employed. A Nikon SMZ 800 stereo optical microscope was used for the SOM inspection and
123
the Hitachi SU 1510 microscope was used for the SEM inspection. These techniques have been used
124
to study the incrustation of abrasive particles in the IDR zone and in the delaminations produced. In
125
addition, it has been used to generate a deeper measurement of the kerf taper. The literature tends to
126
evaluate the taper as the difference between the cutting width of the water inlet and the cutting width
127
of the water outlet depending on the thickness of the plate [17,19,25]. However, since the IDR may
128
interfere with that extent, this paper proposes a new methodology based on image processing
129
methods, for which ImageJ and Microsoft Excel® software have been used. It can be observed that
130
this process concurs in a high variability depending on two measures (Wt and Wb). Therefore, in this
131
work a new procedure is proposed that consists of capturing the image of the cut and its subsequent
132
digitalization in ten points with a non-linear distribution, as shown in Figure 2.
133
134
(a) (b)
Figure 2. Proposal of measurement of the kerf taper from: (a) SOM image and (b) geometry
135
discretization.
136
For the measurement of roughness, the Mahr Perthometer Concept PGK 120 (Mahr, Göttingen,
137
Germany) has been employed to analyse the Ra of the specimens in each test in different zones
138
coinciding with IDR, SCR and RCR, Figure 3.
139
140
Figure 3. Schematic representing the roughness measurement zones and the distance between them
141
for: (a) UNS A97075/CFRP configuration; (b) CFRP/UNS A97075 configuration.
142
For the evaluation of the holes, a station of measurement Mahr MMQ44 Form Tester (Mahr,
143
Göttingen, Germany) has been used to measure the roundness at the entrance and exit of the drill in
144
each material, the cylindricity of the entire profile of the drill, and the straightness in four separate
145
generatrices to 90°. To analyze the macrogeometric deviations, replicas of the holes due to the
146
impossibility of direct measuring on the material have been fabricated. These replicas have been
147
made with a polymer type F80 Ra (R.G.X, Plastiform, Madrid, Spain) with the ability to guarantee
148
stability during the measurement process for diameters greater than 4 mm.
149
Finally, to distinguish the most significant parameters for evaluation results, analysis of variance
150
(ANOVA) for a 95% confidence interval has been employed. After that, contour charts for each
151
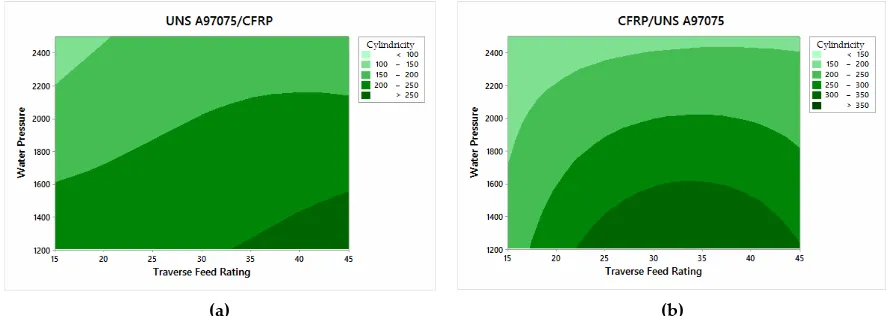
variable studied in the experimental have been obtained.
152
3. Results and Discussion
153
3.1. Straight Cuts Evaluation
154
3.1.1. SOM/SEM Evaluation
155
In order to detect possible defects in the tests, SOM inspection was carried out parallel and
156
perpendicular to the direction of TRF. First, to ease later kerf study, images were taken from the
157
machine feed direction from both united stack and independent parts as shown in Figure 4. The
158
images show the influence of the opening of the jet at the entrance of the material producing an
159
increase in the width of kerf. This phenomenon is related to damages produced in the IDR zone [23].
160
(a) (b) (c)
Figure 4. SOM image of the cutting front in: (a) Stack CFRP/UNS A97075; (b) CFRP plate; (c) UNS
161
A97075 plate
162
On the other hand, Figure 5 shows the profile of CFRP specimens in order to identify
163
delaminations. In order to visualize the delamination along the machined surface, several images
164
were taken showing the absence of visible delamination after machining in the test performed with
165
the parameters considered to be the most aggressive.
166
(a) (b)
Figure 5. SOM image of CFRP profile. Test 2. WP = 2500 bar, TFR = 15 mm/min and AMFR = 340
168
gr/min for: (a) UNS A97075/CFRP; (b) CFRP/UNS A97075.
169
In order to obtain a more detailed microscopic analysis of the samples, images have been taken
170
using SEM microscopy. Thus, Figure 6 shows the results of the SEM inspection in CFRP showing that
171
no delamination was detected. However, Figure 4 (c) shows in detail the state of the specimen
172
entrance zone where signs of impact deformation and particle drag have been observed. This state
173
extends to the interface reflecting that a percentage of particles have lodged in the space between the
174
two materials.
175
176
(a) (b) (c)
Figure 6. SEM image of CFRP profile. Test 2. WP = 2500 bar, TFR = 15 mm/min and AMFR = 340
177
gr/min for (a)UNS A97075/CFRP; (b) CFRP/UNS A97075; (c) Interface over CFRP.
178
As for aluminium alloy, SOM study showed a series of dark coloured streaks along the profile
179
that repeated for both configurations to a greater or lesser extent depending on the energy of the jet.
180
Specifically, Figure 7 (a) shows the marks mentioned at the bottom while Figure 7 (b) at the top. This
181
phenomenon together with the colour of the stretch mark seems to indicate that they are located in
182
the zone close to the contact with the carbon fibre. Finally, Figure 7 (c) shows the result of the study
183
for test 11 where no transfer of carbon fibre to aluminium is observed, possibly due to the lower
184
energy and the quantity abrasive particles used.
185
(a) (b) (c)
Figure 7. Profile SOM of UNS A97075 from: (a) UNS A97075/CFRP. Test 2. WP = 2500 bar, TFR = 15
188
mm/min and AMFR = 340 gr/min; (b) CFRP/UNS A97075. Test 2. WP = 2500 bar, TFR = 15 mm/min
189
and AMFR = 340 gr/min;(c) CFRP/UNS A97075. Test 11. WP = 1200 bar, TFR = 45 mm/min and AMFR
190
= 170 gr/min.
191
In an attempt to obtain more information on the marks observed in Figure 7, the SEM/EDS
192
inspection of aluminium has focused on discovering the state of the aluminium and the nature of
193
these marks. Initially, Figures 8 (a) and (b) show the state of the material at the inlet. In a detailed
194
way, the embedded particles and the deformation produced during the cutting process are
195
appreciated, coinciding with the IDR or zone 1.
196
197
(a) (b)
(c)
(d)
Figure 8. Test 2 SEM evaluation: (a) Abrasive imbued into UNS A97075; (b) Abrasive particles in the
198
interface and channel created over the material; (c) Remains of carbon and point of EDS; (d) EDS results
199
On the other hand, figures 8 (c) and (d) show the stain examined in the striations observed by
201
SOM microscopy and the results of the EDS analysis, respectively. The EDS analysis revealed the
202
high presence of carbon at this point, confirming the carry-over of carbon particles during machining
203
from one material to another. It should be noted that no traces of aluminium deposited on the carbon
204
fibre have been detected.
205
To analyse the state of the aluminium outside the zone of the stretch marks, another EDS spot
206
was carried out outside those stains and showed almost no carbon and a huge peak on aluminium.
207
As a direct conclusion it appears that particles from composite are swept for the water beam and
208
because of the water high energy, they end up embedded into UNS A97075. It seems like composite
209
deposition over aluminium has a direct correlation with beam penetration capacity.
210
So, contrary to what one would expect, a higher abrasive pressure and flow has not resulted
211
in an increase in delaminations for both configurations. Similarly, the inclusion of abrasive particles
212
has not greatly increased within the parameters studied. However, an increase in the inclusion of
213
carbon particles in the aluminium alloy has been observed as the pressure increases.
214
215
3.1.2. Kerf Taper evaluation
216
217
The ANOVA analysis performed showed that AMFR and TFR parameters have been the most
218
influential in taper formation. Average kerf taper values for each material when the configuration
219
UNS A97075/CFRP is set are shown in Figure 9. The same values for configuration CFRP/UNS
220
A97075 are shown in Figure 10.
221
222
(a) (b)
Figure 9. Average kerf taper for USN A97075/CFRP configuration: (a) UNS A97075; (b) CFRP.
223
224
Taking into account that the diameter of the jet is 0.74 mm, the data that approximate this value
225
are those that will have the lowest values of taper according to the average established between all
226
the measurements.
227
In this way, the data represented in figures 9 and 10 show that the taper is reduced as AMFR
228
decreases and TFR increases, showing the best results for TFR = 45 mm/min and AMFR = 170 gr/min,
229
in accordance with [25].
230
This behaviour is shared with the CFRP behaviour in CFRP/UNS A97075 configuration. Figure
231
10 b, however, shows a very different behaviour. This change is due to the lesser energy of the water
232
beam when it collides with the aluminium. Since a percentage of energy is transformed during the
233
CFRP machining, it appears that the AMFR is the determinant parameter when the cut’s wide is
234
examined. As for the differences between the two material configurations, figure 10 shows that when
235
the jet directly affects the carbon fibre, the taper generated for the best parameter ratio reaches values
236
higher than 1.2 compared to the value 1 reached for the UNS A97075/CFRP configuration. This shows
237
the difference in the mechanical properties of each material, offering greater resistance to penetration
238
Overall, a similar behaviour is observed between the materials located in the upper and lower
240
part of the stack. Despite this, a smaller taper is always observed in UNS A97075 than in CFRP.
241
242
(a) (b)
Figure 10. Average kerf taper for CFRP/USN A97075/ configuration: (a) CFRP; (b) UNS A97075.
243
244
3.1.3. Surface roughness
245
246
The influential parameters in the analysis of surface quality are also AMFR and TFR for both
247
configurations. In this case, given the importance of roughness zones, all evaluated data are shown
248
in Appendix A.
249
Figure 11 shows the results of the UNS A97075/CFRP configuration. A tendency to increase the
250
average roughness can be observed as TFR increases and AMFR decreases. Figure 12, on the other
251
hand, shows the results of CFRP/UNS A97075 configuration. The same trend as in Figure 11 is
252
observed although there is a greater difference between the material placed at the top and bottom.
253
254
(a) (b)
Figure 11. Average roughness for UNS A97075/CFRP configuration: (a) UNS A97075 and (b) CFRP.
255
256
Despite of the fact that increasing AMFR has to increase the number of particles collisions during
257
the machining, it seems that it also ensures a lesser value of average roughness for UNS A97075/CFRP
258
configuration. In fact, its effect seems to be especially determinant over the material placed on the
259
bottom of the stack as could be seen in Figure 11(b).
260
However, the configuration CFRP/UNS A97075 shows the opposite tendency. It seems like TFR
261
is much more an influencing parameter than the AMFR regarding the minimization of average
262
roughness.
263
Both of these behaviors could be explained regarding kerf taper results. It seems that in order to
264
parameter is the wide of the cut on the material placed on the top of the stack. This reduces particles
266
collisions and reduces water beam energy loss.
267
268
(a) (b)
Figure 12. Average roughness for CFRP/USN A97075 configuration: (a) CFRP and (b) UNS A97075.
269
270
It is observed that the maximum roughness of the material placed at the bottom of the stack,
271
regardless of its nature, has lower values. In addition, the maximum roughness never exceeds 7 µm
272
in any test. A more in-depth analysis of the data based on Appendix A reflects this. On the one hand,
273
the area with the greatest damage is region 1 or IDR due to deformations and damage caused by the
274
impact of the jet on the material. In addition, this is the region where embedded particles have been
275
detected. On the other hand, the material at the bottom has lower roughness values in region 4 due
276
to the protection of the material at the top.
277
On the other hand, it can be observed that regions 2 and 5, corresponding to SCR, do not have
278
values lower than those recorded in zones 3 and 6 as RCR. This indicates the existence of two zones
279
because the jet still has enough kinetic energy to make the cut without the appearance of striations.
280
281
3.2. Holes Evaluation
282
283
3.2.1. Roundness deviation
284
285
Figure 13 shows the data obtained from roundness deviations for each material and the total
286
average of both materials. In this way, the results can be analyzed separately.
287
288
(a) (b)
Figure 13. Average roundness: (a) UNS A97075/CFRP configuration; (b) CFRP/UNS A97075 configuration.
289
290
Figure 13 (a) shows the data for UNS A97075/CFRP configuration. The data show that in all tests
291
is due to the fact that the erosion and removal of composite materials is different from that produced
293
in metallic materials. Thus, in CFRP the particles weaken and remove the matrix of the compound to
294
subsequently break the fibres of the adjacent zone [2]. This phenomenon, combined with the
295
material's resistance to jet dispersion as a result of the loss of energy after cutting the aluminium,
296
leads to an increase in the deflection in this material. This deflection increases considerably as WP
297
decreases and TFR increases, which makes sense because these are tests with lower shear power.
298
On the other hand, Figure 13 (b) shows the results of CFRP/UNS configuration A97075. In this
299
particular case, the deviations follow a similar relationship to that of the previous case in terms of
300
parameter influence, although it is true that the difference in the measured values is high. Thus,
301
although in this case the aluminium is at the bottom of the pile, it seems that the expansion of the
302
water jet does not deform the entry zone due to the differences in terms of removal of material
303
explained in the previous paragraph. This results in homogeneous deviations in roundness between
304
the two configurations, which favours a subsequent joint by means of rivets.
305
306
3.2.2. Cylindricity deviation
307
308
Cylindricity deviation has also been measured with two measures for each material and
309
configuration. However, due to the nature of the test, only one value result as output. Appendix D
310
contains all collected data. Nevertheless, an ANOVA description of variables influence is shown in
311
Figure 14.
312
The ANOVA analysis carried out shows that the parameters that have the greatest influence on
313
the formation of the deviations are WP and TFR. Specifically, Figure 14 shows that the UNS
314
configuration A97075/CFRP has lower cylindricity deviation values, which is in good agreement with
315
the taper values obtained. This is due to the close relationship between both parameters. In order to
316
offer a better correlation of results, the profiles measured for test 11 are presented as an example,
317
Figure 15.
318
A more detailed description of the data reflects that cylindricity decreases as TFR decreases and
319
WP increases. Specifically, Figure 14 (a) reveals that TFR has a superior influence when the alloy is at
320
the inlet of the material which reflects the importance of employing reduced feed rates to prevent its
321
formation. As for figure 15, both (a) and (b) shows CFRP on the bottom and UNS A97075 on the top
322
of the cone. It can be observed how it affects the energy loss to the generated hole, especially in Figure
323
15 (a).
324
325
(a) (b)
Figure 14. Cylindricity results on: (a) UNS A97075/CFRP configuration; (b) CFRP/UNS A97075 configuration.
326
(a) (b)
Figure 15. Cylindricity deviations. Test 11. WP = 1200 bar, TFR = 45 mm/min and AMFR = 170 gr/min for:
328
(a) UNS A97075/CFRP configuration; (b) CFRP/UNS A97075 configuration.
329
330
3.2.3. Straightness deviation
331
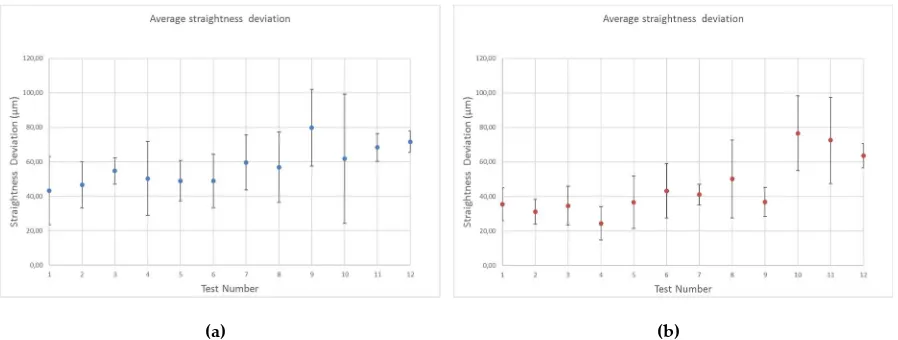
332
In this case, there is no distinction between materials and straightness has been evaluated
333
throughout the entire profile. Thus, Figure 15 shows a comparison between the values obtained for
334
the two configurations.
335
As a general conclusion, a higher water jet drilling capacity means less straightness deviation. It
336
is also observed that the CFRP/UNS A97075 configuration shows better results for the same test
337
number except for the last three tests which, due to their lower drilling capacity due to the use of
338
lower WP and TFR, are not able to maintain a uniform cutting profile of the aluminium alloy and
339
therefore cannot maintain straightness along the hole.
340
The results reveal that the data in configuration UNS A97075/CFRP are slightly lower than those
341
recorded in configuration CFRP/UNS A97075. In addition, it should be noted that for high pressures
342
the straightness deviation increases when the compound is located at the top.
343
On the other hand, it should be noted that the standard deviation presented by the results is
344
high, which makes it difficult to establish relationships between the results.
345
346
347
(a) (b)
Figure 15. Straightness deviations results on: (a) UNS A97075/CFRP configuration; (b) CFRP/UNS A97075
348
4. Conclusions
350
A study has been carried out on the influence of the parameters of the abrasive water jet on the
351
quality of straight cuts and holes in composite materials and aeronautical aluminium. Based on this,
352
the following conclusion can be drawn:
353
1. The machining of straight cuts has revealed that thermal damage is eliminated and the
354
appearance of delamination in CFRP is reduced. Thus, for the selected parameters, no
355
delamination has been found in the mechanized test samples.
356
2. The proposed kerf taper measurement method has been validated for measurement in stacks.
357
The results show the influence of the selected parameters obtaining the best results for high
358
TFR and AMFR for both configurations, especially USN A97075/CFRP, with CFRP being the
359
material with the highest kerf taper. On the other hand, the CFRP/UNS A97075 configuration
360
has lower microgeometric deviations for the three evaluated parameters due to the lower
361
loss of jet energy.
362
3. Ra is in all cases below 7 µm, although this value is specific for tests 9, 10, 11 and 12. The
363
functional holes show a lower roughness for both materials in any configuration.
364
Nevertheless, it appears that the UNS A97075/CFRP configuration offers a better roughness
365
of the holes.
366
4. The study of surface quality has revealed that the IDR zone of the second material (region 4)
367
is attenuated from impacts of particle and EAZ impacts. On the other hand, the presence of
368
RCR has not been detected.
369
5. The measurements obtained of roundness present a greater deviation at the entrance of the
370
drill due to the IDR zone in region 1, independently of the selected configuration, although
371
it is true that the CFRP/UNS A97050 configuration presents values around 200% lower for
372
the tests with lower penetration power (9, 10, 11 and 12).
373
6. The influence of kerf taper on cylindricity deviations has been reflected through the
374
evaluated profiles, recording that the parameters with the greatest influence on its formation
375
are WP and TFR. In this case the configuration UNS A97075/CFRP presents better results of
376
cylindricity.
377
7. The straightness deviations have not allowed to establish consolidated conclusions due to
378
the high standard deviation registered. However, it can be seen once again that tests 9, 10, 11
379
and 12 have higher values.
380
381
Finally, it should be noted that this process does not generate burrs in metallic materials due to
382
its abrasive nature or thermal gradients that damage the material. On the other hand, it should be
383
noted that each configuration has different characteristics, but it is the UNS A97075/CFRP
384
configuration that presents the best results in terms of macro and microgeometric deviations.
385
386
Author Contributions: Conceptualization, R.R.G and P.F.M.A.; Methodology, R.R.G and P.F.M.A.; Software,
387
R.R.G and J.S.G; Validation, P.F.M.A. and J.M.V.M.; Formal Analysis, P.F.M.A. and J.M.V.M.; Investigation,
388
R.R.G and P.F.M.A.; Resources, J.M.V.M. and J.S.G.; Data Curation, R.R.G and J.M.V.M.; Writing-Original Draft
389
Preparation, R.R.G.; Writing-Review & Editing, P.F.M.A. and J.S.G.; Visualization, P.F.M.A. and J.M.V.M.;
390
Supervision, P.F.M.A; Project Administration, J. S.G.; Funding Acquisition, J.S.G.
391
Funding: This work has received financial support from Special Actions for the Transfer of the Programme for
392
the Promotion and Promotion of the Research and Transfer Activity of the University of Cadiz.
393
Appendix A
400
Table A 1. Average roughness UNS A97075/CFRP configuration
401
UNS A97075/CFRP Configuration Ra (μm)
Test 1 2 3 4 5 6 7 8 9 10 11 12
Al
(inlet)
region
1 4,95 4,00 6,73 4,74 6,68 6,43 7,39 3,36 8,00 3,76 8,22 5,05
region
2 3,52 2,78 4,34 4,01 4,66 3,84 4,19 2,88 5,05 3,23 5,45 3,82
region
3 4,22 3,45 4,79 3,27 5,04 3,79 3,87 2,85 4,58 3,69 4,70 3,64
CFRP
(Outlet)
region
4 4,99 3,72 5,77 4,42 5,48 4,73 4,36 3,30 5,44 4,24 4,49 4,72
region
5 5,39 4,48 5,54 4,42 6,31 4,94 4,31 3,84 5,89 5,07 5,98 5,40 region
6 4,19 3,99 5,27 4,43 4,20 4,27 4,49 3,77 5,45 5,90 6,53 7,00
402
Table A 2. Average roughness CFRP /UNS A97075 configuration
403
CFRP/ UNS A97075 Configuration Ra (μm)
Test 1 2 3 4 5 6 7 8 9 10 11 12
CFRP
(inlet)
region
1 6,99 4,79 7,80 5,66 7,46 6,52 8,36 4,01 7,89 5,08 7,59 5,97 region
2 4,78 3,80 5,04 4,49 5,38 4,34 5,00 3,54 5,17 4,54 5,00 4,40 region
3 4,96 3,91 4,97 4,25 5,13 4,78 4,97 3,94 4,56 4,10 5,64 4,27
Al
(Outlet)
region
4 4,54 3,42 5,12 4,17 5,19 4,01 4,57 3,55 4,62 4,19 4,48 4,06 region
5 4,68 3,21 4,82 3,81 5,21 4,08 4,27 3,35 4,88 4,58 5,69 4,73
region
6 4,22 3,12 5,11 3,35 5,31 4,24 5,20 3,63 4,79 4,54 5,10 4,44
404
References
405
1. Bazli, M.; Ashrafi, H.; Jafari, A.; Zhao, X.L.; Gholipour, H.; Oskouei, A.V. Effect of thickness and
406
reinforcement configuration on flexural and impact behaviour of GFRP laminates after exposure to
407
elevated temperatures, Compos. Part B Eng. 2019, 157, 76–99, doi:10.1016/j.compositesb.2018.08.054.
408
2. Hejjaji, A.; Zitoune, R.; Crouzeix, L.; Le Roux, S.; Collombet, F. Surface and machining induced damage
409
characterization of abrasive water jet milled carbon/epoxy composite specimens and their impact on tensile
410
behavior, Wear, 2017, 376–377, 1356–1364, doi:10.1016/j.wear.2017.02.024.
411
3. Casalegno, V.; Salvo, M.; Rizzo, S.; Goglio, L.; Damiano, O.; Ferraris, M. Joining of carbon fibre reinforced
412
polymer to Al-Si alloy for space applications, Int. J. Adhes. Adhes 2018, 82, 146–152,
413
4. Lambiase, F.; Durante, M.; Di Ilio, A. Fast joining of aluminum sheets with Glass Fiber Reinforced Polymer
415
(GFRP) by mechanical clinching, J. Mater. Process. Technol 2016 236 241–251,
416
doi:10.1016/j.jmatprotec.2016.04.030.
417
5. Park, K.H.; Beal, A.; Kim, D.D.W.; Kwon, P.; Lantrip J. Tool wear in drilling of composite/titanium stacks
418
using carbide and polycrystalline diamond tools, Wear 2011, 271, 2826–2835, doi:10.1016/j.wear.2011.05.038.
419
6. Ramulu, M.; Branson, T. ; Kim, D. A study on the drilling of composite and titanium stacks, Compos. Struct.
420
2001, 54, 67–77, doi:10.1016/S0263-8223(01)00071-X.
421
7. Zitoune, R.; Krishnaraj, V.; Collombet, F. Study of drilling of composite material and aluminium stack,
422
Compos. Struct. 2010, 92, 1246–1255, doi:10.1016/j.compstruct.2009.10.010.
423
8. Kuo, C.; Li, Z.; Wang, C. Multi-objective optimisation in vibration-assisted drilling of CFRP/Al stacks,
424
Compos. Struct. 2017, 173, 196-209, doi:10.1016/j.compstruct.2017.04.026.
425
9. Saleem, M.; Toubal, L.; Zitoune, R.; Bougherara, H. Investigating the effect of machining processes on the
426
mechanical behavior of composite plates with circular holes, Compos. Part A Appl. Sci. Manuf. 2013, 55, 169–
427
177, doi:10.1016/j.compositesa.2013.09.002.
428
10. Alberdi, A.; Artaza, T.; Suárez, A.; Rivero, A.; Girot, F. An experimental study on abrasive waterjet cutting
429
of CFRP/Ti6Al4V stacks for drilling operations, Int. J. Adv. Manuf. Technol. 2016, 86, 691–704,
430
doi:10.1007/s00170-015-8192-x.
431
11. D’Orazio, A.; El Mehtedi, M.; Forcellese, A.; Nardinocchi, A.; Simoncini, M. Tool wear and hole quality in
432
drilling of CFRP/AA7075 stacks with DLC and nanocomposite TiAlN coated tools, J. Manuf. Process. 2017,
433
30, 582–592, doi:10.1016/j.jmapro.2017.10.019.
434
12. Zitoune, R.; Krishnaraj, V.; Sofiane Almabouacif, B.; Collombet, F.; Sima, M.; Jolin, A. Influence of
435
machining parameters and new nano-coated tool on drilling performance of CFRP/Aluminium sandwich,
436
Compos. Part B Eng. 2012 ,43, 1480–1488, doi:10.1016/j.compositesb.2011.08.054.
437
13. Wang, F.; Qian, B.; Jia, Z.; Fu, R.; Cheng, D. Secondary cutting edge wear of one-shot drill bit in drilling
438
CFRP and its impact on hole quality, Compos. Struct. 2017, 178, 341–352,
439
doi:10.1016/j.compstruct.2017.04.024.
440
14. El-Hofy, M.; Helmy, M.O.; Escobar-Palafox, G.; Kerrigan, K.; Scaife, R.; El-Hofy, H.; Abrasive Water Jet
441
Machining of Multidirectional CFRP Laminates, Procedia CIRP. 2018, 68, 535–540,
442
doi:10.1016/j.procir.2017.12.109.
443
15. Schwartzentruber, J.; Spelt, J.K.; Papini, M.; Prediction of surface roughness in abrasive waterjet trimming
444
of fiber reinforced polymer composites, Int. J. Mach. Tools Manuf. 2017, 122, 1–17,
445
doi:10.1016/j.ijmachtools.2017.05.007.
446
16. Yuvaraj, N.; Kumar, M.P. Cutting of aluminium alloy with abrasive water jet and cryogenic assisted
447
abrasive water jet: A comparative study of the surface integrity approach, Wear. 2016,362–363, 18–32,
448
doi:10.1016/j.wear.2016.05.008.
449
17. MM, I.W.; Azmi, A.; Lee, C.; Mansor, A. Kerf taper and delamination damage minimization of FRP hybrid
450
composites under abrasive water-jet machining, Int. J. Adv. Manuf. Technol. 2018, 94, 1727–1744,
451
doi:10.1007/s00170-016-9669-y.
452
18. Ramalingam, T.; Bhaskar, S.; Seshumadhav, K.; Allamraju, K.V. Optimization of process parameters in
bi-453
directional carbon fiber composite using AWJM, Mater. Today Proc. 2018, 5, 18933–18940,
454
doi:10.1016/j.matpr.2018.06.243.
455
19. Alberdi, A.; Suárez, A.; Artaza, T.; Escobar-Palafox, G.A.; Ridgway, K. Composite Cutting with Abrasive
456
Water Jet, Procedia Eng. 2013, 63, 421–429, doi:10.1016/j.proeng.2013.08.217.
457
20. Unde, P.D.; Gayakwad, M.D.; Patil, N.G.; Pawade, R.S.; Thakur, D.G.; Brahmankar, P.K.; Experimental
458
Investigations into Abrasive Waterjet Machining of Carbon Fiber Reinforced Plastic, J. Compos. 2015, 2015,
459
1–9, doi:10.1155/2015/971596.
460
21. Ravi Kumar, K.; Sreebalaji, V.S.; Pridhar, T. Characterization and optimization of Abrasive Water Jet
461
Machining parameters of aluminium/tungsten carbide composites, Meas. J. Int. Meas. Confed. 2018, 117, 57–
462
66, doi:10.1016/j.measurement.2017.11.059.
463
22. Shanmugam, D.K.; Nguyen, T.; Wang, J. A study of delamination on graphite/epoxy composites in abrasive
464
waterjet machining, Compos. Part A Appl. Sci. Manuf. 2008, 39, 923–929,
465
23. Mayuet, P.F.; Girot, F.; Lamíkiz, A.; Fernández-Vidal, S.R.; Salguero, J.; Marcos, M. SOM/SEM based
467
Characterization of Internal Delaminations of CFRP Samples Machined by AWJM, Procedia Eng. 2015, 132,
468
693–700, doi:10.1016/j.proeng.2015.12.549.
469
24. Shukla, R.; Singh, D. Experimentation investigation of abrasive water jet machining parameters using
470
Taguchi and Evolutionary optimization techniques, Swarm Evol. Comput. 2017, 32, 167–183,
471
doi:10.1016/j.swevo.2016.07.002.
472
25. Gupta, V.; Pandey, P.M.; Garg, M.P.; Khanna, R.; Batra, N.K. Minimization of Kerf Taper Angle and Kerf
473
Width Using Taguchi’s Method in Abrasive Water Jet Machining of Marble, Procedia Mater. Sci. 2014, 6,
474
140–149, doi:10.1016/j.mspro.2014.07.017.