Comprrehensive Study On Road And Traffic Conditions On
Road Safety
#1 SINGULURI SIVA JYOTHI, P.G SCHOLAR, sivajyothisinguluri@gmail.com
#2 G. GIRIDHAR, ASSISTANT PROFESSOR, giridhar@pydah.co.in
DEPARTMENT OF CIVIL ENGINEERING
PYDAH COLLEGE OF ENGINEERING AND TECHNOLOGY,KAKINADA,A.P.
ABSTRACT
India is a developing country and safety of road is still in a premature stage. Accident severity is increasing in increasing order due to increasing in vehicle population. Accident leads to disablement, death, damage to health and property, social suffering and general degradation of environment. The road accident situation in India is alarming. Records show that there is one death at every 2.75 minutes because of road accidents. The high accident rate is largely attributed to the inadequacy of the highways and other main roads to meet the traffic demands, road user behaviour, vehicle defects, poor road geometrics and visibility. Road accidents inflict heavy economic loss to the country. Road Safety is necessary to reduce accident involving both human and vehicles there by making the road more safe and user friendly to traffic.
NH-16 is one of the major connectivity from Vishakhapatnam to Anakapalle which caters to the need of transportation of light goods to heavy goods and passengers. The deficiencies along with the measures for further improvement have been presented in this thesis.
1.INTRODUCTION
1.1 General
Road crashes take away the right to life of 3000 people every day. This is a global humanitarian disaster and it is man-made. (Global road safety partnership annual report 2013)Road safety is one of the most important problems in our society. Every year 1.2million of people is killed between 20 and 50 million people are injured in road accidents. If current trends continues road traffic accident are predicted to be third leading contributor to the global burden disease and injury by 2020.India had earned the dubious distinction of having more number of fatalities due to road accidents in the world. Road safety is emerging as a major social concern around the world especially in India.Accidents are a drain on the national economy and may lead to disablement, death, damage to health and property, social suffering and general degradation of environment.
To minimize the no. of crashes by any kind and severity expected to occur on the entity
during a specific period is known as Road Safety. Accidents and Fatalities on road are the result of inter-play of a number of factors. Road users in India are heterogeneous in nature, ranging from pedestrians, animal-driven carts, bicycles, rickshaws, hand-carts, tractor trolleys, to various categories of two/three wheelers, motor cars, busses, trucks and multi-axle commercial vehicles etc.., The vehicle population has been steadily increasing because of change in the style of living people. Increase in vehicle population with limited road space used by a large variety of vehicles as heightened the need and urgency for a well thought-out policy on the issue of Road Safety. In India the rate of accident is directly proportional to growth of vehicle population
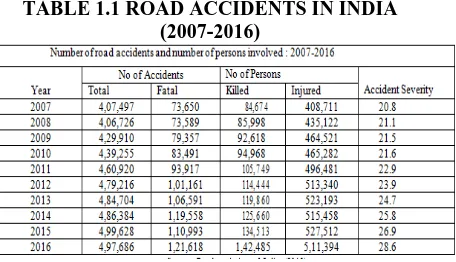
Road accidents are a human tragedy, which involve high human suffering. They impose a huge socio-economic cost in terms of untimely deaths, injuries and loss of potential income. The ramifications of road accidents can be colossal and its negative impact is felt not only on individuals, their health and welfare, but also on the economy. Consequently, road safety has become an issue of national concern. Road safety is a multi-sect oral and multi-dimensional issue. It incorporates the development and management of road infrastructure, provision of safer vehicles.Legislation and law enforcement, mobility planning, provision of health and hospital services, child safety, urban land use planning. In other words, its ambit spans engineering aspects of both roads and vehicles on one hand and the provision of health and hospital services for trauma cases in post-crash scenario. Road accident in India is shown in table 1.1
Source: Road statistics of India (2012) Cause of accidents and their contribution are as follows by statistics of Road Accidents in India (2012)
Drivers Fault 77.5%
Defect in Road Condition 1.5% Defect in Motor Vehicle 1.6% Fault of bicyclist 1.3% Weather Condition 1% All Other Causes 14.8%
Road safety in India is the poorest in the world. According to MORTH 2013 India has the highest no of accidents in the world. Awareness among road users and safe design of road
components is necessary to reduce accident involving both human and vehicles
2. REVIEW OF LITERATURE
Many factors may exhibit a measurable influence on driving behaviour and traffic safety on two-lane highways (NH-16, 2008). These include, but are not limited to,
(i)Human factors such as improper judgment of road ahead and traffic, driving under the
Influence of alcohol or drugs, driver education and experience, youngdriver,Age and sex.
(ii)Traffic factors like speed, volume, density, capacity, traffic mix and variation.
(iii)Vehicle deficiencies, such as defective brake, headlight, tyres, steering and vehicle condition
(iv) Road condition like slippery or skidding road surface, ravels, pot hole, ruts etc.
(v)Road design such as inadequate sight distances, shoulder width, no of lanes, improper curve design, improper lighting and traffic control devices.
(vi)Weather condition like fog, heavy rainfall, dust, snow etc.
(vii)Other causes such as enforcement, incorrect sign and signals, service station, badly located
advertisement, stray animals etc. 2.1 Driver characteristics
2.1.1 Age, Gender and Personality
Hassan and Aty (2012) studied 680 young driver behaviour involvement in traffic crash in the age of 16-17.In vehicle distraction, attitude towards speeding anddemographiccharacteristics were the significant factors effect young drivers crash risk at theage of 18-24.
Constantinou et al., (2011) found that young novice driver (<25 yrs.) are in high risk related to traffic offence. The study was based on gender, sex, age and personality.Chandraratna et al.,(2006) studied licensed driver involvement in a crash. Using logisticRegression it was found very young and old male drivers are responsible due to both speedingand non-speeding.
3.DATA COLLECTION
The only information available for accident studies is the FIR (First Information Report) lodged in the police station. The data from these records of last ten years (2007-2016) were extracted from the Fir record filed under IPCno.279/337/338/304(A). Vehicles involved in accidents and reported in the F.I.R. The categories of vehicles include tempo, auto, mini-truck, minibus, Tata indica, Tata-407, Trucker, motor cycle, tanker, tailor, truck and bus.
3.1 Road Selected for Study
Two-lane roads fromVishakhapatnam to Anakapalle on NH-16 was chosen
For this study the following stretches were selected for data collection. The study area is shown in fig 3.1 i) Vishakhapatnam to Sheela Nagar, km2/0
(ii) Sheela Nagar to Gajuwaka, Km3/0
(iii)Gajuwakato Lankelapalem Km3/0-km4/0
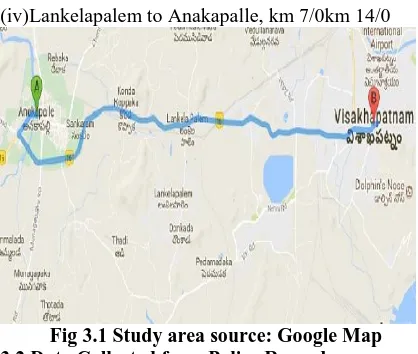
(iv)Lankelapalem to Anakapalle, km 7/0km 14/0
Fig 3.1 Study area source: Google Map 3.2 Data Collected from Police Records
With the prior permission of the concerned S.P the accident data were collected on two-lane highways from three police stations as shown in Table 3.1
4.ANALYSIS OF DATA AND DISCUSSION 4.1 Accident Rate and Frequency
Accident Rate = (M/L)
Where M = Total no of Accidents of a stretch L = Length of Road
From the Table 4.1 and 4.2 it is observed that frequency and rate of accident is more for stretch-4 followed by stretch-1, 2, 3 respectively
4.2Annual Variation in Accidents
Fig. 4.5 shows the annual variation in accidents of total stretches during year 2007-2016.It is observed that percentage accidents are increasing relatively in most of the year. In the year 2007 accident rate was high and low in the year 2002. It may be due to increase in no of vehicles, bad traffic environment, and increase in population.
Fig. 4.6-4.10 shows annual variation in accidents of the four stretches. It is observed that no of accidents are more for stretch-1 and 4 are more higher than stretch -2 and 3.This is because of high traffic volume on stretch 4.Traffic volume decreases on stretch-3 as stretch -4 is connected to NH-16.Stretch-1has high population density as this is the
main town of the Annul district. Accident rate is more due to more no of commercial and non-commercial vehicles on the road, bad traffic environment.
4.3 Monthly Variation in Accidents
Fig 4.3 shows the monthly variation in accidents. Peak accident occurs in summer season i.e. in the month of March, April and may. This is due to distraction related to environment.
4.4 Hourly Variation in Accidents
Fig 4.17shows hourly variation in accidents. One can observe more accidents occurs in between 8PM to 9PM.In this hour line truck (Truck Series) start their long journey. Most of the driver do not use speedometer as they drive by approximation .Speed crosses limiting speed as a result accident occur. Also they drink and drive in the evening hour. In the late night they use marijuana as a result reaction time increases and loss of control occurs. Some drivers make the vehicle over load. In India load capacity is 10 ton or 16.2 ton for goods carriage but they carry more than that results uncontrolled and leads to accidents.
4.5 Vehicles Involved in Fatalities
Vehicle users related to fatalities during 2007-2016 are shown in pie chart in percent. The results indicate that 59 percent of fatalities are due to truck drivers followed by 26 percent by unknown driver, 7 percent by motor cycles, 5 percent by car and jeep,3percent by bus respectively as shown in fig.4.18.They consume alcohol and drugs in long driving. As a result reaction time increases and loss of control occurs during speed driving leads to fatalities.
4.6 Accidents Related to Traffic Volume
In order to find the relationship between accident rate and traffic volume, accident rate was presented in two forms. In one case it is the number of accident that occurred in a road section per kilometre per year and presented as accident per km-year. And in other case, it was the number of accidents that occur in a road section per million vehicles (MV) taken in terms of passenger car unit (PCU) per Kilometre (K) per year (Y), represented as Accident per MVKY. The rate of accidents in terms of accidents per km-year is shown in Fig 4.12.The curve indicate that accident rate per Km-year increases with AADT
and operational environment.
Year
Fig.4.5 Annual variation in accidents of total stretch
5. ACCIDENT INVESTIGATION AND BLACK SPOT ANALYSIS
5.1 Accident Investigation Accident no-1
Accident type: Head-on collision Location: Sheela Nagar
Date and Time: MAR 30, 2013; 4.30PM Vehicle 1: Tata Truck no OR-06/ B-6545
Vehicle 2: Bajaj CT- 100 motor cycle no OR-05/U-3323
Fatalities/Injuries: One person dead and one person severe Injured.
Description: one Bajaj motor cycle with two person collided with a aluminium loaded truck in front of captive power plant Nalco gate around 4.30PM.The motor cycle was coming from captive power plant and truck was moving on highway. The motor cycle rushed to the right side of truck front. The truck applied brake and turned towards left side. The bike fell down under the rear right wheels. The victims were severely injured. The rider lost his right leg completely and left leg scratched while other was under truck with severe knee and head injuries. The rider had used helmet and saved from head injury. The ambulance came after 30 minutes and took victims to the hospital. The victims were two brothers from Jajpur town and rider lost his life after two hour of incident. Cause of accident was due to presence of old banyan tree on the corner of T-junction and ditches of shoulder was filled with water. The motor cycle could not notice the truck due to that big tree and collided with truck on the highway. The tyre skid mark length was 11mt. The accident diagram as shown in fig 5.1
Fig5.1 Accident diagram and photos of stretch I Accident no: 2
Accident type: collision with tree Location: In front of police station Vehicle 1: Ashok Leyland trailer Vehicle 2: Bajaj Auto
Fatalities/Injuries: Two person minor Injured
Description: The trailer was on the highway with normal speed. At a T-junction one auto with nine passengers was changing direction (left turn) from bus stop road to highway .Both vehicles became front to front. The trailer driver applied sudden brake and struke the vehicle with an old tree present at corner of junction. The auto was escaped from collision. Driver and helper became injured. The accident diagram is shown in fig5.2
Fig5.2 Accident diagram and photos of stretch II
6.CONCLUSIONS AND RECOMMENDATIONS 6.1 Conclusion
(1)The available literatures on accident analysis indicate that 77.5 percent of road accidents in India is caused due to driver’s error.
estimated that fatalities caused by truck is 59 % followed by other (26%) and bike (7%) and jeep (5%) and bus (3%).Road safety awareness should be raised among road user.
(3)Stretch IV has the highest no of accidents which accounts for 34.1% of total accidents .The accident rate can be decreased by road side clearance, proper maintenance of shoulders, lighting, and junction improvement. Speed limit should be brought down by providing humps near accident spots. Sight distance near curves should be obstruction free. (4)Stretch I have the second highest no of accidents accounts for 32.5% of total accident. The Accident rate can be reduced by providing signalized junction, junction improvement, and Shoulder Clearance, installation of humps, shifting of poles, removal of trees near the edge of pavement etc. (5)No of accidents in stretch II accounts for 29.6% of total accidents. The accident rate can be Minimized by clearing-off shoulders, reducing speed limit, junction improvement, providing Signals on the median, shifting structures on the shoulder.
(6)Stretch III has minimum no of accidents accounts for 3.7% of total accidents. Speed limit
reduction near junction should be reduced to prevent accidents.
REFERENCES
1.
Global Road Safety Partnership Annual Report (2011)http://www.grsproadsafety.org/sites/grsp.drupalg ardens.com/files
2. Torregrosa et al.,(2012) New geometric design consistency model based on operating speedProfiles for road safety evaluation, Accident Analysis and Prevention Article in pressAAP-2915 pp.1-10 3.Sivakumar, .Krishnaraj(2012),Road Traffic Accidents (RTAs) Due To Drunken Driving InIndia, Challenges In Prevention international journal of research in management andTechnology,ISSN:2249 9563 VOL. 2, pp.401-406
4. Accidental deaths in india(2011), National Crime Records Bureau, Ministry of Home Affairs, Government of India,New Delhi
5. http://en.wikipedia.org/wiki/Haddon_Matrix 6. Bhuyan(2003) Accident Analysis on Two-Lane Road, M-Tech Thesis Indian Institute of Technology Roorkee.
7 Hassan and Aty(2012) Exploring the safety
implications of young drivers attitudesand
perceptions, Accident Analysis and Prevention Vol.43 pp.45-65
8. Cons tantino u etal(2011) Risky and aggressive driving in young adults:Personality Matters, Accident Analysis and Prevention Vol.43 pp.1323-1331 9. Chandraratna et al(2006) Crash involvement of drivers with multiple crashes, Accident Analysis and
Prevention vol. 38 pp.532–541
10. Sagberg and Bjørnskau(2006) Hazard perception and driving experience among novicedrivers, Accident Analysis and Prevention vol.38 pp. 407– 414
11.Derry(2011) The Role of Driving Experience in Hazard and Categorization, Accident Analysis And Prevention Vol.43 pp.1730-1737
12.Sivakumar, .Krishnaraj(2012),Road Traffic Accidents (RTAs) Due To Drunken Driving InIndia, Challenges In Prevention international journal of research in management andTechnology, ISSN:2249-9563 Vol. 2, pp.401-406
13. Vaez,Lafllame(2005).,Impaired driving and motor vehicle crashes among Swedishyouth: An investigation intodrivers’sociodemographic characteristics AccidentAnalysis and Prevention Vol.37, pp.605–611
14. Anne et al.,(2010),The effects of minimu m legal drink ing age 21 laws onalcohol-relate driving in the United States Journal of Safety Rese archVo l.41,pp.173–181
15. Peter andRobert (2009)Alcohol consumption measured at road side survey and variation intraffic injurycrashes,Accident Analysis and Prevention Vol. 30,No. 4, pp. 409–416.
16. Campus et al.,(2011) The effect of the new traffic law on drinking and driving in Sao Paulo,Brazil Accident Analysis and Prevention Vol.50 pp.622
17. Longo et al(1999) The prevalence of alchol, Cannabinoids, benzodiazepines and stimulants amongst
injured drivers and their role in drivers and their role in driver capability , Accident Analysis and
prevention Vol.32 PP.623-632