1556-6811/10/$12.00 doi:10.1128/CVI.00494-09
Copyright © 2010, American Society for Microbiology. All Rights Reserved.
Interactive Changes between Macrophages and Adipocytes
䌤
†
Linglin Xie,
1‡ M. Teresa Ortega,
1‡ Silvia Mora,
2and Stephen K. Chapes
1*
Division of Biology, Kansas State University, Manhattan, Kansas 66506,1and The Physiological Laboratory, School of
Biomedical Sciences, The University of Liverpool, Crown Street, Liverpool L69 3BX, United Kingdom2
Received 4 December 2009/Returned for modification 5 January 2010/Accepted 9 February 2010
Obesity is associated with a proinflammatory state, with macrophage infiltration into adipose tissue. We tested the hypothesis that communication between macrophages and adipocytes affects insulin resistance by disrupting insulin-stimulated glucose transport, adipocyte differentiation, and macrophage function. To test this hypothesis, we cocultured 3T3-L1 adipocytes with C2D macrophages or primary peritoneal mouse mac-rophages and examined the impacts of macmac-rophages and adipocytes on each other. Adipocytes and preadipo-cytes did not affect C2D macrophageTNF-␣,IL-6, orIL-1transcript concentrations relative to those obtained when C2D macrophages were incubated alone. However, preadipocytes and adipocytes increased PEC-C2D macrophageIL-6transcript levels, while preadipocytes inhibitedIL-1transcript levels compared to those obtained when PEC-C2D macrophages were incubated in medium alone. We found that adipocyte coculture increased macrophage consumption of tumor necrosis factor alpha (TNF-␣), interleukin 1(IL-1), and, in some cases, IL-6. C2D macrophages increasingly downregulated GLUT4 transcript levels in differentiated adipocytes. Recombinant TNF-␣, IL-1, and IL-6 also downregulatedGLUT4transcript levels relative to those for the control. However, only IL-6 was inhibitory at concentrations detected in macrophage-adipocyte cocul-tures. IL-6 and TNF-␣, but not IL-1, inhibited Akt phosphorylation within 15 min of insulin stimulation, but only IL-6 was inhibitory 30 min after stimulation. Lastly, we found that adipocyte differentiation was inhibited by macrophages or by recombinant TNF-␣, IL-6, and IL-1, with IL-6 having the most impact. These data suggest that the interaction between macrophages and adipocytes is a complex process, and they support the hypothesis that the macrophage-adipocyte interaction affects insulin resistance by disrupting insulin-stimu-lated glucose transport, adipocyte differentiation, and macrophage function.
Insulin resistance is characterized as an impairment of glu-cose utilization and reduced insulin signaling in peripheral tissues. There appears to be a relationship between inflamma-tion and the development of insulin resistance (26). One hy-pothesis is that inflammation causes “metabolic syndrome,” which is defined as a combination of symptoms associated with insulin resistance and known to precede the onset of type 2 diabetes (18, 24).
Insulin resistance accompanies not only chronic inflamma-tion but also abnormal mediator secreinflamma-tion (42). Adipose tissue is now appreciated as an endocrine organ that secretes hor-mones and cytokines, including inflammatory cytokines, such as tumor necrosis factor alpha (TNF-␣), interleukin-1 (IL-1), and IL-6 (17). The cytokines are associated with increased numbers of adipose tissue macrophages in obese and diabetic patients (41, 46). In fact, macrophage recruitment increases with fat mass (32). Direct or indirect interactions between adipose tissue macrophages and adipocytes may impair insulin action, affect key protein expression, or activate inflammatory pathways. For example, levels of TNF-␣, IL-6, C-reactive pro-tein (CRP), and monocyte chemoattractant propro-tein-1 (MCP-1; also referred to as CCL-2) are elevated in obese and diabetic people (4, 6, 47). In the obese mouse (ob/ob), the absence of TNF-␣ improved insulin sensitivity and glucose homeostasis
(39). The adoptive transfer of bone marrow cells from normal mice into TNF-␣knockout mice reduced the insulin sensitivity of the recipients (9). Therefore, it is clear that TNF-␣has an impact on insulin sensitivity. However, it is not clear if TNF-␣ is the only cytokine that is required for the induction of insulin resistance. IL-6 is overexpressed in adipose tissue of obese and diabetes patients (40). Elevated IL-6 levels correlated with reduced adiponectin concentrations in human adipose tissue and reduced transcription of insulin receptor substrate-1 (IRS-1) and glucose transporter 4 (GLUT4) in 3T3-L1 cells (4, 21, 35). IL-1levels have also been reported to be higher in overweight and obese individuals than in lean individuals (38) and have been shown to cause reduced IRS downregulation in differentiated 3T3-L1 adipocytes (22). Moreover, individuals with a combined increase in IL-1 and IL-6 levels were at greater risk of developing type-2 diabetes than individuals with increased IL-6 levels alone (33).
Collectively, these data suggest that TNF-␣, IL-1, and IL-6 play critical roles in the onset of obesity-related insulin resistance. However, both macrophages and adipocytes pro-duce proinflammatory cytokines. Given that these cytokines synergize and regulate each other (10), there are many un-answered questions about what happens during the adipo-cyte-macrophage interaction and how insulin resistance is induced.
We hypothesized that macrophage-adipocyte communica-tion would affect glucose uptake and the signaling that occurs in response to insulin. To test this hypothesis, we cocultured macrophages and adipocytes, and we examined the impact of the interaction on both cell types.
* Corresponding author. Mailing address: Division of Biology, Kan-sas State University, Manhattan, KS 66506. Phone: (785) 532-6795. Fax: (785) 532-6653. E-mail: [email protected].
† Kansas Agriculture Experiment Station publication 08-175-J. ‡ L.X. and M.T.O. contributed equally to this work.
䌤Published ahead of print on 17 February 2010.
651
on August 17, 2020 by guest
http://cvi.asm.org/
MATERIALS AND METHODS
Antibodies and recombinant cytokines.Mouse recombinant TNF-␣, IL-1, and IL-6 were purchased from R&D Systems (Minneapolis, MN). A rabbit polyclonal antibody against mouse GLUT4 (catalog no. ab654-250) was obtained from Abcam (Cambridge, MA). A rabbit polyclonal antibody against mouse GLUT1 (catalog no. CBL242) was obtained from BD Biosciences (San Jose, CA). A rabbit polyclonal antibody against Akt (catalog no. 9272) and rabbit anti-phospho-Akt (serine 473; catalog no. 9271S) were obtained from Cell Sig-naling (Beverly, MA). Allophycocyanin (APC)-conjugated goat anti-rabbit IgG (catalog no. sc-3846) was purchased from Santa Cruz Biotechnology (Santa Cruz, CA). Alexa Fluor 647-conjugated Mac-2 (catalog no. 51-5301-82) and its isotype Alexa Fluor 647-conjugated IgG2a (catalog no. 51-4321-80), APC-conjugated CD11b (catalog no. 17-0112-82) and its isotype APC-conjugated IgG2b (catalog no. 17-4031-82), and APC-conjugated streptavidin (catalog no. 17-4317-82) were purchased from eBioscience (San Diego, CA). Biotin-conjugated Ly-6C (catalog no. 557359) and biotin-conjugated IgM (catalog no. 559941) were purchased from BD Biosciences. For enzyme-linked immunosorbent assays (ELISA), an anti-TNF-␣ antibody (for capture; catalog no. 551225), a biotinylated anti-TNF-␣antibody (for detection; catalog no. 554415), an anti-IL-6 antibody (for capture; catalog no. 554400), and a biotinylated anti-IL-6 antibody (for detec-tion; catalog no. 554402) were obtained from BD Biosciences (San Jose, CA); an anti-IL-1antibody (for capture; catalog no. MAB401) and a biotinylated anti-IL-1antibody (for detection; catalog no. BAF401) were obtained from R&D Systems (Minneapolis, MN).
Cell culture.3T3-L1 adipocytes were obtained from the American Type Cul-ture Collection (Manassas, VA). Adipocytes were culCul-tured and differentiated as described previously (43, 44). The C2D macrophage cell line was created by our group and was cultured in DMEM2as described previously (3).
Peritoneal macrophages were obtained from C57BL/6J (B6) mice by perito-neal lavage 4 days after intraperitoperito-neal injection of 1.5 ml of 4% thioglycolate. Macrophages were incubated in ammonium chloride lysis buffer (0.15 M NH4Cl, 10 mM KHCO3, 0.1 mM disodium EDTA [pH 7.3]) for 5 min on ice to lyse contaminating red blood cells. Cells were washed three times with phosphate-buffered saline (PBS) (137 mM NaCl, 10 mM phosphate, 2.7 mM KCl [pH 7.4]). Indirect (transwell) coculture was performed by incubating peritoneal macro-phages (1⫻106cells) or C2D macrophages (1⫻105cells) in 0.4-m-pore-size cell culture inserts (BD Bioscience) and placing them in 6-well plates containing 3T3-L1 adipocytes differentiated for 8 days (1⫻106
cells). Cocultures were incubated for 4 days. Direct coculture was performed by directly adding perito-neal macrophages (1⫻106viable cells; trypan blue exclusion) or C2D macro-phages (1⫻105
viable cells; trypan blue exclusion) to the 6-well plates containing undifferentiated 3T3-L1 adipocytes (1⫻106cells). Fewer C2D macrophages were added, because they continue to proliferate (cell cycle time [T1/2],⬇24 h) (3), while peritoneal macrophages do not. Macrophages did not appear apoptotic or necrotic after the 4-day incubation period, as assessed by light microscopic examination.
Adoptive transfer of labeled cells.C2D cells were suspended in sterile, pre-warmed (37°C) PBS at a concentration of 1.5⫻106per ml. Cells were stained with carboxyfluorescein diacetate succinimidyl ester (CFDA-SE) according to the manufacturer’s protocol (28, 29). Briefly, C2D cells were incubated with 22
M CFDA-SE solution at 37°C for 15 min. After centrifugation at 370⫻gfor 10 min, cell pellets were suspended in prewarmed PBS and incubated at 37°C for an additional 20 min. Cells were then washed twice in PBS and were suspended at a concentration of 3⫻107/ml in PBS. One and one-half milliliters of the suspension of CFDA-SE-labeled C2D cells or normal C2D cells was injected intraperitoneally (i.p.) per mouse.
Quantitative RT-PCR analysis.One-step quantitative reverse transcription-PCR (qRT-PCR) was performed using the SuperScript III Platinum SYBR green kit (Invitrogen, Carlsbad, CA) according to the manufacturer’s protocol. Primers were designed with PrimerQuest software (Integrated DNA Technologies) using sequence data from the NCBI sequence database, as follows: for ACDC (NM_AB008453), primers 5⬘-AGACCTGGCCACTTTCTCCTCATT (forward) and 5⬘-AGAGGAACAGGAGAGCTTGCAACA (reverse); for GLUT1, 5⬘-TCA ACGAGCATCTTCGAGAAGGCA (forward) and 5⬘-TCGTCCAGCTCGCTCT ACAACAAA (reverse); for GLUT4, 5⬘-TTCACGTTGGTCTCGGTGCTCTTA (forward) and 5⬘-CCACAAAGCCAAATATGGCCACGA (reverse); forTNF-␣ (NM_013693), 5⬘-TCTCATGCACCACCATCAAGGACT (forward) and 5⬘-TGA CCACTCTCCCTTTGCAGAACT (reverse); forIL-6(NM_031168.1), 5⬘-TCTCA TGCACCACCATCAAGGACT (forward) and 5⬘-TGACCACTCTCCCTTTGCA GAACT (reverse); forIL-1(NM_008361), 5⬘-AAGGGCTGCTTCCAAACCTT TGAC (forward) and 5⬘-ATACTGCCTGCCTGAAGCTCTTGT (reverse); for Arg-1(NM_007482), 5⬘-TGGCTTTAACCTTGGCTTGCTTCG (forward) and 5⬘
-CATGTGGCGCATTCACAGTCACTT (reverse); forYm-1(M94584), 5⬘-CACC ATGGCCAAGCTCATTCTTGT (forward) and 5⬘-TATTGGCCTGTCCTTAGC CCAACT (reverse); forFizz-1(NM_020509.3), 5⬘-ACTGCCTGTGCTTACTCGT TGACT (forward) and 5⬘-AAAGCTGGGTTCTCCACCTCTTCA (reverse); and for-actin(NM_007393), 5⬘-TGTGATGGTGGGAATGGGTCAGAA (forward) and 5⬘-TGTGGTGCCAGATCTTCTCCATGT (reverse). The qRT-PCRs were performed in a SmartCycler system (Cepheid, Sunnyvale, CA). The fold increase in transcript expression was calculated as [E(gene of interest)⌬CT target]/ [E(housekeeping)⌬CThousekeeping
], whereE(efficiency) is equal to 10(⫺1/slope) , as described previously by Pfaffl (27).
Flow cytometry analysis.Cells were detached with a 0.02% EDTA-PBS solu-tion, transferred to the wells of 96-well round-bottom plates, and blocked with PBS-goat serum (at 50% each; 50l) at 4°C for 0.5 h. Blocked cells were incubated with the specific antibody or isotype control diluted in Hanks buffered salt solution (HBSS) (0.137 M NaCl, 5.4 mM KCl, 0.25 mM Na2HPO4,0.44 mM KH2PO4,1.3 mM CaCl2,1.0 mM MgSO4, 4.2 mM NaHCO3) for 1 h in the dark at 4°C. After two washes with HBSS, cells were fixed in 1% formalin. For indirect labeling, blocked cells were incubated for 1 h with a primary antibody or isotype control antibody diluted in HBSS at a total volume of 50l. Incubation contin-ued in the dark for 1 h at 4°C. Thereafter, cells were washed twice with HBSS. Secondary antibodies diluted in HBSS for a 50-l final volume were added to the cells and incubated for 40 min in the dark at 4°C. Cells were washed twice with HBSS and then fixed in 1% formalin. Labeled cell surface proteins were assessed by flow cytometry.
For the analysis of the intracellular molecules, cells were first fixed in 2% paraformaldehyde for 20 min at 37°C. Cells were then permeabilized by incuba-tion in 90% ice-cold methanol for 30 min. The cells were washed twice in PBS and were then blocked and probed with antibody as described above. Samples were analyzed using a FACSCalibur analytical flow cytometer (Becton Dick-inson, San Jose, CA); 5,000 to 10,000 events were measured for each sample. Data analysis was performed with Winlist software (Verity Software House, Topsham, ME).
Cytokine detection.Granulocyte-macrophage colony-stimulating factor (GM-CSF), gamma interferon (IFN-␥), IL-1␣, IL-2, IL-4, IL-5, IL-6, IL-10, IL-17, and TNF-␣were detected in cell culture supernatants using a mouse Th1/Th2 10-plex FlowCytomix multiplex kit, purchased from Bender Medsystems (Burlingame, CA), according to the manufacturer’s instructions.
TNF-␣, IL-1, and IL-6 in cell culture supernatants were also measured by ELISA (7). Briefly, the ELISA plates were coated with capture antibodies over-night at room temperature. After 1 h of blocking, samples were added to each well and were incubated at room temperature for 2 h. Wells were washed three times with PBS supplemented with 0.5% Tween 20 (PBST). Biotin-conjugated detection antibodies were added and incubated at room temperature for 2 h. Horseradish peroxidase (HRP)-conjugated streptavidin was then added and in-cubated at room temperature for 30 min. After three washes, the substrate was added to the wells. Within 30 min, the reaction was stopped by the addition of 50l of 1 N H2SO4, and absorbance was assessed using a Bio-Rad microplate reader, model 680 (Bio-Rad Laboratories, Inc., Hercules, CA) at 450 nm.
Assessment of 3T3-L1 adipocyte differentiation.3T3-L1 fibroblasts were in-duced to differentiate for 4 days as described previously (43). On day 4, perito-neal macrophages were either plated onto the insert of the transwell or added directly to the 3T3-L1 cells for 4 days. In the cytokine impact studies, TNF-␣, IL-6, or IL-1was added to the 3T3-L1 cells for 4 days. On day 8, adipocytes were fixed on the plate with 2% paraformaldehyde at 4°C for 15 min. The cells were washed twice with PBS and were stained with Sudan IV-saturated 70% isopropanol for 15 min. Cells were then washed twice with 50% isopropanol. Cells were mounted directly onto the plate using several drops of glycerol, viewed under a light microscope, and photographed. To measure the differentiation based on the amount of lipid present in the cells, absorbance was read at 550 nm using a Packard SpectraCount spectrophotometer (Packard Instrument Com-pany, Meriden, CT).
Statistical analysis.Differences in means were determined using Student’st test (paired, two-tailed). All tests were calculated using the StatMost statistical package (Dat@xiom Software, Los Angeles, CA). Differences were considered significantly different whenPwas⬍0.05.
RESULTS
Reduced levels ofGLUT4transcripts in 3T3-L1 adipocytes cocultured with macrophages. We observed higher levels of
GLUT1transcripts in 3T3-L1 adipocytes cocultured with
peri-toneal macrophages than in adipocytes cultured alone,
on August 17, 2020 by guest
http://cvi.asm.org/
less of the differentiation stage examined (Table 1). However, the most pronounced increase occurred in the early differen-tiated cells (days 0 to 4). Adiponectin transcript levels were unchanged from those in adipocytes incubated alone at days 0 to 4 of coculture with macrophages, but transcript levels de-creased significantly at days 4 to 8 and 8 to 12 of coculture with macrophages.GLUT4gene transcript levels were reduced at days 4 to 8 and 8 to 12 of culture with peritoneal macrophages. Therefore, macrophages had a differential impact onGLUT1,
GLUT4, andACDCtranscript levels as 3T3-L1 cells underwent
differentiation.
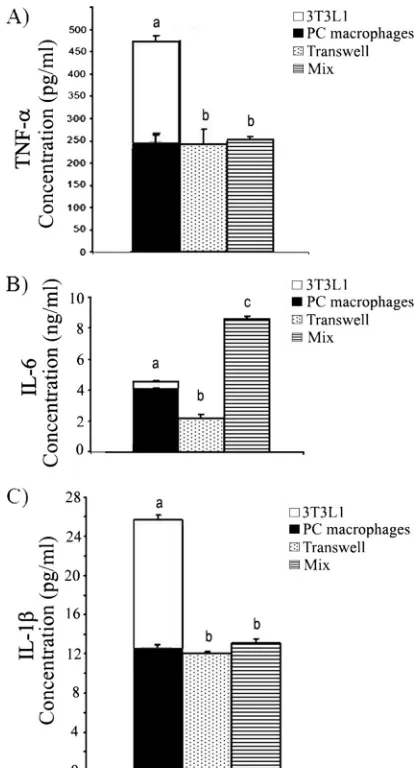
Cytokine secretion in 3T3-L1 adipocyte–macrophage cocul-tures was altered.The differential impact of peritoneal mac-rophages on 3T3-L1 adipocytes cocultured separately in trans-well cultures is consistent with previous observations that cytokines played a role in the adipocyte-macrophage interac-tion (18, 33). Therefore, we assessed an array of cytokines, including IFN-␥, IL-1␣, IL-2, IL-4, IL-5, IL-10, IL-17, and GM-CSF (data not shown), along with IL-1, TNF-␣, and IL-6, for changes during macrophage-adipocyte coculture. Only IL-1, TNF-␣, and IL-6 secretion was altered in the adipocyte-macrophage cocultures when we assessed these cy-tokines in the supernatants either by array or by ELISA. Both B6 peritoneal macrophages and 3T3-L1 adipocytes secreted TNF-␣, IL-1, and IL-6 (Fig. 1). For this reason, we compared the secretion of the cytokines in supernatants from cocultures to the sum of the secretions by 3T3-L1 cells and macrophages when they were cultured alone (bars stacked together in Fig. 1). We found that the concentrations of TNF-␣(Fig. 1A) and IL-1(Fig. 1C) in both direct (cells incubated together [mix]) and indirect (transwell) cocultures were significantly lower than the sum of the levels secreted by adipocytes and macro-phages cultured alone. The levels of TNF-␣and IL-1in direct versus indirect cocultures did not differ. However, the amounts of IL-6 detected in direct coculture were different from those in transwell culture. The level of IL-6 detected in direct cocul-ture was higher than the sum of the levels of IL-6 detected in adipocytes and macrophages cultured alone, whereas the IL-6 level in transwell culture was significantly lower than that sum (Fig. 1B).
Effects of 3T3-L1 adipocyte differentiation and macrophage maturity on cytokine expression.TNF-␣has been reported to be the major mediator in the induction of the “inflammatory fire” of the adipose tissue environment (16, 26). However, our data (Fig. 1) suggested that IL-6 production may be regulated differently from TNF-␣ production. Since the adipose tissue environment is a mixture of both mature and immature adipo-cytes as well as both mature and immature macrophages, we tested the hypothesis that preadipocytes and adipocytes will differentially regulate immature and mature macrophages and
FIG. 1. Secretion of TNF-␣, IL-6, and IL-1in macrophage and 3T3-L1 adipocyte cocultures. 3T3-L1 adipocytes and peritoneal (PC) macrophages were either incubated alone, coincubated directly (mix), or coincubated but separated in transwell plates for 4 days (from day 8 to day 12 in adipocyte medium). Cell-free supernatants were col-lected, and cytokine concentrations were determined by ELISA. (A) TNF-␣; (B) IL-6; (C) IL-1. The levels of each cytokine in super-natants from cocultures were compared to the sum of the amounts of that cytokine secreted by 3T3-L1 cells and macrophages when they were cultured alone. For this purpose, the bars for 3T3-L1 adipocytes and macrophages are stacked together. The data are presented as means⫾standard errors of the means for 3 to 6 independent repli-cates per treatment. Different letters indicate a significant difference. APvalue of⬍0.05 was considered significant.
TABLE 1. Influence of peritoneal macrophages on the levels of adiponectin (ACDC),GLUT1, andGLUT4
transcripts in 3T3-L1 adipocytesa
Transcript
Gene transcript level in 3T3-L1 cells cocultured with macrophagesb
Days 0–4 Days 4–8 Days 8–12
ACDC 127⫾12 57⫾9* 83⫾6*
GLUT1 9,071⫾811* 2,261⫾340* 431⫾136*
GLUT4 88⫾1* 59⫾17 43⫾2*
a3T3-L1 adipocytes were cultured in the bottoms of transwell plates, and peritoneal macrophages were cultured in the top chambers. Total RNA was extracted from 3T3-L1 adipocytes, and mRNA levels were analyzed by qRT-PCR as described in Materials and Methods.
bExpressed as a percentage of the level in 3T3-L1 cells differentiatedin vitro, set at 100%, using the method of Pfaffl (27). Each value is the mean⫾standard error of the mean for three independent experiments. An asterisk indicates a significant difference (P⬍0.05 by thettest) from the level in control 3T3-L1 adipocytes.
on August 17, 2020 by guest
http://cvi.asm.org/
the cytokines produced. To test this hypothesis, we performed the experiment with the C2D macrophage line (3, 28, 29). C2D macrophages have an early macrophage lineage phenotype when grownin vitro. They do not secrete TNF-␣or IL-1in
vitro, and they express a phenotype characteristic of
more-differentiated macrophages only after they are adoptively transferred to the peritoneal cavity (PEC-C2D) (28, 29). This phenotype is accompanied by increased cytokine transcription/ secretion. Therefore, this model system allowed us to compare the impact of preadipocytes or adipocytes on cytokine tran-script levels in both early differentiated and late differentiated macrophages. C2D macrophages were labeled with CFDA-SE so that they could be purified by fluorescence-activated cell sorting after being injectedin vivoand after they were cultured with adipocytes or preadipocytes for 2 days.
Cytokine gene transcripts were detected by qRT-PCR (Ta-ble 2). We observed low levels of TNF-␣, IL-1, and IL-6
transcripts in C2D cells incubated with adipocytes or preadi-pocytes. These data suggest that adipocytes or preadipocytes have no physiological impact on C2D macrophages, since C2D macrophage controls incubated in medium alone normally have low transcription of these cytokines. However, we found higherIL-6transcript levels in PEC-C2D macrophages incu-bated with either adipocytes or preadipocytes than in PEC-C2D macrophages incubated alone. IL-1 transcript levels were significantly lower in PEC-C2D macrophages incubated with preadipocytes. Therefore, macrophage cytokine transcript regulation was dependent on macrophage differentiation, and adipocyte differentiation had some impact.
Effects of 3T3-L1 adipocyte differentiation on macrophage phenotype. C2D macrophages cultured in vitro express low levels of Mac-2 and Ly-6C, and almost no CD11b, indicative of an immature macrophage phenotype (28, 29). We observed no changes in any of the three cell surface markers on C2D mac-rophages cocultured with preadipocytes (Fig. 2A) from those on C2D macrophages cultured alone. However, we observed a small but significant (P,⬍0.05) increase in CD11b expression
and a significant decrease in Ly-6C expression on C2D mac-rophages cocultured with adipocytes (Fig. 2A).
When we cocultured PEC-C2D macrophages with adipo-cytes or preadipoadipo-cytes and measured the expression of macro-phage markers, we found that adipocytes induced significantly more Mac-2 expression on PEC-C2D macrophages than that found on PEC-C2D macrophages incubated alone or with preadipocytesin vitro(Fig. 2B). We observed small but signif-icant decreases in CD11b and Mac-2 levels in macrophages cocultured with preadipocytes from the levels in PEC-C2D macrophages incubated in medium alone (Fig. 2B). These data suggest that adipocytes alter the C2D macrophage phenotype differently from preadipocytes and that the differentiation state of the macrophage was important.
TNF-␣, IL-1, and IL-6 decrease GLUT4 transcript and protein levels in adipocytes.Coculture of adipocytes and mac-rophages increased IL-6and IL-1 transcript levels in PEC-C2D macrophages (Table 2). To assess the relative importance of these cytokines in glucose resistance, we examined the ef-fects of recombinant TNF-␣, IL-1, and IL-6 onGLUT4gene transcription in adipocytes. We treated fully differentiated adi-pocytes with TNF-␣ (2 ng/ml), IL-1(20 ng/ml), or IL-6 (10 ng/ml) for 48 h and subsequently measured the ACDC,
GLUT1, andGLUT4mRNA levels by qRT-PCR. We found
that TNF-␣did not significantly affectACDCorGLUT1 tran-script levels (Table 3). IL-6 also did not significantly influence
FIG. 2. Percentage of CFDA-SE-positive C2D cells testing positive for a given marker. (A) CFDA-SE-labeled C2D macrophages grownin vitrowere either cultured alone or cocultured with adipocytes or with preadipocytes. (B) CFDA-SE-labeled C2D macrophages were adop-tively transferred to the peritoneal cavity for 24 h. After peritoneal cavity isolation, PEC-C2D macrophages were either cultured alone or cocultured with 3T3-L1 adipocytes or preadipocytes. Cell mixtures were dispersed with 0.025% EDTA and were resuspended in HBSS buffer. Cells were immunostained for flow cytometry as described in Materials and Methods. The data are presented as means⫾standard errors of the means for 3 independent replicates per treatment. Dif-ferent letters indicate a significant difference. APvalue of⬍0.05 was considered significant.
TABLE 2. Influence of adipocytes or preadipocytes on cytokine transcript levels in macrophagesa
Transcript
Gene transcript levelb
in macrophages cocultured with adipocytes or preadipocytesc
C2D⫹A C2D⫹P PEC-C2D⫹A
PEC-C2D⫹P
TNF-␣ Unchanged Unchanged 96⫾25 119⫾28
IL-1 Unchanged Unchanged 196⫾59 25⫾3*
IL-6 Unchanged Unchanged 147⫾15* 276⫾68*
a
C2D or PEC-C2D macrophages were incubated in the top well of a transwell plate, and adipocytes or preadipocytes were cultured in the bottom chamber. Total RNA was extracted from C2D or PEC-C2D macrophages, and mRNA levels were analyzed by qRT-PCR as described in Materials and Methods.
b
Expressed as a percentage of the level in C2D macrophages grownin vitroor in PEC-C2D macrophages (C2D macrophages collected after peritoneal cavity lavage), set at 100%, using the method of Pfaffl (27). Each value is the mean⫾ standard error of the mean for three independent experiments. An asterisk indicates a significant difference (P⬍0.05 by thettest) from the level in control C2D or PEC-C2D cells.
c
C2D⫹A, C2D cells cocultured with adipocytes; C2D⫹P, C2D cells cocul-tured with preadipocytes; PEC-C2D⫹A, PEC-C2D macrophages cocultured with adipocytes; PEC-C2D⫹P, PEC-C2D macrophages cocultured with preadipo-cytes.
on August 17, 2020 by guest
http://cvi.asm.org/
GLUT1mRNA levels. However,GLUT4transcript levels were significantly reduced by TNF-␣, IL-6, and IL-1from levels in untreated 3T3-L1 controls (Table 3). When we assessed the action of TNF-␣, IL-1, and IL-6 on 3T3-L1 GLUT4 and GLUT1 protein expression using flow cytometry in permeab-ilized adipocytes, we found that each of the three cytokines (TNF-␣, IL-1, or IL-6) significantly decreased total GLUT4 protein levels (Fig. 3A) but not GLUT1 protein levels (Fig. 3B).
TNF-␣, IL-6, and IL-1affect Akt phosphorylation differ-ently. GLUT4 translocation is triggered by insulin through phosphoinositide 3-kinase (PI3K) activation, leading to phos-phorylation of the Akt protein within 15 min after insulin treatment (11). Therefore, we evaluated the relative impor-tance of TNF-␣, IL-1, and IL-6 for Akt phosphorylation in adipocytes by using flow cytometry. None of the cytokine
treat-ments altered total cellular Akt protein levels (Fig. 4A). How-ever, when we measured the level of phosphorylation of Akt at Ser473 at 0, 5, 10, 15, and 30 min following insulin stimulation, we observed that phosphorylation peaked at 15 min after the insulin treatment and that by 30 min, Ser473-Akt phos-phorylation was diminished (Fig. 4B). Adipocytes treated with IL-1showed a time-dependent phosphorylation pattern sim-ilar to that seen for control adipocytes (Fig. 4B). In contrast, Ser473-Akt phosphorylation remained at baseline levels in adi-pocytes treated with IL-6 (Fig. 4B), with almost 100% inhibi-tion. Unlike IL-6, TNF-␣ did not completely block insulin signaling. It delayed the phosphorylation of Akt for approxi-mately 10 min.
⌻o confirm that TNF-␣inhibited the phosphorylation of Akt
TABLE 3. Influence of cytokines on the regulation of the ACDC, GLUT1, and GLUT4 genes in 3T3-L1 adipocytesa
Transcript
Gene transcript levelb
in 3T3-L1 adipocytes cultured with:
TNF-␣ IL-6 IL-1
ACDC 69⫾22 55⫾14* 53⫾4*
GLUT1 77⫾20 84⫾20 61⫾7*
GLUT4 36⫾6* 15⫾5* 9⫾1*
a
Fully differentiated 3T3-L1 adipocytes were cultured with recombinant mouse TNF-␣(2 ng/ml), IL-6 (10 ng/ml), or IL-1(20 ng/ml) for 2 days. Total RNA was extracted from 3T3-L1 adipocytes, and mRNA levels were analyzed by qRT-PCR as described in Materials and Methods.
b
Expressed as a percentage of the level in 3T3-L1 cells differentiatedin vitro, set at 100%. Each value is the mean⫾standard error of the mean for three independent experiments. An asterisk indicates a significant difference (P⬍0.05 by thettest) from the gene transcript level in control 3T3-L1 adipocytes.
FIG. 3. Effects of recombinant TNF-␣, IL-6, and IL-1on GLUT4 protein expression. Fully differentiated adipocytes were incubated in medium containing recombinant mouse TNF-␣(2 ng/ml), IL-6 (10 ng/ml), or IL-1(20 ng/ml) for 2 days. Cells were fixed and immuno-stained for GLUT1 or GLUT4 expression using flow cytometry as described in Materials and Methods. The data are presented as means⫾standard errors of the means for 3 to 6 independent repli-cates per treatment. Different letters indicate a significant difference. AP-value of⬍0.05 was considered significant.
FIG. 4. TNF-␣, IL-6, and IL-1affect Akt phosphorylation differ-ently. Fully differentiated adipocytes were incubated with or without (control) recombinant mouse TNF-␣, IL-6, or IL-1 for 2 days. (A) Total Akt protein levels were detected after treatment with cyto-kines. Values were normalized to control values, set at 1. (B) Cells were serum starved for 2 h, stimulated with insulin (100 nM) for 20 min, fixed, and assessed for Akt and phosphorylated Akt (p-Akt) by flow cytometry as described in Materials and Methods. p-Akt was detected at 0, 5, 10, 15, or 30 min after insulin stimulation. (C) Fully differentiated adipocytes were incubated in DMEM with 10% fetal bovine serum containing different levels of TNF-␣, IL-6, or IL-1for 2 days. Cells were serum starved for 2 h, stimulated with insulin (100 nM) for 20 min, fixed, and assessed for Akt and p-Akt by flow cytom-etry. p-Akt was detected at 15 min after insulin stimulation. The data are presented as means⫾standard errors of the means for 3 to 6 independent replicates per treatment. An asterisk identifies a signifi-cant difference between the control (no cytokine treatment) and the treatment at each time point. A P value of ⬍0.05 was considered significant.
on August 17, 2020 by guest
http://cvi.asm.org/
for 15 min after insulin stimulation; we treated cells with dif-ferent concentrations of IL-6 or TNF-␣ for 48 h. Then we stimulated the cells with insulin for 15 min and determined the level of phosphorylation of Akt at Ser473. There was a dose-dependent inhibition of Akt phosphorylation by IL-6 or TNF-␣ (Fig. 4C).
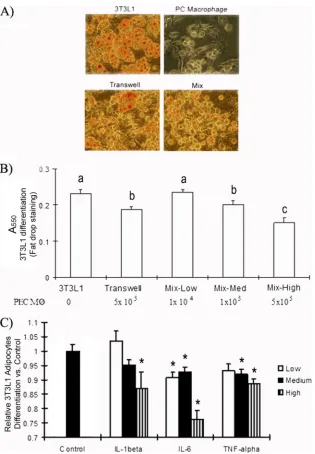
TNF-␣, IL-6, and IL-1inhibit 3T3-L1 differentiation. Pre-adipocytes accumulate less fat and have reduced gene expres-sion of adipogenic and lipogenic markers when the cells are induced to differentiate in the presence of a macrophage-con-ditioned medium (20). Therefore, we hypothesized that the direct inhibitory impact of macrophages onGLUT4 transcrip-tion and Akt phosphorylatranscrip-tion would be exacerbated if macro-phages also inhibited adipocyte differentiation. To test this possibility, we used Sudan IV staining to assess intracellular lipid content. 3T3-L1 cells synthesize increased amounts of lipids as they differentiate, resulting in an increase in the size of the intracellular lipid pool (13). We observed less Sudan IV staining of 3T3-L1 cells cocultured with thioglycolate-elicited peritoneal macrophages than of controls, regardless of whether the macrophages and adipocytes were separated in transwells or were mixed together (Fig. 5A and B). We found a macrophage number-dependent inhibition of 3T3-L1 adipo-cyte differentiation (Fig. 5B). It is possible that the impact of the macrophages was not only direct (i.e., due to contact with cytokines) but was also due to the low availability of nutrients to the adipocytes because of increased numbers of macro-phages in the culture. Therefore, we also assessed the effects of TNF-␣, IL-6, and IL-1on 3T3-L1 differentiation. Adipocytes were incubated with varying concentrations of cytokines, rang-ing from 0.5 to 2 ng/ml of TNF-␣, 1 to 20 ng/ml of IL-1-, and 1 to 10 ng/ml of IL-6, for 4 days. The adipocytes were then assessed for differentiation using Sudan red. Ten nanograms of IL-6 per milliliter had the most pronounced inhibitory effect on differentiation, causing a 24% decrease in lipid accumulation. Lower concentrations of IL-6 had a modest inhibitory effect. Only 20 ng/ml of IL-1was significantly inhibitory, reducing lipid accumulation by 17% (P,⬍0.05). Two concentrations of TNF-␣were inhibitory (P,⬍0.05), but they reduced differen-tiation by only 10% (⬎2 ng/ml). These data support the hy-pothesis that TNF-␣, IL-6, and IL-1can also affect glucose transport by interfering with 3T3-L1 adipocyte differentiation.
DISCUSSION
This is a unique study, because it addresses how phage-adipocyte interactions progressively affect both macro-phage and adipocyte function, a situation that very likely oc-curs as obesity develops in more than 1 billion adults worldwide (15). For example, the depression of fully differen-tiated adipocyteGLUT4transcript levels in 3T3-L1 adipocytes by macrophages (Table 1) and macrophage cytokines (Table 3) and the observations that macrophageIL-1 and IL-6 tran-script levels (Table 2) and cell membrane marker levels (Fig. 2) were altered by coculture with preadipocytes or adipocytes reaffirm the complex interaction that occurs between the two cell types (36). This complex interaction is also evidenced by data showing that direct contact between macrophages and adipocytes also affects cell responses independently of cyto-kines (e.g., IL-6 secretion [Fig. 1]).
Lumeng et al. reported moderately but significantly en-hanced TNF secretion in macrophage-adipocyte cocultures over the level secreted by macrophages alone (24). Adipocytes also secrete TNF-␣, IL-6, and IL-1␣ (16). Therefore, we ac-counted for the cytokines that were made by both the adipo-cytes and the macrophages. Indeed, when those concentrations are accounted for, except for IL-6 in direct cocultures of mac-rophages and adipocytes, the amounts of secreted TNF-␣, IL-6, and IL-1 were significantly less than what macrophages and adipocytes made independently (Fig. 1). These data sug-gest that the cytokines either were metabolized, were posttran-scriptionally downregulated because of paracrine, autocrine, and cell-cell interactions, or were degraded. It has been re-ported that cytokine concentrations are lower in cocultures because secretion of adiponectin by adipocytes suppresses TNF-␣ and IL-6 production (2). The concentration of adi-ponectin detected in our macrophage-adipocyte cocultures was much lower than the reportedin vitroinhibitory concentration (1.2 mg/ml versus 30 mg/ml). Therefore, it is unlikely that adiponectin had inhibited IL-6 and TNF-␣expression. We also found increased numbers of macrophageIL-6transcripts when preadipocytes or adipocytes and differentiated C2D macro-phages were cocultured (Table 2). Although transcription does not always translate into protein production (12), it would appear that increased use, metabolism, or posttranscriptional regulation most likely changed the cytokine concentrations detected in the cells in the coculture.
Our data support previous findings that TNF-␣, IL-6, and IL-1contribute to insulin resistance by inhibiting the expres-sion of GLUT4 in 3T3-L1 adipocytes (Table 3 and Fig. 3). Although it is accepted that TNF-␣ affects GLUT4 protein synthesis (24) and GLUT4 gene transcription (34) through various signal transduction pathways (14, 23, 25), the role of IL-6 in the induction of insulin resistance is controversial. Some have demonstrated that IL-6 promoted insulin resistance by decreasing the expression of IRS-1 and GLUT4 (21, 30), while others have reported that IL-6 enhanced glucose trans-port in 3T3-L1 adipocytes (35). Carey et al. showed that treat-ment with IL-6 for 120 min increased fatty acid oxidation, basal and insulin-stimulated glucose uptake, and translocation of GLUT4 to the plasma membrane in L6 myotubes (5). Our data suggest that IL-6 may be just as important as TNF-␣, or more important, since it completely inhibited Akt phosphorylation 30 min after insulin stimulation (Fig. 4). It is possible that shorter treatments or different IL-6 concentrations may have different impacts. However, IL-6 also contributed to insulin resistance by inhibiting the expression of GLUT4 in 3T3-L1 adipocytes (Table 3 and Fig. 3).
IL-1 also lowered the number ofGLUT4 transcripts and the amount of GLUT4 protein in 3T3-L1 adipocytes. Interest-ingly, whereas TNF-␣ and IL-6 treatments were effective at cytokine concentrations in ranges close to those found in our macrophage-adipocyte cocultures (e.g., for IL-6, 8 ng/ml was detected, and 10 ng/ml was needed for activation; for TNF-␣, 250 pg/ml was detected, and 2 ng/ml was needed for activa-tion), we had to use extremely high concentrations of recom-binant IL-1(20 ng/ml was needed for activation compared to 10 pg/ml detected in cocultures) to see an effect. Jager et al. (19) also found that 20 ng/ml of IL-1inhibited insulin-stim-ulated GLUT4 but not GLUT1 function in adipocytes.
on August 17, 2020 by guest
http://cvi.asm.org/
fore, it is clear that high concentrations of IL-1can be inhib-itory. Others have reported that treating adipocytes chronically with IL-1 (e.g., 6 to 10 days) inhibited signal transduction important to glucose transport (IRS-1, Akt, and Erk 1/2) in both human and mouse adipocytes (22). However, we did not see an effect of IL-1on Akt phosphorylation within 30 min of insulin stimulation. IL-1may function more effectively when it works in conjunction with IL-6 and TNF-␣. However,
com-binations of IL-1(1 and 20 ng/ml), TNF-␣(0.5 and 2 ng/ml), and IL-6 (2 and 10 ng/ml) did not have additive effects on the inhibition of 3T3-L1 adipocyte differentiation compared to the impact of TNF-␣or IL-6 alone (data not shown). Therefore, the role of IL-1may be peripheral to that of the other two major proinflammatory cytokines.
Macrophages not only downregulated the number of
GLUT4transcripts; they also inhibited the differentiation of
FIG. 5. Effects of TNF-␣, IL-6, and IL-1on 3T3-L1 adipocyte differentiation. 3T3-L1 cells were differentiated for 4 days with thioglycolate-elicited peritoneal macrophages in direct coculture or in transwells. Cells were fixed and stained with Sudan IV dye as described in Materials and Methods. (A) Cells were imaged at⫻200 magnification under a light microscope. “Mix” stands for direct coculture. (B) The lipid concentration was determined by measuring the absorbance at 550 nm. The number of PEC-C2D macrophages (M) in each direct coculture is given at the bottom. Different letters indicate a significant difference. (C) 3T3-L1 cells were differentiated for 4 days and were then treated with TNF-␣, IL-6, or IL-1for an additional 4 days. High, medium, and low concentrations of the cytokines were as follows: 2, 1, and 0.5 ng/ml for TNF-␣; 20, 10, and 1 ng/ml for IL-1; and 10, 5, and 2 ng/ml for IL-6. At day 8, cells were fixed and stained with Sudan IV. Differentiation was determined by measuring the absorbance at 550 nm. The data are presented as means⫾standard errors of the means for 3 to 6 independent replicates per treatment. An asterisk identifies a significant difference between the control and the treatment at each time point. AP value of⬍0.05 was considered significant.
on August 17, 2020 by guest
http://cvi.asm.org/
adipocytes by secreting cytokines (Fig. 5).⌱t is now recognized that the stromal-vascular compartment of adipose tissue con-tains various precursor and stem cells, which populate different cell lineagesin vivoandin vitro(1). Among the stromal cells, there are preadipocytes that differentiate into adipocytes (1). Weisberg et al. (41) and Xu et al. (46) reported that inflam-matory macrophages accumulated around small adipocytes and could promote apoptosis. Constant et al. reported that macrophage-conditioned medium inhibited the differentiation of 3T3-L1 and human abdominal preadipocytes (8). We con-firmed that IL-1and TNF-␣inhibited adipogenesis directly (31, 37). This inhibition probably was caused by suppression of PPAR-␥and NF-B (45). However, we did not test that hy-pothesis directly. It is interesting that fully differentiated adi-pocytes promoted the upregulation of Mac-2 on PEC-C2D macrophages (Fig. 2). However, we found that PEC-C2D mac-rophages downregulated both CD11b and Mac-2 when cocul-tured with preadipocytesin vitro(Fig. 2B). Therefore, not only is adipogenesis inhibited by the presence of macrophages (20), but macrophage activation/differentiation was also inhibited or activated depending on whether macrophages were interacting with preadipocytes or with adipocytes.
In summary, our data support the hypothesis that commu-nication between macrophages and adipocytes promotes the onset of insulin resistance. Adipocytes signal increased produc-tion of macrophage proinflammatory cytokines. On the other hand, macrophages induce insulin resistance in adipocytes by secreting a proinflammatory cocktail that can affect insulin action by downregulatingGLUT4and by inhibiting adipocyte differentiation, which further lowersGLUT4levels. Whereas others have suggested that TNF-␣plays a leading role in this process (24, 31), our data suggest that IL-6 may be a more potent contributor under some circumstances. IL-6 was the only cytokine whose levels were increased in peritoneal (PC) macrophage-adipocyte cocultures (Fig. 1). IL-6 was the only cytokine to completely inhibit Akt phosphorylation (Fig. 4). It also had the most significant impact on adipocyte differentia-tion (Fig. 5). This suggesdifferentia-tion does not imply that IL-1and TNF-␣do not affect adipocytes. Indeed, all these proinflam-matory cytokines impaired adipocyte function in ways that would have contributed to the development of insulin resis-tance. We suggest that IL-1and TNF-␣acted in synergy with IL-6. Therefore, the onset of insulin resistance presents an interesting challenge because of the multifactorial impact of numerous cytokines and diverse differentiation stages of cells in the adipose tissue in the adipocyte-macrophage interaction.
ACKNOWLEDGMENTS
We thank Tammy Koopman for assistance with flow cytometry. We thank Betsey Potts and Alison Luce-Fedrow for laboratory assistance with these studies.
This project has been supported in part by American Heart Asso-ciation grant 0950036G; NIH grants AI55052, AI052206, RR16475, RR17686, and RR17708; NASA grant NNX08BA91G; and funding from Diabetes UK, the Wellcome Trust, the European Commission (grant HEALTH-F4-2008-223450), the Kansas Agriculture Experi-ment station, and the Terry C. Johnson Center for Basic Cancer Research.
REFERENCES
1.Ailhaud, G.2006. Adipose tissue as a secretory organ: from adipogenesis to the metabolic syndrome. C. R. Biol.329:570–577.
2.Ajuwon, K. M., and M. E. Spurlock.2005. Adiponectin inhibits LPS-induced NF-B activation and IL-6 production and increases PPAR␥2 expression in adipocytes. Am. J. Physiol. Regul. Integr. Comp. Physiol.288:R1220–R1225. 3.Beharka, A. A., J. W. Armstrong, and S. K. Chapes.1998. Macrophage cell lines derived from major histocompatibility complex II-negative mice. In Vitro Cell. Dev. Biol. Anim.34:499–507.
4.Blu¨her, M., M. Fasshauer, A. Tonjes, J. Kratzsch, M. R. Schon, and R. Paschke.2005. Association of interleukin-6, C-reactive protein, interleu-kin-10 and adiponectin plasma concentrations with measures of obesity, insulin sensitivity and glucose metabolism. Exp. Clin. Endocrinol. Diabetes
113:534–537.
5.Carey, A. L., G. R. Steinberg, S. L. Macaulay, W. G. Thomas, A. G. Holmes, G. Ramm, O. Prelovsek, C. Hohnen-Behrens, M. J. Watt, D. E. James, B. E. Kemp, B. K. Pedersen, and M. A. Febbraio.2006. Interleukin-6 increases insulin-stimulated glucose disposal in humans and glucose uptake and fatty acid oxidation in vitro via AMP-activated protein kinase. Diabetes55:2688– 2697.
6.Chaco´n, M. R., J. M. Ferna´ndez-Real, C. Richart, A. Megia, J. M. Go´mez, M. Miranda, E. Caubet, R. Pastor, C. Masdevall, N. Vilarrasa, W. Ricard, and J. Vendrell.2007. Monocyte chemoattractant protein-1 in obesity and type 2 diabetes. Insulin sensitivity study. Obesity (Silver Spring)15:664–672. 7.Chapes, S. K., and A. A. Beharka.1995. Lipopolysaccharide is required for
the lethal effects of enterotoxin B afterD-GALACTOSAMINE SENSITIZATION. J. ENDOTOXINRES.2:263–271.
8.Constant, V. A., A. Gagnon, A. Landry, and A. Sorisky.2006. Macrophage-conditioned medium inhibits the differentiation of 3T3-L1 and human ab-dominal preadipocytes. Diabetologia49:1402–1411.
9.De Taeye, B., T. Novitskaya, O. P. McGuinness, L. Gleaves, M. Medda, J. W. Covington, and D. E. Vaughan.2007. Macrophage TNF-␣contributes to insulin resistance and hepatic steatosis in diet-induced obesity. Am. J. Physiol. Endocrinol. Metab.293:E713–E725.
10.Dinarello, C. A.1997. Proinflammatory and anti-inflammatory cytokines as mediators in the pathogenesis of septic shock. Chest112:321S–329S. 11.Dugani, C. B., and A. Klip.2005. Glucose transporter 4: cycling,
compart-ments and controversies. EMBO Rep.6:1137–1142.
12.Eierman, D. F., C. E. Johnson, and J. S. Haskill.1989. Human monocyte inflammatory mediator gene expression is selectively regulated by adherence substrates. J. Immunol.142:1970–1976.
13.Farmer, S. R.2006. Transcriptional control of adipocyte formation. Cell Metab.4:263–273.
14.Ferna´ndez-Veledo, S., R. Hernandez, T. Teruel, J. A. Mas, M. Ros, and M. Lorenzo.2006. Ceramide mediates TNF-␣-induced insulin resistance on GLUT4 gene expression in brown adipocytes. Arch. Physiol. Biochem.112:
13–22.
15.Guilbert, J. J.2003. The world health report 2002—reducing risks, promot-ing healthy life. Educ. Health (Abpromot-ingdon, Engl.)16:230.
16.Guzik, T. J., D. Mangalat, and R. Korbut.2006. Adipocytokines—novel link between inflammation and vascular function? J. Physiol. Pharmacol.57:505– 528.
17.Hauner, H.2004. The new concept of adipose tissue function. Physiol. Behav.83:653–658.
18.Hotamisligil, G. S.2006. Inflammation and metabolic disorders. Nature
444:860–867.
19.Jager, J., T. Gremeaux, M. Cormont, Y. Le Marchand-Brustel, and J. F. Tanti.2007. Interleukin-1-induced insulin resistance in adipocytes through down-regulation of insulin receptor substrate-1 expression. Endocrinology
148:241–251.
20.Lacasa, D., S. Taleb, M. Keophiphath, A. Miranville, and K. Clement.2007. Macrophage-secreted factors impair human adipogenesis: involvement of proinflammatory state in preadipocytes. Endocrinology148:868–877. 21.Lagathu, C., J. P. Bastard, M. Auclair, M. Maachi, J. Capeau, and M.
Caron.2003. Chronic interleukin-6 (IL-6) treatment increased IL-6 secretion and induced insulin resistance in adipocyte: prevention by rosiglitazone. Biochem. Biophys. Res. Commun.311:372–379.
22.Lagathu, C., L. Yvan-Charvet, J. P. Bastard, M. Maachi, A. Quignard-Boulange, J. Capeau, and M. Caron.2006. Long-term treatment with interleukin-1induces insulin resistance in murine and human adipo-cytes. Diabetologia49:2162–2173.
23.Long, S. D., and P. H. Pekala.1996. Lipid mediators of insulin resistance: ceramide signalling down-regulates GLUT4 gene transcription in 3T3-L1 adipocytes. Biochem. J.319(Pt 1):179–184.
24.Lumeng, C. N., S. M. Deyoung, and A. R. Saltiel.2007. Macrophages block insulin action in adipocytes by altering expression of signaling and glucose transport proteins. Am. J. Physiol. Endocrinol. Metab.292:E166–E174. 25.Medina, E. A., R. R. Afsari, T. Ravid, S. S. Castillo, K. L. Erickson, and T.
Goldkorn.2005. Tumor necrosis factor-␣decreases Akt protein levels in 3T3-L1 adipocytes via the caspase-dependent ubiquitination of Akt. Endo-crinology146:2726–2735.
26.Neels, J. G., and J. M. Olefsky.2006. Inflamed fat: what starts the fire? J. Clin. Invest.116:33–35.
27.Pfaffl, M. W.2001. A new mathematical model for relative quantification in real-time RT-PCR. Nucleic Acids Res.29:e45.
on August 17, 2020 by guest
http://cvi.asm.org/
28.Potts, B. E., and S. K. Chapes.2008. Functions of C2D macrophage cells after adoptive transfer. J. Leukoc. Biol.83:602–609.
29.Potts, B. E., M. L. Hart, L. L. Snyder, D. Boyle, D. A. Mosier, and S. K. Chapes.2008. Differentiation of C2D macrophage cells after adoptive trans-fer. Clin. Vaccine Immunol.15:243–252.
30.Rotter, V., I. Nagaev, and U. Smith.2003. Interleukin-6 (IL-6) induces insulin resistance in 3T3-L1 adipocytes and is, like IL-8 and tumor necrosis factor-␣, overexpressed in human fat cells from insulin-resistant subjects. J. Biol. Chem.278:45777–45784.
31.Ruan, H., N. Hacohen, T. R. Golub, L. Van Parijs, and H. F. Lodish.2002. Tumor necrosis factor-␣suppresses adipocyte-specific genes and activates expression of preadipocyte genes in 3T3-L1 adipocytes: nuclear factor-B activation by TNF-␣is obligatory. Diabetes51:1319–1336.
32.Schenk, S., M. Saberi, and J. M. Olefsky.2008. Insulin sensitivity: modula-tion by nutrients and inflammamodula-tion. J. Clin. Invest.118:2992–3002. 33.Spranger, J., A. Kroke, M. Mohlig, K. Hoffmann, M. M. Bergmann, M.
Ristow, H. Boeing, and A. F. Pfeiffer.2003. Inflammatory cytokines and the risk to develop type 2 diabetes: results of the prospective population-based European Prospective Investigation into Cancer and Nutrition (EPIC)–Pots-dam Study. Diabetes52:812–817.
34.Stephens, J. M., and P. H. Pekala.1991. Transcriptional repression of the GLUT4 and C/EBP genes in 3T3-L1 adipocytes by tumor necrosis factor-␣. J. Biol. Chem.266:21839–21845.
35.Stouthard, J. M., R. P. Oude Elferink, and H. P. Sauerwein.1996. Interleu-kin-6 enhances glucose transport in 3T3-L1 adipocytes. Biochem. Biophys. Res. Commun.220:241–245.
36.Suganami, T., J. Nishida, and Y. Ogawa.2005. A paracrine loop between adipocytes and macrophages aggravates inflammatory changes: role of free fatty acids and tumor necrosis factor␣. Arterioscler. Thromb. Vasc. Biol.
25:2062–2068.
37.Suzawa, M., I. Takada, J. Yanagisawa, F. Ohtake, S. Ogawa, T. Yamauchi, T. Kadowaki, Y. Takeuchi, H. Shibuya, Y. Gotoh, K. Matsumoto, and S.
Kato.2003. Cytokines suppress adipogenesis and PPAR-␥function through the TAK1/TAB1/NIK cascade. Nat. Cell Biol.5:224–230.
38.Trayhurn, P., and I. S. Wood.2005. Signalling role of adipose tissue: adipo-kines and inflammation in obesity. Biochem. Soc. Trans.33:1078–1081. 39.Uysal, K. T., S. M. Wiesbrock, M. W. Marino, and G. S. Hotamisligil.1997.
Protection from obesity-induced insulin resistance in mice lacking TNF-␣ function. Nature389:610–614.
40.Ventre, J., T. Doebber, M. Wu, K. MacNaul, K. Stevens, M. Pasparakis, G. Kollias, and D. E. Moller.1997. Targeted disruption of the tumor necrosis factor-␣gene: metabolic consequences in obese and nonobese mice. Diabe-tes46:1526–1531.
41.Weisberg, S. P., D. McCann, M. Desai, M. Rosenbaum, R. L. Leibel, and A. W. Ferrante, Jr.2003. Obesity is associated with macrophage accumula-tion in adipose tissue. J. Clin. Invest.112:1796–1808.
42.Wellen, K. E., and G. S. Hotamisligil.2005. Inflammation, stress, and dia-betes. J. Clin. Invest.115:1111–1119.
43.Xie, L., D. Boyle, D. Sanford, P. E. Scherer, J. E. Pessin, and S. Mora.2006. Intracellular trafficking and secretion of adiponectin is dependent on GGA-coated vesicles. J. Biol. Chem.281:7253–7259.
44.Xie, L., C. P. O’Reilly, S. K. Chapes, and S. Mora.2008. Adiponectin and leptin are secreted through distinct trafficking pathways in adipocytes. Bio-chim. Biophys. Acta1782:99–108.
45.Xing, H., J. P. Northrop, J. R. Grove, K. E. Kilpatrick, J. L. Su, and G. M. Ringold.1997. TNF␣-mediated inhibition and reversal of adipocyte differ-entiation is accompanied by suppressed expression of PPAR␥without effects on Pref-1 expression. Endocrinology138:2776–2783.
46.Xu, H., G. T. Barnes, Q. Yang, G. Tan, D. Yang, C. J. Chou, J. Sole, A. Nichols, J. S. Ross, L. A. Tartaglia, and H. Chen.2003. Chronic inflamma-tion in fat plays a crucial role in the development of obesity-related insulin resistance. J. Clin. Invest.112:1821–1830.
47.Zoccali, C., F. Mallamaci, and G. Tripepi.2003. Adipose tissue as a source of inflammatory cytokines in health and disease: focus on end-stage renal disease. Kidney Int. Suppl.84:S65–S68.