Western University Western University
Scholarship@Western
Scholarship@Western
Electronic Thesis and Dissertation Repository
9-21-2016 12:00 AM
Role of Anterior Cingulate Cortex in Saccade Control
Role of Anterior Cingulate Cortex in Saccade Control
Sahand Babapoor-Farrokhran The University of Western Ontario
Supervisor
Dr. Stefan Everling
The University of Western Ontario Graduate Program in Neuroscience
A thesis submitted in partial fulfillment of the requirements for the degree in Doctor of Philosophy
© Sahand Babapoor-Farrokhran 2016
Follow this and additional works at: https://ir.lib.uwo.ca/etd
Part of the Cognitive Neuroscience Commons, Other Neuroscience and Neurobiology Commons, Systems and Integrative Physiology Commons, and the Systems Neuroscience Commons
Recommended Citation Recommended Citation
Babapoor-Farrokhran, Sahand, "Role of Anterior Cingulate Cortex in Saccade Control" (2016). Electronic Thesis and Dissertation Repository. 4150.
https://ir.lib.uwo.ca/etd/4150
This Dissertation/Thesis is brought to you for free and open access by Scholarship@Western. It has been accepted for inclusion in Electronic Thesis and Dissertation Repository by an authorized administrator of
ABSTRACT:
Cognitive control is referred to the guidance of behavior based on internal goals rather
than external stimuli. The brain areas involved in implementing cognitive control are
more developed and have larger proportional spatial extent in humans and non-human
primates compared to other species. Studying the mechanisms by which cognitive control
is implemented has recently gained more attention. It has been postulated that prefrontal
cortex is mainly involved in higher order cognitive functions. Specifically, anterior
cingulate cortex (ACC), which is part of the prefrontal cortex, is suggested to be involved
in performance monitoring and conflict monitoring that are considered to be cognitive
control functions.
Saccades are the fast eye movements that align the fovea on the objects of interest
in the environment. Saccade system is one of the most studied motor systems in the brain.
This is mainly due to the simplicity of the saccade system and amenability of
saccade-related brain areas to electrophysiological recordings. This makes the saccadic system an
ideal candidate to study the cognitive control functions.
In this thesis, I have explored the role of ACC in control of saccadic eye
movements. First, I performed a resting-state fMRI study to identify areas within the
ACC that are functionally connected to the frontal eye fields (FEF). It has been shown
that FEF is involved in saccade generation. Therefore, the ACC areas that are
functionally connected to FEF could be hypothesized to have a role in saccade control.
Then, I performed simultaneous electrophysiological recordings in the ACC and FEF to
In the first chapter, I have shown that ACC has functional connectivity with the
FEF. Furthermore, I observed differential functional connectivity of medial and lateral
FEF with other brain areas. In the second chapter, I have shown that theta and beta bands
are involved in information transmission between FEF and ACC. Finally, using Granger
causality analysis, I have shown that ACC exerts control over FEF when monkeys
perform saccade-related tasks.
These findings show that ACC is involved in cognitive control of saccades.
Furthermore, the ACC and FEF neurons communicate through synchronized theta and
beta band activity in these areas. The results of this thesis shine light on the mechanisms
by which these brain areas communicate. Moreover, my findings support the notion that
ACC and FEF have a unique oscillatory property, and more specifically ACC has a
prominent theta band, and to a lesser extent beta band activity.
Keywords:
Cognitive control, anterior cingulate cortex (ACC), frontal eye field (FEF), resting-state
fMRI, functional connectivity, working memory, memory-guided saccade task,
pro-/anti-saccade task, local field potentials (LFP), multi-unit recording, brain oscillations, theta
TABLE OF CONTENTS:
ABSTRACT: ... ii
TABLE OF CONTENTS: ... iv
CO-AUTHORSHIP STATEMENT: ... vii
EPIGRAPH: ... viii
DEDICATION: ... ix
ACKNOWLEDGEMENTS: ... x
LIST OF TABLES: ... xi
LIST OF FIGURES: ... xii
LIST OF ABBREVIATIONS: ... xxi
CHAPTER 1: ... 1
1. GENERAL INTRODUCTION: ... 1
1.1. ANTERIOR CINGULATE CORTEX (ACC): ... 1
1.1.1. History: ... 1
1.1.2. ACC subdivisions: ... 2
1.1.3. ACC connectivity: ... 3
1.1.4. ACC functions: ... 4
1.1.4.1. ACC and motor functions: ... 7
1.1.4.2. ACC and the limbic system: ... 8
1.1.4.3. ACC and conflict monitoring: ... 9
1.1.4.4. ACC and performance monitoring: ... 11
1.2. SACCADES AND THE OCULOMOTOR SYSTEM: ... 14
1.2.1. Frontal eye fields: ... 15
1.2.2. Frontal eye fields and visual functions: ... 18
1.2.3. Memory-guided saccade task: ... 20
1.2.4. Pro-/Anti-saccade task: ... 21
1.2.5. Cingulo-Frontal (ACC-FEF) interaction in saccade tasks: ... 24
1.2.5.1 Resting-state connectivity of the ACC: ... 25
1.2.5.2. Resting-state fMRI: ... 27
1.2.5.3. Analytic approaches for resting-state fMRI: ... 30
1.2.5.4. Resting-state fMRI and clinical applications: ... 31
1.3. BRAIN RHYTHMS: ... 34
1.3.1. Communication through coherence (CTC): ... 35
1.3.2. Theta band: ... 37
1.3.3. Beta band: ... 40
1.4. OBJECTIVES: ... 42
1.5. REFERENCES: ... 44
CHAPTER 2: ... 56
2. Functional connectivity patterns of medial and lateral macaque frontal eye fields reveal distinct visuomotor networks ... 56
2.1. ABSTRACT: ... 56
2.2. INTRODUCTION: ... 57
2.3. MATERIALS AND METHODS: ... 59
2.3.1. Data acquisition: ... 59
2.3.2. Image preprocessing: ... 61
2.3.3. Statistical analysis: ... 61
2.3.4. Region-of-interest identification: ... 63
2.4. RESULTS: ... 66
2.5. DISCUSSION: ... 77
2.6. REFERENCES: ... 84
CHAPTER 3: ... 92
3. Theta and Beta synchrony coordinate frontal eye fields and anterior cingulate cortex during sensori-motor mapping ... 92
3.1. ABSTRACT: ... 92
3.2. INTRODUCTION: ... 93
3.3. MATERIALS AND METHODS: ... 94
3.4. RESULTS: ... 95
3.4.1. Modulation of theta and beta power during the delay period: ... 97
3.4.2. Task-dependent LFP-LFP coherence between ACC and FEF: ... 99
3.4.3. Task-dependent Granger-causality between ACC and FEF LFPs: ... 104
3.4.4. Decreased theta and beta-synchrony between ACC and FEF LFPs on error trials: ... 105
3.4.5. Modulation of spike-field synchrony during the delay period: ... 108
3.5. DISCUSSION: ... 114
3.6. REFERENCES: ... 123
3.7. SUPPLEMENTARY METHODS: ... 127
3.7.1. Subjects: ... 127
3.7.2. Behavioral Task: ... 127
3.7.3. Electrophysiological Recordings: ... 129
3.7.4. Data Analysis: ... 130
3.7.5. Supplementary references: ... 136
CHAPTER 4: ... 145
4. GENERAL DISCUSSION: ... 145
4.1. SUMMARY OF THE MAIN FINDINGS: ... 145
4.1.1. FEF is functionally connected to the ACC and there is a difference between the functional connectivity of the medial and lateral FEF: ... 145
4.1.2. Theta and beta band synchronization is involved in the communication between FEF and ACC: ... 148
4.1.3. ACC affects FEF in memory-guided saccade task: ... 151
4.2.1. Limited ability to record from multiple sites: ... 153
4.2.2. Lack of specificity with regards to the recorded layer of the cortex: ... 154
4.3. FUTURE DIRECTIONS: ... 155
4.3.1. Investigating the theta- and beta band synchronization of medial and lateral FEF with ACC: ... 155
4.3.2. Investigating the beta and theta band synchronization in pro-/anti-saccade task: ... 155
4.3.3. Identifying specific sub-classes of single units in the ACC and FEF that are coupled with different frequency bands: ... 156
4.4. REFERENCES: ... 156
APPENDIX A: Documentation of Ethics Approval ... 159
CO-AUTHORSHIP STATEMENT:
Sahand Babapoor-Farrokhran, Martin Vinck, Joseph S. Gati, Ravi S. Menon, Thilo
Womelsdorf, and Stefan Everling.
As the primary author of the chapters, I (Sahand Babapoor-Farrokhran) have designed the
experiments, collected the data, performed the data analysis, and wrote the completed
manuscripts. Dr. Stefan Everling supervised all projects and assisted in experiment
design, data analysis, and manuscript revisions for all the experimental chapters. Mr.
Joseph S. Gati and Dr. Ravi S. Menon kindly assisted in data collection of chapter 2. Dr.
Martin Vinck was instrumental in data analysis of chapter 3. Dr. Thilo Womelsdorf
EPIGRAPH:
“It has been said that the beauty is in the eyes of the beholder. As a hypothesis . . . it
points clearly enough to the central problem of cognition: . . . The world of experience is
produced by the person who experiences it”
DEDICATION:
ACKNOWLEDGEMENTS:
First, I would like to thank Dr. Everling very much for taking me on as a PhD student,
offering me his trust, and teaching me the skills needed to be a dedicated scientist. He has
always encouraged me to develop my own ideas, and provided me the opportunity to
experiment them. Also, he has always been a supportive supervisor and this has made me
more determined to pursue my career in the realm of science.
Secondly, I would like to thank my family: Mom, Dad, Shaghayegh, Savalan, and Ali.
They are the people I rely on, and they have always helped me in the long road I have
chosen.
I would also like to thank my friends in the Everling lab over the years: Darren, Kevin
(Skoblenick), Kevin (Johnston), Jessica, Michelle, Iman, Michael, Sabeeha, Susheel,
Jason, Alex, Ramina, Brandon, Liya, Nicole. Thilo Womelsdorf, for helping me analyze
the data. Ravi Menon and Joseph Gati for helping me collect the resting-state fMRI data.
Special thanks to Martin, who has helped me perform the sophisticated analysis,
sometime till after midnight.
Lastly, I’d like to thank my friends in BMI, back home and all around the world; I have
always enjoyed your accompany. Thanks Caroline for the very quick and timely edition
LIST OF TABLES:
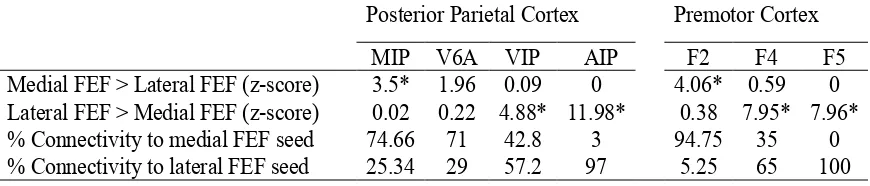
Table 1.1. Statistical analysis and percentage connectivity of FEF seed regions with
LIST OF FIGURES:
Figure 1.1. Retrogradely labeling of cells in coronal sections (Top panel), and depiction of labeled cells on the medial hemispheric wall (Bottom panel).
Cortical maps inset in the middle: Surface view of the right hemisphere showing the location of cortical injection sites (asterisks), and rostrocaudal levels of coronal sections (a-e) indicated by lines labeled with a to e. The letters f-j in the schematic section (to the right of the cortical map) correspond to f-j in the unfolded map at the bottom. In coronal sections and in an unfolded map, each dot represents 2-5 labeled cells. Regions surrounded by elliptical lines indicate approximate territories projecting to the forelimb area of MI and FEF. Arrowhead in the unfolded map indicates the caudal end of arcuate sulcus. Red dots, FB-labeled cells; green dots, DY-labeled cells. SA, superior limb of arcuate sulcus; IA, inferior limb of arcuate sulcus; Spur, spur of arcuate sulcus; PCS, precentral sulcus; CS, central sulcus; ARC, arcuate sulcus; PS, principle sulcus; Cing S, cingulate sulcus; CC, corpus callosum; CMAr, rostral cingulate motor area; CMAd, dorsal cingulate motor area; CMAv, ventral cingulate motor area; CEFr, rostral cingulate eye field; CEFc, caudal cingulate eye field…….………....5
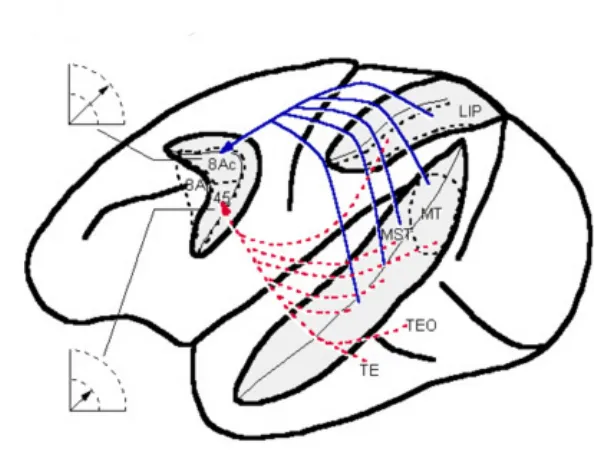
Figure 1.2.Summary of major connections of FEF with visual cortical areas.
The location of specific cortical areas is indicated on a dorsolateral view of the macaque brain. The relative amplitude of saccades represented by ventral FEF (area 45) and dorsal FEF (urea 8Ac) is indicated. The solid blue lines indicate major projections to area 8Ac, and the dashed red lines represent major projections to area 45………17
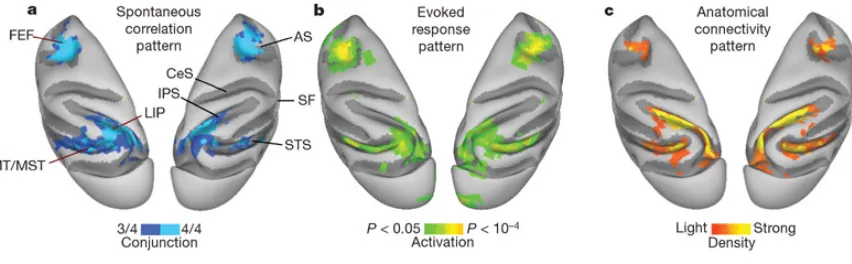
Figure 1.3. Cortical patterns of coherent spontaneous BOLD fluctuations are similar
reflection of the right hemisphere to facilitate visual comparison. Only regions that showed reproducible projections to LIP are shown. AS, arcuate sulcus; CeS, central sulcus; IPS, intraparietal sulcus; SF, sylvian fissure; STS, superior temporal sulcus…...29
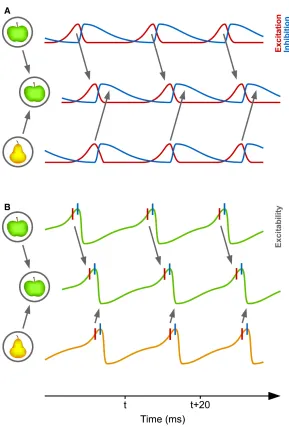
Figure 1.4.Communication through Coherence
(A) Two presynaptic neuronal groups in a lower visual area provide input to a postsynaptic neuronal group in a higher visual area. The lower groups represent two visual stimuli, an apple and a pear. In each neuronal group, network excitation (red) triggers network inhibition (blue), which inhibits the local network. When inhibition decays, excitation restarts the gamma cycle. The gamma rhythm of the apple-representing presynaptic group has entrained the gamma rhythm in the postsynaptic group. Thereby, the apple-representing pre- synaptic group can optimally transmit its representation, whereas the pear-representing presynaptic group cannot transmit its representation. (B) A simplified illustration in which network excitation and inhibition are combined into network excitability. Red vertical lines indicate excitatory neuron spiking and blue vertical lines inhibitory neuron spiking……….36
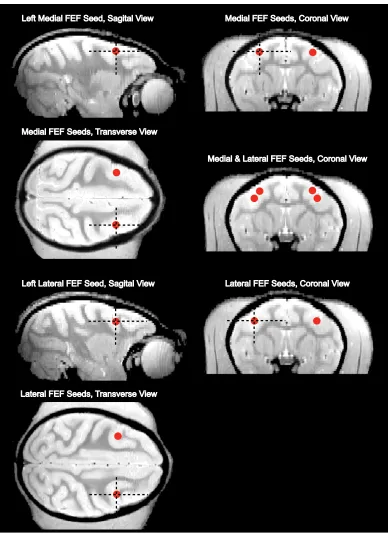
Figure. 2.1.Location of lateral and medial frontal eye field (FEF) spherical seeds in
monkey 1. The spherical seed regions have a radius of 2 mm………..65
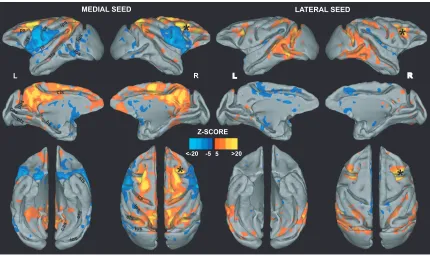
Figure 2.2.Right medial (left) and right lateral (right) FEF seed connectivity maps
projected on the F99 template (Van Essen 2004) (z-score 5 set at cluster significance of
P 0.05, corrected for multiple comparisons). The connectivity maps are shown on lateral, medial, dorsal, and ventral views. Asterisks show the location of the seed region. pos, Parieto-occipital sulcus; cas, calcarine sulcus; cs, central sulcus; hs, hippocampal sulcus; cis, cingulate sulcus; sts, superior temporal sulcus; ios, inferior occipital sulcus; lus, lunate sulcus; ots, occipitotemporal sulcus; ps, principal sulcus; L, left; R, right……….68
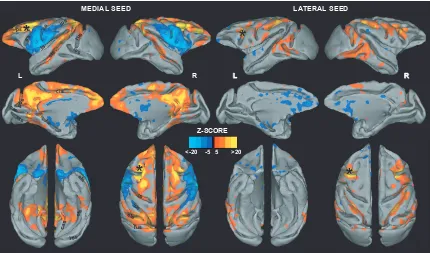
Figure 2.3. Left medial (left) and right lateral (right) FEF seed connectivity maps
P 0.05, corrected for multiple comparisons). The connectivity maps are shown on lateral, medial, dorsal, and ventral views. Asterisks show the location of the seed region……...69
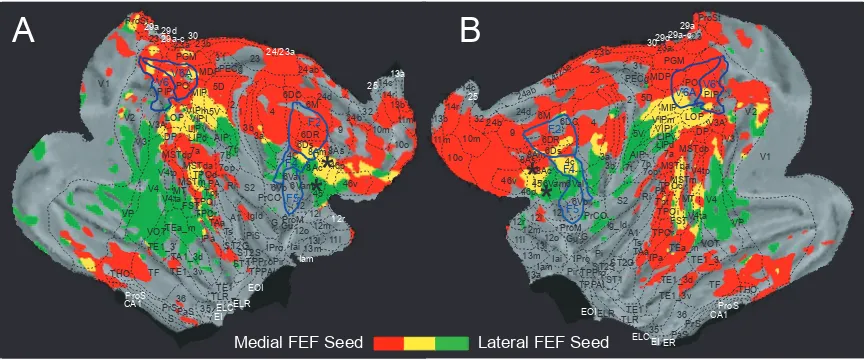
Figure 2.4. Cortical views of both hemispheres flattened to display spatial overlap
connectivity patterns of right medial and lateral FEF (A) and left medial and lateral
FEF (B). Images show the connectivity pattern of the positively functionally connected areas (z-score 5 set at cluster significance of P 0.05, corrected for multiple comparisons). Areas in red are functionally connected to the medial FEF, areas in green are functionally connected to the lateral FEF, and areas in yellow are functionally connected to both. White lines indicate the boundaries of parietal areas V6 and V6A according to Galletti et al. (1999) and also premotor areas F2, F4, and F5 according to Markov et al. (2011). Asterisks show the location of the seed regions………71
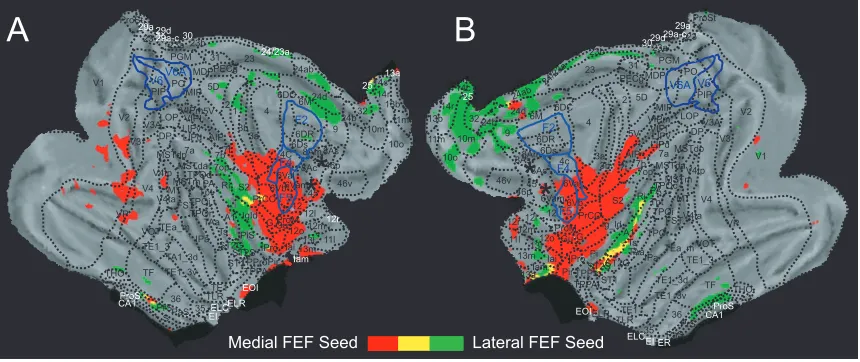
Figure 2.5. Cortical views of both hemispheres flattened to display spatial overlap
connectivity patterns of right medial and lateral FEF (A) and left medial and lateral
FEF (B). Images show the connectivity pattern of the negatively functionally connected areas (z-score 5 set at cluster significance of P 0.05, corrected for multiple comparisons). Areas in red are negatively connected to the medial FEF, areas in green are negatively connected to the lateral FEF, and areas in yellow are negatively connected to both. White lines indicate the boundaries of parietal areas V6 and V6A according to Galletti et al. (1999) and also premotor areas F2, F4, and F5 according to Markov et al. (2011). Asterisks show the location of the seed regions………72
Figure 2.6. Coronal slices of the functional connectivity patterns of medial and
lateral FEF on F99 atlas (Van Essen 2004) as indicated at top. Red-yellow areas are
positively correlated areas, and blue-light blue areas are negatively correlated areas (z -score 4 set at cluster significance of P 0.05, corrected for multiple comparisons)……….………….75
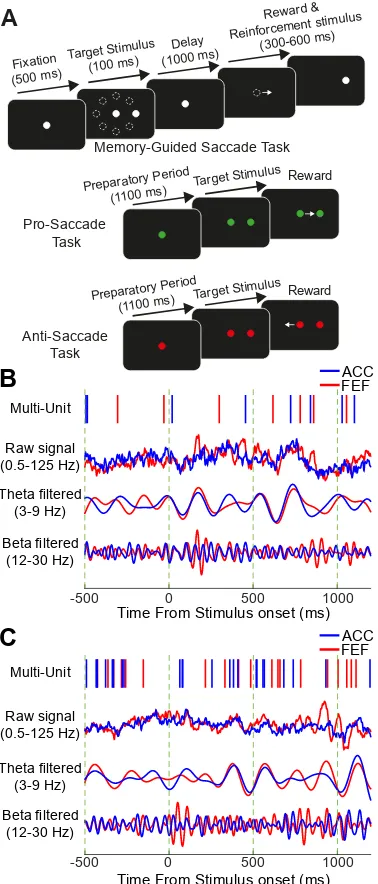
Figure 3.1. Experimental paradigm and sample traces of simultaneously recorded
125 Hz), theta band pass filtered signal (3-9Hz) and beta band pass filtered signal (12-30 Hz) in a trial of memory-guided saccade task. (C) Same as A in another memory-guided saccade task trial. The vertical green dashed lines indicate the 500ms time intervals aligned on stimulus onset………...………96
Figure 3.2. LFP power in FEF and ACC during the memory-guided saccade task.
(A) Average time frequency spectra of the FEF LFP power across 8 target locations in the memory-guided saccade task. (B) Average time frequency spectra of ACC LFP power across 8 target locations in the memory-guided saccade task. The dashed lines demarcate the time of the onset and offset of the target stimulus. The black boxes on top of each graph demarcate the delay period………..……98
Figure 3.3. Increased theta and beta coherence between ACC and FEF. (A)
Time-Frequency spectrum of the wpli-debiased coherence between the FEF and ACC in memory-guided saccade task for the population of ACC-FEF channel pairs (n=674). The white contour shows the area in which the subsequent analyses were performed (see Methods). The dashed lines demarcate the time of the onset and offset of the target stimulus. (B) WPLI-debiased FEF-ACC coherence spectrum of the individual monkeys in the delay period across all recording pairs (n=674). (C) Theta band (3-9 Hz) time course of the ACC-FEF WPLI-debiased phase synchronization. (D) Beta band (12-30 Hz) time course of the ACC-FEF WPLI-debiased phase synchronization. (E) Comparison of WPLI-debiased coherence between baseline and delay period of the contra-versive and ipsi-versive memory-guided saccades (***: p < 0.001, t-test). Error bars indicate SEM. (F) Comparison of the overall Granger causality effect of ACC over FEF (GACC à FEF -
GFEF à ACC) between baseline and delay period of the contra-versive and ipsi-versive
delay period of the contra-versive and ipsi-versive memory-guided saccades (***: p < 0.001; t-test). Error bars indicate SEM……….…………...………102
Figure 3.4. Correct task performance is dependent on field-field coherence but not
on LFP power. (A) Shown the comparison of theta (columns 1 and 2) and beta-band
(columns 3 and 4) WPLI-debiased coherence between correct and error memory-guided saccades in the delay period of the memory guided saccade task (400-1100ms following target stimulus onset) and the preparatory period (400-1100ms following fixation onset) of the anti-saccade task. (B) Same as A, but shown normalized ACC theta and beta-band power. (C) Same as A but for normalized FEF power. *: p<0.05; **: p<0.01; ***: p < 0.001, t-test. Error bars indicate SEM………..107
Figure 3.5. Percentage of units with significant spike-field coupling in theta and beta
band. (A) Percentage of the ACC-units-to-FEF-LFP pairs showing significant changes in
phase-locking across the theta and beta frequency range. Comparison between baseline and delay of contra-versive saccades (left), comparison between baseline and delay of ipsi-versive saccades (middle) and comparison between the contra- and ipsi-versive saccades in the delay period (right). (B) Same as (A), but now depicted the percentage of the FEF-units-to-ACC-LFP pairs showing significant changes in phase-locking across the theta and beta frequency range. Statistical testing was performed using two-sided permutation tests, such that chance level is 2.5%...111
Figure 3.6. Pairwise phase consistencies (PPCs) across delta and theta band. (A)
baseline and delay of ipsi-versive saccades (middle) and comparison between the contra- and ipsi-versive saccades in the delay period (right). It should be noted that the same significant differences between ipsi-versive and contra-versive trials were seen even after we compared the contra- versus ipsi-versive conditions using a permutation test as described in the methods section. Error bars denote SEM in all panels. *: p < 0.05, paired t-test). The rose plots on the side of each graph show the histogram of the coupling angles of the population of the ACC/FEF units……….…….112
Figure 3.7. Pairwise phase consistencies (PPCs) across beta band. (A) PPC spike-field
coherence spectrum of the population of the ACC-units-to-FEF-LFP pairs across the beta frequency range. Comparison between baseline and delay of contra-versive saccades (left), comparison between baseline and delay of ipsi-versive saccades (middle) and comparison between the contra- and ipsi-versive saccades in the delay period (right). (B) PPC spike-field coherence spectrum of the population of the FEF-units-to-ACC-LFP pairs across the beta frequency range. Comparison between baseline and delay of contra-versive saccades (left), comparison between baseline and delay of ipsi-contra-versive saccades (middle) and comparison between the contra- and ipsi-versive saccades in the delay period (right). Error bars denote SEM in all panels. *: p < 0.05, paired t-test)………..……….113
Figure 3.8. Illustration of recorded brain area locations and summary of main
inter-areal ACC-FEF modulations observed in this study. (A) ACC and FEF recording
directions during the delay in the theta band, but was different between delay and baseline merely in one beta frequency bin (at 22Hz) for ACC spike to FEF LFP sites for contra-versive saccades. Reduced inter-area modulation prior to error commission was evident in both frequencies across different measures and is described in the text…….122
Supplementary Figure 3.1. Schematic reconstruction of the recording sites. The
recording sites are overlaid on the F99 surface (using Caret software, Van Essen lab) according to the composite atlas of Van Essen et al. (2012)2. The left column is the reconstruction of the ACC recording sites shown on a fiducial (up), inflated (middle) and flat surface map. The arrows on the top and middle panels denote the location of the angle of the Arcuate sulcus. Similarly, the left column sows the reconstruction of the FEF recording sites………..138
Supplementary Figure 3.2. WPLI-debiased spectrum. (A) The phase synchronization
spectrum between ACC and FEF in memory-guided saccades is depicted across all recording pairs (n=674).The panel shows larger ACC-FEF phase synchronization across theta and beta bands in the delay period (400-1100ms following the stimulus onset, blue) compared to the baseline (700ms prior to the fixation onset, black). (B) The phase synchronization spectrum between ACC and FEF in pro-/anti-saccades is depicted across all recording pairs (n=674). The panel shows larger ACC-FEF phase synchronization across theta and beta bands in the preparatory period (400-1100 ms following the fixation onset, blue) compared to the baseline (700 ms prior to the fixation onset, black). The shading shows +/- SEM………...139
Supplementary Figure 3.3. Increased theta-coherence between ACC and FEF after
event-related signal subtraction. (A) Time-Frequency spectra of the WPLI-debiased
debiased phase synchronization. (D) Beta band (12-30 Hz) time course of the ACC-FEF WPLI-debiased phase synchronization………140
Supplementary Figure 3.4. Granger causality spectrum between ACC and FEF. (A)
Causality effect of ACC over FEF (GACC à FEF) in the delay period (400-1100ms
following the stimulus onset, blue) and the baseline (700 ms prior to fixation onset, black). The causality effect of ACC over FEF is larger in the delay period across theta and beta frequency range. (B) Causality effect of FEF over ACC (GFEF à ACC)in the delay
period (red) and the baseline (black). The causality effect of FEF over ACC is larger in the delay period across theta and beta frequency range. (C) Causality effect of ACC over FEF (GACC à FEF, blue) is higher than the causality effect of FEF over ACC (GFEF à ACC,
red) in the delay period across theta and beta frequency range. The shading depicts +/- SEM. The ACC-FEF channel pairs (n=275) that displayed reversed Granger causality following the reversal of time series are included in this figure………....141
Supplementary Figure 3.5. Pairwise phase consistencies (PPCs) across alpha band.
(A) PPC spike-field coherence spectrum of the population of the ACC units with the LFP’s recorded in the FEF across the alpha frequency range. Comparison between baseline and delay of contra-versive saccades (left), comparison between baseline and delay of versive saccades (middle) and comparison between the contra- and ipsi-versive saccades in the delay period (right). (B) PPC spike-field coherence spectrum of the population of the FEF units with the LFP’s recorded in the ACC across the alpha frequency range. Comparison between baseline and delay of contra-versive saccades (left), comparison between baseline and delay of ipsi-versive saccades (middle) and comparison between the contra- and ipsi-versive saccades in the delay period (right). Error bars denote SEM in all panels. *: p < 0.05, paired t-test)………...142
Supplementary Figure 3.6. Pairwise phase consistencies (PPCs) across gamma band.
the population of the FEF units with the LFP’s recorded in the ACC across the gamma frequency range. Comparison between baseline and delay of contra-versive saccades (left), comparison between baseline and delay of ipsi-versive saccades (middle) and comparison between the contra- and ipsi-versive saccades in the delay period (right). Error bars denote SEM in all panels. *: p < 0.05, paired t-test)………...143
Supplementary Figure 3.7. Pairwise phase consistencies (PPCs) spectrum. (A) PPC
LIST OF ABBREVIATIONS:
ACC – Anterior Cingulate Cortex
AIP – Anterior IntraParietal area
AS – Arcuate Sulcus;
BOLD – Blood Oxygenation Level Dependent
CEFc – caudal Cingulate Eye Field CEFr – rostral Cingulate Eye Field
CeS – Central Sulcus
CMAd – dorsal Cingulate Motor Area CMAr – rostral Cingulate Motor Area CMAv – ventral Cingulate Motor Area CS – Central Sulcus
CTC – Communication Through Coherence dl-PFC – DorsoLateral Prefrontal Cortex DMN – Default Mode Network
EEG – ElectroEncephaloGram ERN – Error Related negativity ERP – Event Related Potential FC – Functional Connectivity FEF – Frontal Eye Field
fMRI – functional Magnetic Resonance Imaging FMθ – Frontal Midline Theta
G – Granger causality
Hz – Hertz
ICA – Independent Component Analysis
IPS – IntraParietal Sulcus
LFP – Local Field Potential LIP – Lateral IntraParietal area
MDP – Medial Dorsal Parietal area
min – minute
MIP – Medial IntraParietal area mmHg – millimeters of mercury
MRI – Magnetic Resonance Imaging
ms – Millisecond
MST – Medial Superior Temporal area MT – Middle Temporal area
OTS – OccipitoTemporal Sulcus
PCS – PreCentral Sulcus PFC – PreFrontal Cortex
PIP – Posterior IntraParietal area PO – Parietal-Occipital area PPC – Pairwise Phase Consistency
PS – Principle Sulcus ROI – Region Of Interest RS-fMRI – Resting-State fMRI RSN – Resting State Network SC – Superior Colliculus
sec – second
SF – Sylvian Fissure
SMA – Supplementary Motor Area
STS – Superior Temporal Sulcus
VIP – Ventral IntraParietal area vl-PFC – VentroLateral Prefrontal Cortex VOT – Ventral OccipitoTemporal area
CHAPTER 1:
1. GENERAL INTRODUCTION:
Cognitive control refers to the adjustments made in the processing of sensory inputs and
motor outputs to serve internal goals (Miller and Cohen 2001). A few examples of
cognitive control functions are attention, working memory, and decision making (Miller
and Cohen 2001). A network of brain areas is involved in cognitive control including the
prefrontal cortex (Fuster 2008). The prefrontal cortex performs cognitive control
functions through exerting top-down control on other cortical areas. Top-down control is
needed when the behavior is not driven by merely the sensory stimuli, but also by internal
intentions and goals (Miller and Cohen 2001). The medial prefrontal cortex and in
particular, the anterior cingulate cortex (ACC) has been suggested to exert top-down
control on other cortical areas. The ACC has been suggested to be involved in a multitude
of cognitively demanding tasks, and therefore, a brief review of literature surrounding
ACC function is provided in below.
1.1. ANTERIOR CINGULATE CORTEX (ACC):
1.1.1. History:
The cingulate cortex was initially thought of as a cortical area associated with the limbic
system (MacLean 1990). However, substantial evidence that gathered through
neuroimaging and electrophysiological experiments in 1990s and thereafter, casted doubt
on this theory. In fact, it was shown that large parts of the cingulate cortex are involved in
subgenual ACC possess autonomic properties that could be considered as limbic
functions (Dum and Strick 2002). Further studies found that the ACC is comprised of
cytoarchitectonically distinct subdivisions that are involved in a variety of functions.
Below, I will describe the subdivisions and the most commonly studied functions of the
ACC.
1.1.2. ACC subdivisions:
ACC is part of the medial prefrontal cortex. The cingulate cortex was viewed as a single
functional unit for the most part of the last century. In separate reports, Papez (1937) and
MacLean (1954) have defined the cingulate cortex as part of the limbic system and they
emphasized that the cingulate cortex is involved in emotional responses (Maclean 1954;
Papez 1995). This view of cingulate function did not consider the motor and visuo-spatial
properties of the cingulate cortex. In a different model of the cingulate cortex structure
based on the cytoarchitectonic characteristics, the dual subdivision for the cingulate
cortex, the anterior and the posterior cingulate cortices, was proposed (Brodmann and
Garey 1994). The dual model of the cingulate cortex provides a more precise description
of the functional and cytological properties of the cingulate cortex. For example, the
anterior cingulate cortex is mainly involved in executive functioning whereas the
posterior cingulate cortex is involved in evaluative processes (Vogt 2009). The dual
model of the cingulate cortex subdivision is a dominant model and is used in many
current reports to refer to the cingulate cortex. However, recent functional neuroimaging
and immunohistochemical studies have shown that even the dual model needs to be
Gallagher et al. 2009). The authors argued that the difference between rostral and caudal
ACC is so pronounced that these two areas should be considered two distinct
neuroanatomical divisions. Consequently, the concept of mid-cingulate cortex (MCC) has
emerged (Vogt 2009). It has been suggested that the MCC includes the cingulate motor
areas and is involved in evaluation of feedback and reward (Procyk et al. 2016).
In humans, the ACC includes the areas 24c, 24, 25, 32 and 33 (Vogt 2009) and
the MCC includes the cytoarchitectonic areas 24a′, 24b′, 24c′, 24d, 33′, and 32′
(Palomero-Gallagher et al. 2008; Vogt et al. 1995). Monkeys and humans have similar
ACC subdivisions. However, area 32 in humans is larger and more elaborated (Vogt
2009). Furthermore, area 24 in humans is larger and expanded more than in monkeys.
With regards to the MCC, the major difference between humans and monkeys is the
absence of area 32′and ectocollosal divisions of area 33′in monkeys. The absence of a
paracingulate sulcus in monkeys is the gross neuroanatomical difference between
monkeys and humans.
1.1.3. ACC connectivity:
The ACC displays extensive connectivity with cortical and subcortical areas. It has been
shown that ACC has strong functional connectivity with anterior insula (Neubert et al.
2015). The other cortical area with dense reciprocal connectivity with the ACC is the
lateral prefrontal cortex. Bates and Goldman-Rakic have shown that cingulate motor
areas are reciprocally connected with areas 8a, 11, and 46 in the prefrontal cortex (Bates
and Goldman-Rakic 1993). In another anatomical tracing study, Wang and colleagues
found areas within the ACC with direct projection to the frontal eye fields (Figure 1.1).
functions with sensori-motor commands (Naito et al. 2000). The findings from
anatomical tracing studies are also in line with results from resting-state functional
connectivity, which will be discussed in section 1.2.5.1 below; e.g. see (Hutchison et al.
2012).
1.1.4. ACC functions:
The ACC has been described as one of the prefrontal areas exerting top-down control
over other brain regions (Silvetti et al. 2014). Some of the functions that the ACC has
been suggested to be involved in include conflict monitoring, reward monitoring,
performance monitoring, and working memory (Brignani et al. 2010). Furthermore, the
ACC has been shown to have motor as well as emotional and motivational functions
(Silvetti et al. 2014). Thus, there are a multitude of sensori-motor and cognitive functions
that have been attributed to the ACC. Some of these functions, and also the models that
have been developed in recent years to describe the ACC role in cognitive control, will be
Figure 1.1. Retrogradely labeling of cells in coronal sections (Top panel), and depiction of labeled cells on the medial hemispheric wall (Bottom panel).
Cortical maps inset in the middle: Surface view of the right hemisphere showing the location of cortical injection sites (asterisks), and rostrocaudal levels of coronal sections (a-e) indicated by lines labeled with a to e. The letters f-j in the schematic section (to the right of the cortical map) correspond to f-j in the unfolded map at the bottom. In coronal sections and in an unfolded map, each dot represents 2-5 labeled cells. Regions surrounded by elliptical lines indicate approximate territories projecting to the forelimb area of MI and FEF. Arrowhead in the unfolded map indicates the caudal end of arcuate sulcus. Red dots, FB-labeled cells; green dots, DY-labeled cells. SA, superior limb of arcuate sulcus; IA, inferior limb of arcuate sulcus; Spur, spur of arcuate sulcus; PCS, precentral sulcus; CS, central sulcus; ARC, arcuate sulcus; PS, principle sulcus; Cing S, cingulate sulcus; CC, corpus callosum; CMAr, rostral cingulate motor area; CMAd, dorsal cingulate motor area; CMAv, ventral cingulate motor area; CEFr, rostral cingulate eye field; CEFc, caudal cingulate eye field.
1.1.4.1. ACC and motor functions:
The ACC displays a variety of motor properties. Electrical micro-stimulation of the ACC
results in complex movements of the mouth and forelimbs in macaque monkeys (Luppino
et al. 1991). It has been shown that the eye and face movement-related activity in
cingulate cortex is more prevalent in rostral cingulate cortex, whereas forelimb
movement-related activity is most commonly observed in caudal cingulate cortex (Procyk
et al. 2016). Furthermore, micro-stimulation of the monkey ACC can elicit vocalizations
together with autonomic emotional motor responses (Muller-Preuss et al. 1980; Paus
2001). The involvement of ACC in vocalizations has also been observed in other
mammals, e.g., the elicited vocalizations in bats exhibited a tonotopic organization within
the ACC with a distinct frequency map, similar to somatotopic pattern of the motor
functions (Gooler and O'Neill 1987). Yet, micro-stimulation of the human ACC does not
result in vocalizations (Devinsky et al. 1995). Indeed, the ACC motor map in humans is
organized in a caudal-to-rostral gradient, with the highest density of neurons with motor
and premotor activities located in the caudal ACC (Dum and Strick 2002). The caudal
ACC in this map corresponds with areas ventral to the supplementary motor area.
It has also been suggested that the ACC is involved in the control of saccadic eye
movements (Kennerley and Wallis 2009; Wang et al. 2004). Indeed, Wang and
colleagues have shown that there are areas within the ACC with direct projections to the
frontal eye fields (FEF) as shown in Figure 1.1 (Wang et al. 2004). They named these
areas the cingulate eye fields. However, the activity of ACC neurons in these “cingulate
According to the above mentioned studies, it can be concluded that motor and
cognitive signals are represented simultaneously in the ACC. Paus has argued that the
presence of motor activity in combination with the cognitive control function within the
ACC serves as an advantage to transform goals and intentions into actions (Paus 2001).
1.1.4.2. ACC and the limbic system:
The ACC has been classically considered to be part of the limbic system (Papez 1995). It
has been shown that it has strong anatomical connections with the hippocampus through
the parahippocampal gyrus (Nieuwenhuys et al. 1981; Silvetti et al. 2014). Electrical
micro-stimulation of the ACC could evoke motivational and emotional responses (Parvizi
et al. 2013). In the study conducted by Parvizi et al., it was shown that stimulation of the
ACC triggered expectations of impending challenge coupled with a “will to persevere”
(Parvizi et al. 2013). Correspondingly, there have been studies showing that ACC
micro-stimulation leads to autonomic responses such as changes in blood pressure, heart rate,
and penile erection (Devinsky et al. 1995; Parvizi et al. 2013). The visceral and
autonomic functions of the ACC follow a rostro-caudal gradient with rostral ACC
possessing higher levels of autonomic functions (Dum and Strick 2002). Finally, the
ACC receives nociceptive projections from thalamus (Vogt et al. 1979).
Similar to motor functions of the ACC, the autonomic and motivational responses
in the ACC are prominently linked to the cognitive demands of the tasks (Critchley and
Mathias 2003; Gabriel et al. 1991) and therefore, ACC could be considered as an area
1.1.4.3. ACC and conflict monitoring:
One of the key capabilities of humans and non-human primates is their ability to
effectively adjust their behavior in response to a wide variety of behavioral challenges
they encounter. This becomes more important when the challenges include choosing
between competing stimuli or suppression of a prepotent response. The first steps in
processing and responding to these challenging situations are the timely detection of
conflict and subsequent allocation of adequate cognitive resources to overcome the
challenges imposed by these conflicting situations. It is widely believed that the ACC
provides the main neural substrates for conflict detection (Carter and van Veen 2007).
Some of the earlier evidence for its involvement in conflict monitoring came from
experiments using the Stroop task (Stroop 1935); for a review see (MacLeod and
MacDonald 2000). In the classic Stroop task, the subjects name the color in which the
words are presented. It has been observed that subjects respond faster when the name of
the color matches the word itself (congruent trials), whereas the response time is
significantly longer in trials when words refer to different colors (incongruent trials)
(Botvinick et al. 2004). It has been demonstrated that ACC is activated when subjects
perform incongruent trials of the Stroop task (Botvinick et al. 2004; MacLeod and
MacDonald 2000). Moreover, the ACC is involved in a variety of other cognitive tasks
where a proponent response has to be suppressed in favor of a task-relevant behavior
(Braver et al. 2001; Paus et al. 1993). It has been suggested that ACC activation in high
conflict trials recruits more cognitive resources to perform the desired task. This
suggestion has been supported in an experiment where there was a smaller interference
preceding trials (Kerns et al. 2004). In the same study, it has been observed that
dorso-lateral prefrontal cortex (dl-PFC) is activated following strong activation of the ACC.
This finding supports a conflict-monitoring role for the ACC according to which the
ACC detects conflict and recruits the dl-PFC to exert additional top-down control to
successfully perform the tasks.
The proposal for a conflict monitoring role of the ACC originates mainly from
human neuroimaging and electrophysiological studies (Herrmann et al. 2004; Kerns et al.
2004); for review articles see (Beldzik et al. 2015; Botvinick et al. 2004; Cole et al.
2009). However, early single neuron recording experiments in monkeys failed to
demonstrate such a role for ACC in non-human primates (Ito et al. 2003; Johnston et al.
2007). Similarly, single unit recordings in humans did not provide convincing support in
favor of the presence of conflict-related signal in the ACC (Davis et al. 2005; Sheth et al.
2012). Indeed, these studies proposed a performance monitoring role or a more general
top-down role for the ACC rather than conflict monitoring (Hayden et al. 2011; Ito et al.
2003; Johnston et al. 2007). A great deal of effort has been made to describe the
discrepancy between results from human studies showing a conflict-monitoring role for
ACC with studies that failed to replicate these results. Some researchers suggested that
the ACC in the non-human primates might not be the homologous area for human ACC
and there are fundamental neuroanatomical differences between the human and monkey
ACC (Cole et al. 2009). Other studies pointed towards methodological differences
between the experiments conducted in humans and monkeys. For instance, most of the
monkey single unit studies that failed to find conflict-monitoring signal in the ACC used
generalize the findings from the oculomotor tasks to other motor systems. Furthermore,
these studies used go/no-go or task-switching paradigms that might not be truely
equivalent to the Stroop task. In a recent study, the investigators employed a Stroop-like
task, which induced conflict both at the stimulus level and response level (Michelet et al.
2016). The authors were able to demonstrate conflict-related signal in the ACC and
provided evidence that the ACC in humans and non-human primates could be
homologous areas.
So far I have discussed the ACC’s role in conflict monitoring. There are also
several studies suggesting a performance monitoring role for the ACC. Below, I will
briefly review some of theses studies.
1.1.4.4. ACC and performance monitoring:
Numerous models have been proposed with regards to the dynamics of optimized control
of behavior to obtain favorable outcomes. According to the Actor-Critic models, the critic
predicts the reward and expected outcome based on the actions performed and
information obtained from the environment. This estimated reward is subsequently
compared with the actual reward obtained. Any unexpected discrepancy between the
expected and actual outcomes triggers a signal used by the Actor to adjust the subsequent
behavior and maximize the favorable outcome (Montague et al. 2004; Procyk et al.
2008). The involvement of the ACC in monitoring the behavioral outcomes and valuating
the actions is ubiquitous in the cognitive control literature, and performance monitoring
signals have been documented in the ACC (Carter and van Veen 2007; Ito et al. 2003;
Quilodran et al. 2008). In this context, ACC could be perceived as the “Critic”
orbito-frontal cortex sends performance monitoring-related signals to the locus coeruleus
(Aston-Jones and Cohen 2005). The locus coeruleus subsequently modulates the activity
of lateral prefrontal cortex neurons via adrenergic projections to influence the animal’s
behavior (Aston-Jones and Cohen 2005). Furthermore, the ACC has dopaminergic
connections to mesencephalic areas such as the ventral tegmental area (Divac et al.
1978). These connections might mediate the sensation of reward and reinforce the
behavior following the correct behavioral performance (Watanabe 1990).
ACC and dl-PFC work in concert to provide efficient control of behavior. In a
study previously conducted in our lab, it has been shown that the activity of ACC neurons
increase in the first trials of a block in a task-switching paradigm (Johnston et al. 2007).
In each block, the task rule switched without any previous cue to the monkey and the
only way the monkey notices the rule-change is by making repeated performance errors.
It was suggested that ACC detects the performance errors and participates in cognitive
control in the first trials following the task switch. Thereafter, dl-PFC neurons increase
their activity to provide the necessary control signals and maintain the new task rule to
maximize the reward (Johnston et al. 2007). The dense reciprocal connectivity between
ACC and PFC supports the notion that these areas act in concert to control behavior
(Bates and Goldman-Rakic 1993; Paus et al. 2001).
The role of ACC in performance monitoring can be explained not only by
detection of errors but also by the detection of unexpected reward and positive feedback
(Amiez et al. 2006; Toda et al. 2012). It has been shown that the firing rate of ACC
neurons is modulated based on the amount of reward obtained by the monkeys (Amiez et
reflects the representations of expected reward values in sequential behaviors as well as
the negative and positive feedbacks used in adapting such behaviors (Procyk et al. 2000).
The ultimate goal of detecting reward or any other sort of feedback could be realized in
the context of influencing the actions to produce the maximized favorable outcomes.
ACC could play an ideal role in this respect because it could integrate the reward-related
activity into the motor commands due to the simultaneous presence of reward and
motor-related signals in the ACC. In fact, it has been shown that the spatial selectivity of ACC
neurons can be modulated by reward value (Kennerley and Wallis 2009).
Shenhav and colleagues have recently proposed a model of the “expected value of
control (EVC)” (Shenhav et al. 2013). According to this model, three factors should act
in concert to produce the most favorable outcome. First, the current state of the organism
should be determined and the expected outcomes of the behavioral alternatives be
estimated. The conflict and/or performance monitoring functions of the ACC fit this
component of the EVC model. Second, the amount of control signal required to perform
each alternative should be evaluated. Further, the system should integrate the expected
value of the behavioral alternatives in the selection process. Indeed, it has been shown
that the value signals and task-selective signals are simultaneously represented in ACC
neuronal activity (Hayden and Platt 2010; Kaping et al. 2011). Third, the final decision
should be made not only based on the expected value of the action but also the cost of the
control required to perform a certain action. It has been shown that the ACC is also
involved in computing the cost of control, i.e. in computing the estimated amount of
cognitive effort an organism requires to correctly perform a task (Magno et al. 2006;
neuronal activities observed in the ACC and these processes could be conducted in
parallel (Rushworth et al. 2012).
1.2. SACCADES AND THE OCULOMOTOR SYSTEM:
Saccades are the fast eye movements that align the fovea on the objects of interest in the
environment (Gilchrist 2011). The oculomotor system consists of a number of cortical
and subcortical areas that control the performance of saccades in response to behavioral
demands. This system is the best-studied motor system in primates due to the simplicity
of tracking eye movements and advancements in the neuronal recording techniques
(Johnston and Everling 2008). Furthermore, there are only 12 extra-ocular muscles in
both eyes (Gray and Russo 2008) that generate saccades, which simplifies the study of
saccade system. Moreover, the saccade generators are located in the brainstem (Hepp and
Henn 1983) and electrophysiological recordings are easier to perform in brainstem than
in spinal cord. The saccade network is comprised of a number of cortical and subcortical
areas that display functional and structural connectivity. Some of the cortical areas
involved in saccade generation and saccade control are the frontal eye fields (FEF),
lateral intraparietal area (LIP), and dorsolateral prefrontal cortex (Bruce and Goldberg
1985; Funahashi et al. 1991; Shibutani et al. 1984). FEF is more directly involved in
saccade generation whereas more anterior prefrontal structures are mainly involved in
saccade control (Bruce et al. 1985; Funahashi et al. 1991). These areas send neuronal
projections to the midbrain structure superior colliculus (SC) in which the neurons have
prominent saccade-related activity (Selemon and Goldman-Rakic 1988; 1985). The SC
As mentioned above, the oculomotor network consists of cortical and subcortical
areas that are primarily involved in saccade generation. Other cortical areas, in particular
the prefrontal cortex, are involved in the top-down modulation of the saccadic eye
movements. Depending on the goals of a research project, different components of the
oculomotor network can be explored including the higher cognitive functions. For
instance, saccades and oculomotor system have been used to investigate attention,
reward, and decision making (Kennerley et al. 2006; Moore and Armstrong 2003; Sato
and Schall 2003; Sugrue et al. 2004). Also, saccadic eye movements have been used to
identify the cognitive impairments in patients with psychiatric and neurologic
impairments (Broerse et al. 2001; Leigh and Zee 2006). Patients with schizophrenia
exhibit impairments in the anti-saccade task performance that requires the subjects to
perform a saccade to the opposite location of a peripheral visual stimulus (Broerse et al.
2001; Fukushima et al. 1990). The memory-guided saccade task and anti-saccade task
will be discussed in further detail in below.
1.2.1. Frontal eye fields:
FEF is located in the rostral bank of the arcuate sulcus in nonhuman primates. There is
also an analogous FEF in human frontal cortex located in the junction of the superior
frontal sulcus and superior precentral sulcus (Paus 1996; Schall 2015). Early studies have
shown that micro-stimulation of the FEF with very low threshold currents (<50 µAmp)
can trigger saccades (Bruce et al. 1985). The amplitude of the electrically evoked
saccades follows a certain anatomical pattern. Stimulation of the more medial FEF sites
elicits saccades with larger amplitude and lateral FEF sites give rise to smaller amplitude
anatomical connectivity with parietal and temporal areas. Schall and colleagues
demonstrated that the medial FEF has structural connectivity with areas in the parietal
cortex and dorsal visual stream whereas the lateral FEF has connectivity with temporal
areas and ventral stream of visual processing as shown in Figure 1.2 (Schall et al. 1995).
Furthermore, the same study demonstrated that lateral FEF receives inputs from
retinotopic areas with foveal representations whereas medial FEF receives projections
from peripheral representations of the retinotopically organized cortical areas (Schall et
al. 1995; Ungerleider et al. 2008).
The dorsal stream of visual processing is responsible for spatial vision and
visually-guided motor responses, and the major role of the ventral stream of visual
processing is object perception and identification (Goodale and Milner 1992). The
response field of visual neurons in the FEF follows a similar pattern as for saccades, i.e.
the peripheral visual field is represented in the medial FEF and central visual field in the
more lateral FEF (Suzuki and Azuma 1983). In this regard, it can be postulated that the
connectivity between medial FEF and the dorsal visual stream is mainly involved in the
motor planning of the eye movements; because medial FEF generates a larger range of
eye movements. The lateral FEF, which generates smaller saccades, is mainly connected
with the ventral visual stream to aid in a more detailed and meticulous examination of the
objects of interest in the environment. A more detailed description of the functional
connectivity of the FEF is discussed in the second chapter. Apart from its prominent role
in saccade generation, FEF is also involved in a multitude of actions such as visual
search, target selection, and transformation of visual signals to saccade commands, which
Figure 1.2.Summary of major connections of FEF with visual cortical areas.
The location of specific cortical areas is indicated on a dorsolateral view of the macaque brain. The relative amplitude of saccades represented by ventral FEF (area 45) and dorsal FEF (urea 8Ac) is indicated. The solid blue lines indicate major projections to area 8Ac, and the dashed red lines represent major projections to area 45.
1.2.2. Frontal eye fields and visual functions:
As mentioned above, FEF has significant connectivity with cortical visual areas and there
is a plenty of evidence suggesting the presence of visual signals in the FEF (Bruce and
Goldberg 1985). Some neurons in the FEF respond exclusively to the visual stimuli
appearing in their response field (visual neurons) and some FEF neurons increase their
activity both in response to visual stimuli and saccades (visuo-movement neurons) (Bruce
and Goldberg 1985). Therefore, the FEF is considered to be a visual and motor area.
The visual neurons in the FEF do not exhibit feature selectivity unless under
restricted training conditions (Peng et al. 2008). However, the presence of both visual and
saccade-related signals in the FEF makes it an ideal candidate for transformation of the
visual signals into saccade (and/or gaze) commands. In fact, it has been shown that the
FEF performs a preliminary visual-motor transformation and further transformation into
motor frames occurs in downstream subcortical areas (Sajad et al. 2015). Moreover, it
was shown that FEF is also involved in memory to motor transformation, although this
transformation is imperfect (Sajad et al. 2016). Additionally, the FEF has been implicated
in guiding saccades to moving objects through modulation of the pre-saccadic activity in
relation to target velocity (Cassanello et al. 2008). All this evidence indicates that FEF
receives information related to visual stimuli, processes this information, and relays it to
other areas for further processing.
discriminate a visual target among distractors (Gregoriou et al. 2012; Schall 2015; Zhou
and Desimone 2011). In visual search paradigms, the visual neurons in the FEF primarily
respond to the array of visual stimuli in a non-selective manner. However, prior to the
initiation of the saccade towards the target stimulus, these neurons display increased
activity when the target falls into their response field compared to the distractors
(Thompson et al. 1996; Thompson and Schall 2000). The target selection process in the
FEF involves spike-field coupling mechanisms as well as spike timing competition and
cooperation (Cohen et al. 2010; Gregoriou et al. 2012). A causal effect of FEF in visual
search has been proved in studies where the target selection was impaired following the
inactivation of the FEF (Wardak et al. 2006).
Further evidence with regards to the top-down control role of the FEF comes from
the studies of covert spatial attention. Covert spatial attention occurs when humans or
non-human primates attend to an object or a stimulus in the peripheral visual field
without shifting their gaze towards that stimulus (Posner 1980). According to the
premotor theory of attention, covert spatial attention originates from latent eye movement
activity despite absence of an apparent saccade or eye movements (Moore and Armstrong
2003; Rizzolatti et al. 1987). However, Thompson and colleagues used a spatial attention
task that did not require monkeys to preform a subsequent saccade towards the location
of the covertly attended target (Thompson et al. 2005). The authors concluded that the
activity of the visual neurons that signal spatial attention was independent of the saccade
command signals (Thompson et al. 2005). In a separate study, it was shown that electrical
micro-stimulation of the FEF by currents below the threshold needed to elicit saccades
Interestingly, this enhancement was observed when the response fields of the FEF and V4
sites matched. In the experiments in which the response fields of the FEF and V4 sites
were different, the FEF stimulation led to suppression of the activity of the V4 neurons
(Moore and Armstrong 2003). This evidence suggests that although FEF can be
considered a motor area with a prominent saccade generation role, it also exerts influence
on other cortical and subcortical areas.
As noted above, there are multiple cortical and subcortical areas that are involved
in saccade control. FEF is a saccade generating area with connectivity to other cortical
and subcortical areas. In this project, I was interested in the mechanisms by which higher
cortical areas exert control on generation of saccades. I utilized a memory-guided saccade
task and pro-/anti-saccade task to study cognitive saccade control that will be discussed
in below.
1.2.3. Memory-guided saccade task:
This task is used to examine the short-term memory and/or working memory (Johnston
and Everling 2008). In this task, the subject fixates at a central fixation point for a period
of time, then a target stimulus is presented briefly in a peripheral location. However, the
subject is instructed to maintain fixation during the target stimulus presentation and
during the subsequent delay period. The delay period can vary between a few hundred
milliseconds to a few seconds depending on the study design (Hutton 2008). The offset of
the central fixation point signals the subject to perform a saccade towards the
remembered target location. Different brain areas have been shown to be involved in
dl-(Funahashi et al. 1991; 1990). The activity of dl-PFC neurons exhibit spatial tuning, i.e.,
the neurons’ firing rate is highest when they perform a saccade towards a certain target
location which is generally biased towards the contralateral space (Funahashi et al. 1991).
Also, the direction towards which the neurons exhibit maximal visual response appears to
correspond with that of the delay and saccadic epochs (Funahashi et al. 1989; 1991;
1990). Similar neuronal responses across different epochs of the memory-guided saccade
task have been observed in other brain areas such as FEF, lateral intraparietal area (LIP)
and superior colliculus (SC) (Colby et al. 1996; Pare and Wurtz 1997; Schall 2015).
However, there are slight differences in the activation pattern of different brain areas. For
instance, the percentage of neurons with visual response is higher in LIP than dl-PFC and
the opposite is true for the saccadic activity (Johnston and Everling 2008). The neuronal
signals related to different epochs of memory-guided saccade task is shown to be sent
from FEF (Sommer and Wurtz 2000; 2001), LIP (Pare and Wurtz 1997), and dl-PFC
(Johnston and Everling 2006) to SC. Therefore, it can be concluded that coordinated
neuronal activity in these areas is necessary for correct performance of the
memory-guided saccade task. Furthermore, other areas might also be involved in performance on
this task. For example a network of fronto-parietal areas was activated during
memory-guided saccade performance (Brown et al. 2004). Further studies could reveal more
information in this regard.
1.2.4. Pro-/Anti-saccade task:
The pro-saccade task is interchangeably called the visually-guided saccade task. In this
task, a central fixation point appears for a certain period and subsequently the target
saccade towards the target stimulus (Hutton 2008). There are different variations of the
pro-saccade task. In the step task, the onset of the target stimulus and offset of the central
fixation point occur simultaneously, whereas in the overlap task, the central fixation point
remains illuminated. In the gap task, the central fixation point disappears before the target
stimulus is presented (Hutton 2008). Saccadic reaction time is significantly lower in gap
tasks and higher in overlap tasks compared to step trials (Reuter-Lorenz et al. 1991). This
finding is generally referred to as the “gap effect” (Saslow 1967). One explanation for the
gap effect is that in gap trials, the attention is disengaged from the fixation point before
the appearance of the target stimulus and therefore, there is less time needed to
re-allocate the attention towards the stimulus, although this notion has been challenged in
some studies (Dorris et al. 1997). The pro-saccade task elicits a relatively automatic and
prepotent response and pro-saccade performance does not appear to employ a great deal
of cognitive resources. The anti-saccade task can address this shortcoming of the
pro-saccade task.
The anti-saccade task was first introduced by Peter Hallet (Hallett 1978). This
task can probe the top-down control. Similar to pro-saccades, the participants fixate at a
central fixation point and then a peripheral target stimulus appears. In the anti-saccade
task, the participants are instructed to look towards the mirror location of the target
stimulus on the screen (Munoz and Everling 2004). In order to correctly perform this
task, the participants have to suppress an automatic saccade towards the stimulus,
transform the prepotent saccade vector (pro-saccade) to the opposite movement vector
(anti-saccade), and generate a voluntary saccade command (Munoz and Everling 2004).
including the dl-PFC, FEF, SEF, and SC (Munoz and Everling 2004). For instance, single
neurons with saccade related activity in FEF and SC decreased their firing rate before the
initiation of anti-saccades whereas fixation neurons in these areas increased their activity
before anti-saccades (Everling et al. 1999). The source of inhibitory signal that leads to
decreased firing of the saccadic neurons in the FEF and SC appears to be in dl-PFC and
the extensive projections from the dl-PFC to SC (Leichnetz et al. 1981) and FEF
(Selemon and Goldman-Rakic 1988) support this notion. However, a study conducted in
our lab showed that dl-PFC does not appear to suppress the saccade-related activity of SC
neurons (Everling and Johnston 2013; Johnston et al. 2014). Other possible sources of the
inhibitory signal to the FEF and SC could be the supplementary eye fields and substantia
nigra pars reticulata (Munoz and Everling 2004).
The signal for saccade vector inversion in the anti-saccade task might originate in
the lateral intraparietal area (LIP) (Munoz and Everling 2004; Zhang and Barash 2004).
Certain neurons in area LIP were identified that became active when the saccade vector
but not the visual stimulus were aligned on their response field (Zhang and Barash 2000).
However, the response latency of these neurons was about 50 ms following the target
stimulus onset that corresponds with the latency for visual neurons in the LIP. The
authors argued that the presence of this response could be indicative of a re-mapped
visual response that could contribute to the saccade vector inversion in anti-saccade task
(Zhang and Barash 2000; 2004).
Other brain areas might also be involved in the response inhibition and saccade