Western University Western University
Scholarship@Western
Scholarship@Western
Electronic Thesis and Dissertation Repository
8-4-2015 12:00 AM
Signal Processing Methods for Quantitative Power Doppler
Signal Processing Methods for Quantitative Power Doppler
Microvascular Angiography
Microvascular Angiography
Mai H. Elfarnawany
The University of Western Ontario
Supervisor
James C. Lacefield
The University of Western Ontario
Graduate Program in Biomedical Engineering
A thesis submitted in partial fulfillment of the requirements for the degree in Doctor of Philosophy
© Mai H. Elfarnawany 2015
Follow this and additional works at: https://ir.lib.uwo.ca/etd
Part of the Bioimaging and Biomedical Optics Commons, Biomedical Devices and Instrumentation Commons, and the Other Biomedical Engineering and Bioengineering Commons
Recommended Citation Recommended Citation
Elfarnawany, Mai H., "Signal Processing Methods for Quantitative Power Doppler Microvascular Angiography" (2015). Electronic Thesis and Dissertation Repository. 3106.
https://ir.lib.uwo.ca/etd/3106
This Dissertation/Thesis is brought to you for free and open access by Scholarship@Western. It has been accepted for inclusion in Electronic Thesis and Dissertation Repository by an authorized administrator of
SIGNAL PROCESSING METHODS FOR QUANTITATIVE POWER DOPPLER MICROVASCULAR ANGIOGRAPHY
(Thesis format: Integrated Article)
by
Mai Hafez El-Khaled Elfarnawany
Graduate Program in Biomedical Engineering
A thesis submitted in partial fulfillment of the requirements for the degree of
Doctor of Philosophy
The School of Graduate and Postdoctoral Studies The University of Western Ontario
London, Ontario, Canada
Abstract
Operator-dependent instrument settings and the likelihood of image artifacts are two challenges for reliably using three-dimensional (3-D) power Doppler angiography in flow depiction and quantification applications.
To address the operator-dependent settings challenge, an automated method for wall filter cut-off selection, the wall filter selection curve (WFSC) method, was developed using flow-phantom images. The flow-phantom WFSCs guided the development of a theoretical signal model relating color pixel density (CPD) and wall filter cut-off frequency. Simulations using the theoretical model were used to define criteria for the WFSC method to be applied to unprocessed power Doppler signals from 3-D vasculature. The adapted WFSC method was combined with a 3-D skeletonization and vessel network reconstruction method to present a two-stage processing method aimed at improving vascular detection, visualization and quantification. The two-stage method was evaluated using two in vivo models; a murine tumor model was used to test the performance of the method in a flow quantification application and a chick embryo chorioallantoic membrane (CAM) model was used to evaluate the method’s value for flow depiction applications.
qualitative and quantitative studies using 3-D power Doppler angiography to assess vascular networks for flow depiction and quantification.
Keywords:
Co-Authorship Statement
Chapter 2 was published in Ultrasound in Medicine and Biology as: M.
Elfarnawany, S. Z. Pinter, and J. C. Lacefield, "Improved objective selection of power
Doppler wall-filter cut-off velocity for accurate vascular quantification," Ultrasound Med. Biol., vol. 38, p. 1429, 2012. All authors contributed to editing the paper. The flow-phantom images used to evaluate the presented method were acquired by Stephen Pinter, a former Ph.D. student in Dr. Lacefield’s laboratory. I redesigned the original wall filter selection curve method developed by Dr. Pinter by developing the automatic characteristic-interval detection and the cut-off frequency selection algorithms. I developed image processing methods and segmented the flow-phantom images to create reference masks for method evaluation. I tested the new method by applying to the flow phantom images and conducted analysis and statistical comparisons on the produced data. I worked on this project under the supervision of Dr. Lacefield.
Chapter 3 was published in SPIE Conference Proceedings as: M. Elfarnawany and J. C. Lacefield, "A new three-component signal model to objectively select power Doppler wall filter cut-off velocity for quantitative microvascular imaging," Proc. SPIE, vol.8670, article 86750J, 2013. Both authors contributed to editing the paper. For this paper, I developed the new signal model by constructing its equations and defining its constituting distributions. I developed the cost function used as a reference for the optimum cut-off selection. I conducted the simulations using the new model and performed all analysis and statistical comparisons on the simulation results. I worked on this project under the supervision of Dr. Lacefield.
Chapter 4 is in preparation to be submitted to: Ultrasound in Medicine and Biology
as: M. Elfarnawany, M. R. Lowerison, M. N. Hague, A. F. Chambers and J.C. Lacefield, “A
models. The power Doppler and contrast-enhanced ultrasound (CEUS) images of the tumor vasculature used in this study were acquired by Matthew, who was also responsible for computing CEUS quantification metrics. I was responsible for the development power Doppler processing software to produce 3-D images from quadrature demodulated data exported from the scanner. I developed and incorporated the two-stage method and power Doppler quantification metrics computations in the Doppler processing software. I processed and segmented all the acquired tumor power Doppler images and performed all post-analysis and statistical comparisons on resulting images and quantification. I worked on this project under the supervision of Dr. Lacefield.
Chapter 5 is in preparation to be submitted to IEEE Transactions on Medical Imaging
as: M. Elfarnawany, N. Govindaraju, S. Pardhan, A. Makela, P. Foster, H. S. Leong, J. C.
Lacefield, “Improving microvascular depiction in three-dimensional power Doppler ultrasound using a two-stage processing method,.” Nivitha Govindaraju, a summer student in Dr. Lacefield’s laboratory, and I worked on developing the optical image processing methods. Siddika Pardhan, a laboratory assistant in Dr. Leong’s laboratory at the time, prepared the ex ovo chick embryo based on the protocol developed in Dr. Leong’s laboratory. Ashley Makela, an Ontario-licensed sonographer and a master’s student in Medical Biophysics and a member of Dr. Fosters laboratory, help set up the power Doppler instrument settings during image acquisition sessions. I was responsible for conducting the experiment including transporting the chick embryos, experimental setup and image acquisition. I processed all the acquired power Doppler images and made all diameter measurements of the imaged vascular network. I performed all post-analysis and statistical comparisons on processed images and measurements. I worked on this project under the supervision of Dr. Lacefield.
This thesis is dedicated to the shining lights in my path,
my son, Belal, my husband, Karim, my mother,
Acknowledgments
These last five years mark a transformational phase of my life during which I was privileged to meet and work with many fantastic people from the Robarts Research Institute and Western University communities.
First of all, I’d like to acknowledge my supervisor, Dr. James Lacefield, for giving me the freedom to explore, develop and tune my research directions while maintaining the balance of continuous follow-up on my progress. Dr. Lacefield has always been very supportive of my work and has enriched my experience as a graduate student with needed skills to lead a fruitful career after graduation. He always encouraged me to present my progress in conferences and he has a major role in developing my writing skills. With Dr. Lacefield’s passion for teaching what he knows best, I have learned during the time I spent in his lab about ultrasound way beyond the scope of my project and more than what I have learned during all my undergraduate years.
I would like to thank my advisory committee: Dr. Tamie Poepping, Dr. Ting-Yim Lee, and Dr. Kevin Shoemaker. They were available to answer questions when needed and have provided insightful suggestions and comments that helped guide my research direction and design suitable studies for a smooth transition between my project phases. Dr. Poepping has also played the role of a supportive mentor and friend.
welcome help. Special thanks to Nivetha Govindaraju, our summer student who helped develop image-processing algorithm for the study in Chapter 5. Her enthusiasm, fast learning and speedy progress made working with her a delightful experience. I wish her luck in her future steps and career.
A thank you to our collaborators and co-authors from Dr. Ann Chambers, Dr. Hon Leong and Dr. Paula Foster labs. Special thanks to Nicole Hague from Dr. Chamber’s lab who helped with the mouse model used in Chapter 4 and to Siddika Pardhan from Dr. Leong’s lab who prepared and monitored the development of the chick embryo model used in Chapter 5. The study in Chapter 5 would not have been completed without the help of our licensed sonographer, Ashley Makela from Dr. Foster’s lab who helped set the gold standard for the study in Chapter 5 by setting up the scanner using the set of optimum machine settings.
Thank you to Darlene Goodine for all the administrative help and guidance when I first joined Robarts. To Christine Ellwood, the current Biomedical Engineer Program Coordinator for her administrative help. An enormous thanks to our famous past BME coordinator, Diana Timmermans. Diana made the BME program run smoothly and was always there for students no matter when or for what. She played an important role in helping me apply for this program and matching my research interests with Dr. Lacefield’s lab research focus. Diana was a fantastic person to work with and an even better person to get to know as a friend. I would like to add a thank you to Ann Leaist; we’ve spent most of the past few years in the same area in Robarts and she has always added a bit of cheer to the day and I will surely miss her occasional treats and chocolates.
I would like to acknowledge my funding sources over the years. I was funded by the Ontario Graduate Scholarships for 2011-2012 and by the National Science and Engineering Research Council from 2012 to 2015. I would also like to acknowledge funding and support from the UWO CIHR Strategic Training Program and the Western Graduate Research Scholarship.
To my friends who supported me and listened attentively to my stories of success or failure and gave me advice to help me keep going. To my best friend and true sister, Mariam El-feky who has always been and will continue to be my secret-keeper and my representative in all the events I have missed in Egypt while working on this degree. Your weekly phone call was like the fuel that keeps me motivated for the following week. A special thanks to my great friend Somiraa Said, who was my go to academic source of information and advice and my true friend away from home. Thank you for accepting to join me in my random spurts of having dinner out or going for ice-cream or even middle of the day shopping sprees. You and your amazing family have really filled the void of having family friends away from home.
Lastly but certainly not least, to my husband Karim and my baby Belal. Karim, you are my partner on this path to our common ultimate goal, my friend, and my sole mate. I can never ever thank you enough for being the main role player in my Ph.D. story. For all your support and patience, for listening to my presentation rehearsals hundreds of times and accompanying me on all my conference trips. and for proof reading my articles. For helping with Belal and accepting the occasional “Let’s order pizza” suggestions. For being so encouraging that you even know all the details of my work to the level that you can present it in a conference!. You were there all through and especially these last few months, your patience and understanding cannot be ever thanked enough. For Belal, my baby who spent long days in daycare since he was just six months old. Thank you Belal for letting me finish this degree and always motivating me with your happiness and laughter. You have added so much light to our life and filled our days with purity and unprecedented sense of accomplishment as we saw you grow, walk, talk and play. May you always be one of the righteous and grow to be an amazing man like your father.
And certainly, All praise is due to Allah the most Gracious the most Merciful.
Table of Contents
Abstract... ii
Co-Authorship Statement ... iv
Acknowledgments ... vii
Table of Contents ... xi
List of Tables ... xvi
List of Figures... xvii
List of Symbols ... xx
List of Acronyms and Abbreviations ... xxii
Chapter 1 ... 1
1 Introduction... 1
1.1 Overview... 1
1.2 The Age of Vascular Imaging... 2
1.3 Vascular Imaging Techniques... 2
1.3.1 X-Ray Catheter Angiography ... 3
1.3.2 Computed Tomography (CT) Angiography ... 3
1.3.3 Magnetic Resonance Angiography (MRA) ... 3
1.3.4 Ultrasound... 4
1.4 Overview of Doppler Ultrasound Imaging ... 5
1.4.1 The Doppler Equation... 5
1.4.2 Continuous-wave (CW) and pulsed-wave (PW) Doppler ... 6
1.4.3 Principles of Doppler Color Flow Imaging (CFI)... 7
1.5 Power Doppler Imaging Applications ... 13
1.5.2 Vascular Quantification Applications... 15
1.6 Challenges in Power Doppler Imaging ... 17
1.6.1 Operator-Dependant Instrument Settings ... 17
1.6.2 Image Artifacts... 19
1.7 Attempts to Overcome Challenges ... 23
1.7.1 Optimizing Instrument Settings using Flow Phantoms ... 23
1.7.2 Developing Application-Based Instrument Settings Standard ... 23
1.7.3 Optimizing Wall / Clutter Filter Processing ... 24
1.7.4 Image Post-Processing Methods to Reduce Artifacts... 25
1.8 Hypothesis and Objectives... 26
1.9 Thesis Outline ... 27
References... 30
Chapter 2 ... 41
2 Improved objective selection of power Doppler wall-filter cut-off velocity for accurate vascular quantification... 41
2.1 Introduction... 41
2.2 Materials and Methods... 45
2.2.1 Dividing an ROI into subregions ... 45
2.2.2 Detection of characteristic intervals in a WFSC... 46
2.2.3 Selection of operating cut-off velocity along a characteristic interval ... 49
2.2.4 ROI reconstruction... 50
2.2.5 Power Doppler image acquisition... 50
2.2.6 Performance analysis of WFSC method ... 52
2.3 Results... 53
2.3.1 Characteristic interval detection ... 53
2.3.3 Reconstructed images ... 56
2.4 Discussion ... 57
2.5 Conclusion ... 63
References... 65
Chapter 3 ... 68
3 A new three-component signal model to objectively select power Doppler wall filter cut-off velocity for quantitative microvascular imaging... 68
3.1 Introduction... 68
3.2 Materials and Methods... 71
3.2.1 Revised Mathematical Model ... 71
3.2.2 Cost Function... 74
3.2.3 Generation of Simulated WFSCs and Cost Functions... 75
3.2.4 Performance Analysis of the WFSC Method... 76
3.3 Results... 79
3.3.1 Revised Mathematical Model ... 79
3.3.2 Performance Analysis of the WFSC Method... 80
3.4 Discussion ... 85
3.5 Conclusion ... 90
References... 91
Chapter 4 ... 93
4 A two-stage process to improve quantitative three-dimensional power Doppler angiography of tumor microvasculature ... 93
4.1 Introduction... 93
4.2 Materials and Methods... 96
4.2.1 Experimental Image Acquisition ... 96
4.2.4 Applicability of WFSC method to tumor vascular imaging ... 98
4.2.5 Effect of WFSC method and skeletonization on vascular network visualization ... 100
4.2.6 Effect of WFSC method and skeletonization on vascular quantification100 4.3 Results... 103
4.3.1 Characteristics of WFSCs for tumor images ... 103
4.3.2 Histograms of WFSC-selected cut-off frequency... 103
4.3.3 Longitudinal variability of WFSC-selected cut-off frequency ... 106
4.3.4 Vascular features corresponding to WFSC-selected cut-off frequency.. 107
4.3.5 Effect of WFSC method and skeletonization on vascular network visualization ... 108
4.3.6 Effect of WFSC method and skeletonization on vascular quantification109 4.4 Discussion ... 112
4.5 Conclusion ... 120
References... 121
Chapter 5 ... 125
5 Improving microvascular depiction in three-dimensional power Doppler ultrasound using a two-stage processing method... 125
5.1 Introduction... 125
5.2 Material and Methods ... 127
5.2.1 Materials ... 127
5.2.2 Experimental protocol... 128
5.2.3 Image acquisition ... 128
5.2.4 Image processing ... 129
5.2.5 Data analysis ... 134
5.2.6 Statistical analysis... 135
5.3.1 Vessel detection and visualization ... 136
5.3.2 Level of striping artifact... 139
5.3.3 Accuracy of diameter measurement... 140
5.4 Discussion ... 146
5.5 Conclusion ... 151
References... 152
Chapter 6 ... 157
6 Summary and Future Work... 157
6.1 Summary ... 157
6.1.1 Chapter 2: Improved objective selection of power Doppler wall-filter cut-off velocity for accurate vascular quantification ... 157
6.1.2 Chapter 3: A new three-component signal model to objectively select power Doppler wall filter cut-off velocity for quantitative microvascular imaging ... 158
6.1.3 Chapter 4: A two-stage process to improve quantitative three-dimensional power Doppler angiography of tumor microvasculature ... 159
6.1.4 Chapter 5: Improving microvascular depiction in three-dimensional power Doppler ultrasound using a two-stage processing method ... 159
6.2 Future Work ... 160
6.3 Final Remarks ... 161
References... 162
Appendix A: Copyright Agreements... 163
Appendix B: Ethics Approval for Animal Subjects... 164
List of Tables
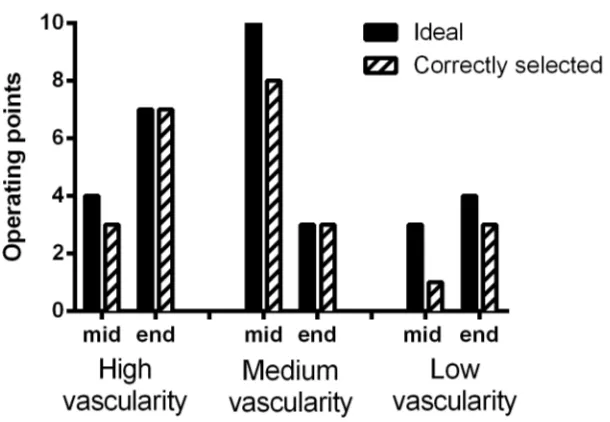
Table 2-1: Variation of selected cut-off velocities among subregions of high, medium, and low vascularity ROIs... 56
Table 2-2: Relative accuracy of quantification of blood flow for high, medium, and low vascularity ROIs... 57
Table 3-1: Ranges of variation of vascular parameters for the numerical analysis ... 76
Table 4-1: Effect of WFSC and skeletonization algorithms on power Doppler quantification metrics, VI, FI and VFI for overall and intra-tumor vasculature... 111
Table 4-2: Correlation between power Doppler and CEUS quantification for overall and intra-tumor vasculature. ... 112
Table 5-1: Number and sizes of vessels depicted in two-stage processed images only. ... 138
List of Figures
Figure 1-1: Doppler effect: (a) the frequency of the reflected ultrasound wave from a moving target (red blood cells (RBC)) is different than the transmitted wave... 6
Figure 1-2: A sample block diagram of Doppler color flow imaging system constituting of 2 sections: (a) Doppler Signal acquisition section and (b) Doppler Signal Processing... 7
Figure 1-3: Illustration of hypothetical Doppler signal frequency spectrum... 11
Figure 1-4: Sample Doppler color flow images of human right kidney using (a) color Doppler display mode showing only large vessels and (b) power Doppler mode... 14
Figure 1-5: An example of a commercial power Doppler system (Vevo2100, VisualSonics, Toronto, Canada) user panel ... 19
Figure 1-6: Blooming artifact in a power Doppler image... 20
Figure 1-7: Jail bar artifact in a power Doppler image... 22
Figure 2-1: Theoretical wall-filter selection curve (Eqn 2-1) for a region of interest
containing two vessels. ... 44
Figure 2-2: Iterative detection of characteristic intervals. ... 48
Figure 2-3: Flow chart for selection of an operating point cut-off velocity along a
characteristic interval. ... 51
Figure 2-4: Image improvement produced by the redesigned wall filter selection curve
(WFSC) method. ... 54
Figure 2-5: Analysis of accuracy of the selection of operating point cut-off velocity. ... 55
Figure 2-7: Effects of non-uniform and insufficient sampling of the wall filter selection curve (WFSC) ... 60
Figure 3-1: Theoretical wall filter selection curves (blue lines) fitted to experimental
multiple-vessel flow-phantom data... 74
Figure 3-2: A sample cost function (solid line) is produced from a weighted combination of false-positive (dashed line) and false-negative (dotted line) error fraction ... 75
Figure 3-3: The mean interval detection error (solid line) plotted as a function of the number of samples. ... 80
Figure 3-4: The correspondence between operating cut-off velocity selections using the automatic algorithm and the perfect binary selection method. ... 82
Figure 3-5: The relative vascular quantification error using the automatic algorithm as a function of the CPD value at the optimum cut-off velocity... 83
Figure 3-6: Theoretical distribution of the vascular quantification error as a function of the interval length ... 84
Figure 3-7: Theoretical distribution of the vascular quantification error as a function of the minimum cut-off velocity ... 85
Figure 4-1: Sample WFSC curves constructed from (a) a multiple-vessel flow phantom and (b) an in vivo murine tumor model.. ... 104
Figure 4-2: Variability of WFSC-selected cut-off frequency in 3-D images. ... 105
Figure 4-3: Longitudinal variations in cut-off frequency histograms as tumors grow ... 106
Figure 4-4: Longitudinal comparison of vascular features in the low and high-cut-off
frequency portions of the 3-D vascular network identified using the WFSC method... 108
Figure 4-6: Longitudinal trends of power Doppler quantification metric: ... 119
Figure 5-1: A sample optical photograph showing (a) the full vascular network of the chick embryo chorioallantoic membrane (CAM)... 130
Figure 5-2: CAM optical image processing method with samples of results obtained at
different stages of processing... 132
Figure 5-3: Improved vessel detection and visualization in images processed using our two-stage method versus commercial scanner (Vevo 2100) processed images... 137
Figure 5-4: Improved vessel detection and visualization in 3-D images processed using our two-stage method versus commercial scanner (Vevo 2100) ... 139
Figure 5-5: Quantified level of artifact from images processed using the two-stage method versus the commercial scanner (Vevo 2100) software for different animals. ... 141
Figure 5-6: Comparison of the distributions of diameter measurement percentage errors from all 83 vessels ... 143
Figure 5-7: Separate comparisons of the distributions of diameter measurement percentage errors for (a) arteries and (b) veins ... 145
List of Symbols
fr the reflected ultrasound frequency
f0 the ultrasound transmit frequency
v the target velocity
θ
the angle between the ultrasound beam and the direction of flow
c the average speed of sound in the imaged tissue
vc the wall filter cut-off velocity
TPFi (vc) the true-positive fraction within the ith vessel
FPF(vc)
the false-positive fraction obtained as the cut-off velocity is varied
Fv(i) the volume fraction occupied by the ith vessel
CPD1 & CPD2 the CPD values of two successive data points
max(CPD) maximum value of CPD along the WFSC.
|ΔCPD|norm normalized absolute first difference of the CPD
w
is a weight parameter used to define the volume fraction of the perivascular compartment
ϕ the standard-normal cumulative density function, vc ≥ 0
µln
the mean of the natural logarithm of the Doppler velocity estimates
σln
the standard deviation of the natural logarithm of the Doppler velocity estimates
µi
the mean of the log-normally distributed velocity estimates for the intravascular pixels
σi
the standard deviation of the log-normally distributed velocity estimates for the intravascular pixels
σp
the standard deviations of velocity estimates for the perivascular pixels
σe
UIFN the utility of the intravascular false-negative color pixels
UPCP the utility of the perivascular false-positive color pixels
List of Acronyms and Abbreviations
2-D Two-dimensional
3-D Three-dimensional
ANOVA Analysis of variance
CAM Chorioallantoic membrane
CEUS Contrast enhanced ultrasound
CFI Color flow imaging
CPD Color pixel density
cpSNR Color pixel signal-to-noise ratio
CT Computed Tomography
CW Continuous-wave
DCE-CT Dynamic contrast-enhanced x-ray computed tomography
DCE-MRI Dynamic contrast-enhanced magnetic resonance imaging
FI Flow index
FIR Finite impulse response
FPF False positive fraction
ICPF Intravascular color pixel fraction
IFNF Intravascular false negative fraction
IIR Infinite impulse response
IQ Quadrature demodulated
MAPE Median absolute percentage error
MEP Maximum envelope peak
MR Magnetic resonance
MRA Magnetic resonance angiography
MRI Magnetic resonance imaging
PCPF Perivascular color pixel fraction
PD Power Doppler
PDA Power Doppler angiography
PDF Probability density function
PET Positron emission tomography
PRF Pulse repetition frequency
PW Pulsed-wave
RBC Red blood cell
RGB Red, green, blue
ROC Receiver operator characteristic
ROI Region of interest
SEM Standard error of mean
TOST Two one-sided test
TPF True-positive fraction
VFI Vascularization flow index
VI Vascularization index
VOCALTM Volumetric calculations
VOI Volume of interest
Chapter 1
1
Introduction
1.1
Overview
Ultrasound is a commonly used imaging technique for vascular imaging. Of the different modes of ultrasound used to display vascular information, power Doppler is characterized by an improved sensitivity and ability to image small vessels or slow flow. However, power Doppler imaging faces some challenges that possibly set limitations on its usability in quantitative microvascular applications.
This thesis presents and evaluates new Doppler signal processing methods to potentially overcome some challenges of using power Doppler imaging in vascular applications. In this thesis, an objective method to automatically select the wall filter cut-off frequency setting is developed and evaluated using flow phantom experiments. Results from these experiments were used to drive adjustments to the theoretical foundation of the method and define conditions needed for an online implementation of the method. These conditions were used to adapt the method to apply to unprocessed power Doppler signals and expand it to function on three-dimensional images. The cut-off selection method was combined with artifact-reduction image post-processing techniques to form a two-stage Doppler processing method. Lastly, in vivo evaluation of the two-stage method performance using a tumor model and a simpler, hierarchal vascular model of the chick embryo chorioallantoic membrane were performed.
quantification applications of power Doppler imaging is presented followed by a summary of the most common challenges in using power Doppler imaging. Finally, an overview of previous attempts to overcome the identified challenges in comparison to the method presented in this thesis followed by a detailed outline of the thesis chapters.
1.2
The Age of Vascular Imaging
As quoted from Gooding’s 1999 editorial in Emergency Radiology, “the age of vascular imaging is upon us” [1]. With the vascular system being the fundamental communication and transportation vehicle to all body systems and organs, imaging blood vessels and studying its flow characteristics has become an integral part of almost all research efforts targeting the diagnosis, confirmation or interventional treatment of diseases. Vascular imaging is commonly used in cardiovascular, cerebrovascular and peripheral vascular diseases [2]. In the musculoskeletal field, vascular imaging has also become important for the diagnosis of inflamed entities that are linked to their vascular signature [3, 4]. In addition, studying tumor angiogenesis has become the focus of many researchers attempting to identify changes in vasculature as a marker of cancer and then target that vasculature for therapeutic defense [5, 6]. Vascular imaging is also playing an important role in testing the safety and efficacy of new drugs on the vascular systems of the target organs or hosts [1]. With the advancement in imaging technology, vascular imaging tools are now capable of providing three-dimensional (3-D) depictions of anatomical and/or functional features of vasculature. Furthermore, the unparalleled development in image analysis tools over the last three decades has empowered imaging technologies with artifact reduction, realistic visualization and quantification capability of vasculature.
1.3
Vascular Imaging Techniques
1.3.1
X-Ray Catheter Angiography
Angiography is a term that describes the process of acquiring images of blood vessels, particularly, arteries and veins. X-ray catheter angiography was the mainstay of vascular diagnostic imaging for almost half a century with its excellent spatial and temporal resolution and selective delineation of vessels [4]. In x-ray angiography, images are acquired by transmitting and receiving x-rays through the area of interest after injecting the subject with radio-opaque contrast agent. Rotational angiography presents the 3-D extension of catheter angiography allowing it to compete with the alternative vascular imaging. X-ray angiography is very useful in detecting abnormalities of the vessel lumen: stenosis, occlusion, aneurysms and other irregularities [3]. Nevertheless, its invasive nature, high radiation doses and injection of possibly nephrotoxic contrast media are among its drawbacks [3].
1.3.2
Computed Tomography (CT) Angiography
Computed tomography (CT) angiography allows 3-D imaging of vessels and surrounding structures. Cross sectional images are produced by rotating an x-ray tube 360° around the area of interest and collecting the information using rows of detectors on a circular gantry [7]. These images are assembled by a computer and post-processing methods such as 3-D volume rendering and maximum intensity projection (MIP) maps are used to best demonstrate the acquired information. CT angiography is useful for detecting thrombus, vessel wall thickening, calcification and abnormalities of adjacent structures such as infarction and hemorrhage [3]. Although CT has the highest spatial resolution of all imaging modalities, its high radiation doses and the need for injections of high concentrations of nephrotoxic contrast media limits its use for repeated scanning.
1.3.3
Magnetic Resonance Angiography (MRA)
from protons within different tissues after being interrogated by a radio-frequency electromagnetic pulse. The advantages of MRA include having high soft-tissue discrimination, no ionizing radiation and safer low-toxicity contrast agents. However, MRA’s shortcomings include: prolonged acquisition time, being invasive, lack of information about direction of blood flow as well as some important exclusions [4]. Patients with pacemakers, metal implants, claustrophobia and first-trimester pregnant women are all not candidates for MRA. In addition, different practiced protocols and instrument preferences have a large effect on signal strength, making it difficult to compare data obtained from different instruments [6].
1.3.4
Ultrasound
Ultrasound is a medical imaging technique that uses the variations in transmission and reflection of super-audible range sound waves (i.e., sound waves with frequencies beyond the human audible range of 20 kHz) from different types of tissues to produce images [7]. In the last two decades, ultrasound experts have proceeded to introduce a new area of vascular imaging as instrumentation expanded from real time to duplex Doppler, then color Doppler to power Doppler [1]. With the ability to provide information on both anatomy and flow characteristics, being the least invasive, lack of ionizing radiation, low cost, broad diagnostic applicability, portability and easy handling, ultrasound has become the initial screening and the fast-look follow-up examinations tool [8]. Its high resolution and ability to visualize blood flow using power Doppler as well as blood velocity and direction using color Doppler further extended its application to vascular diagnosis. Challenges for ultrasound imaging include the dependence of the image quality on the skill of the operator, limited field of view, inability to image bony or air-filled structures, and the tradeoff between resolution and depth of penetration when selecting the imaging frequency since sound penetration is best at low frequencies whereas resolution increases with frequency [4]. Limitation and challenges of Doppler ultrasound vascular imaging techniques will be discussed in detail later.
vasculature and remain in the systemic circulation for a certain amount of time. As these microbubbles pass the imaging window, they reflect echoes that differ signficantly in their frequency content from echoes reflected from the surrounding tissue. These reflected echoes are then converted into a contrast-enhanced image of the area of interest. Although CEUS imaging improves flow detection, it is still of limited use in comparison to Doppler flow imaging techniques due to its invasive nature and increased cost of contrast agents.
1.4
Overview of Doppler Ultrasound Imaging
1.4.1
The Doppler Equation
Doppler ultrasound provides information about moving structures in the body by measuring the changes in frequency of an ultrasound wave as it is reflected from a moving target such as flowing blood [7]. This change in frequency is called the Doppler effect and is summarized in Figure1-1(a).
When a target is moving towards the ultrasound source, the frequency of the received wave will be higher than the frequency of the emitted wave, giving a positive Doppler shift signal. A negative Doppler shift signal is acquired when the target is moving away from the ultrasound source. In vascular imaging applications, the Doppler shift frequency fDoppler is related to the velocity of blood v by the Doppler equation:
Eqn. 1-1
where fr is the reflected ultrasound frequency, f0 is the ultrasound transmit frequency, v is the target velocity, theta θ is the angle between the ultrasound beam and the direction of flow as shown in Figure 1-1(b) and c is the average speed of sound in the imaged tissue.
Typical ranges of the Doppler shift frequencies are 10Hz-10 kHz corresponding to blood velocities of 1-100 cms-1 [9].
!
fDoppler = fr " f0 =2f0vcos#
(a) (b)
Figure 1-1: Doppler effect: (a) the frequency of the reflected ultrasound wave from a moving target (red blood cells (RBC)) is different than the transmitted wave. The detected frequency is increased or decreased depending on the direction of motion. The Doppler shift frequency is controlled by the Doppler equation (Eqn. 1-1) which
is a function of the transmit frequency f0, RBCs velocity v, Doppler angle θ.
1.4.2
Continuous-wave (CW) and pulsed-wave (PW) Doppler
In general, Doppler systems for ultrasound-based flow estimation can be broadly categorized based on their excitation methods into: continuous-wave (CW) systems and the pulsed-wave (PW) systems [9]. The CW Doppler system is based on the use of continuous ultrasound waves, and it estimates flow velocities by measuring the Doppler frequency shifts between the transmitted wave and the received echoes. On the other hand, the PW Doppler system is based on the use of finite-duration ultrasound pulses, and it estimates flow velocities by measuring the time shifts between pulse echoes. In modern imaging instruments, pulsed-wave (PW) Doppler has virtually replaced CW Doppler as it allows more localization of the signal source within the field of view [9].
single sample volume in the field of view. The spectrogram is typically used to provide information about flow dynamics or blood velocity within a sample volume inside a blood vessel in coordination with the cardiac cycle. If multiple sample volumes are defined to fill out a field-of-view, and the locations of these sample volumes are mapped to a 2-D display using color-coded values in response to the amplitude or the frequency of the Doppler signal, blood flow images maybe produced [9]. Producing these types of 2-D images of blood flow is called real time Doppler color flow imaging.
1.4.3
Principles of Doppler Color Flow Imaging (CFI)
A Doppler color flow imaging system can be divided into two stages: Doppler signal acquisition and Doppler signal processing. A sample block diagram illustrating the components of the two stages of a Doppler color flow imaging system is shown in Figure 1-2.
Figure 1-2: A sample block diagram of Doppler color flow imaging system constituting of 2 sections: (a) Doppler Signal acquisition section and (b) Doppler Signal Processing.
1.4.3.1
Doppler Signal Acquisition
pulses. The master oscillator and pulser blocks control the combination and sequence of signals to the individual transducer elements to generate a suitable transmitted beam formed of multiple scan lines within the region-of-interest (ROI). For each scan line, corresponding to the lateral position within the ROI, the received beam is then amplified to compensate for attenuation of echoes returning from deep portions of the field of view. The mixer (quadrature demodulator) block is responsible for extracting the directional Doppler shift signals from the returning echoes. This is achieved by demodulating the returning signal with the transmit signal from the master oscillator (cos(wt)) and with a 90° phase shifted version (sin(wt)) of the transmit signal. The demodulated signals are then sampled at time points that correspond to the different depths (axial position) of the sample volumes within the ROI whereas the lateral position of the sample volume is determined by its corresponding scan line within the ROI. For each sample volume, the ensemble of pulse echo samples referred to as the Doppler signal is determined for further processing. In the next sections, we discuss in detail some of the Doppler signal acquisition building blocks that directly contribute to the resulting images.
Pulser Block: Velocity Resolution and Aliasing Limit
Nyquist sampling theory, the rate of pulsing (the pulse repetition frequency (PRF)) must be greater than twice the maximum frequency shift to be detected (i.e., the Doppler shift corresponding to the maximum velocity of imaged blood flow) to avoid aliasing [10]. Aliasing is an inaccurate display of color that occurs in an image when the detected velocity in the corresponding sample volume exceeds the maximum detectable velocity [11]. Thus, the PRF setting on an ultrasound instrument affects the velocity resolution and sets the limit to the maximum accurately detectable blood velocity.
Sampling Memory Block: Axial Resolution and Sampling
In order to produce images with accurate estimates of the location of the source of a Doppler shift, a method known as range-gating is used. Range-gating is identifying a location along a scan line, the placement of which and the size determine the time instances for sampling of the received beams along that line to construct the Doppler signal for the location [12]. In color flow imaging (CFI) systems, this process is repeated for multiple gates to divide the ROI into sample volumes corresponding to samples of the received beams at different depths for the different scan lines within the ROI. Typically, the size of the gates is determined by the length of the transmitted pulse and defines the axial resolution in an ROI of CFI frame [12]. The Gate setting on an ultrasound instrument defines the size of the gates and thus the axial resolution of a CFI image.
1.4.3.2
Doppler Signal Processing
frame image is then combined with the B-mode gray-scale information from the sample volume in the artifact suppression block to determine the probability that flow is present and accordingly, determine whether the corresponding pixel will be displayed as a colored or gray-scale pixel. Finally, depending on which display mode is used, the resulting Doppler color map is superimposed onto a B-mode image of the underlying structure. In the next sections, we discuss some of the Doppler signal processing building blocks in detail.
Wall / Clutter Filter Block
Doppler imaging instrument, the selection of the filter’s cut-off frequency is accomplished by the operator using the wall/clutter filter setting.
Figure 1-3: Illustration of hypothetical Doppler signal frequency spectrum. A high-pass filter, the wall/clutter filter, is used to suppress the high-energy, low-frequency clutter in the Doppler signal. Determining the filter cut-off can be (a) simple or (b) challenging if the clutter and blood spectra overlap.
Artifact Suppression Algorithms Block
With its stochastic nature, Doppler signal parameters may vary in a random fashion and therefore require some post-processing techniques such as spatial and temporal averaging and thresholding to reduce sharp fluctuations and signal dropouts in the final displayed image. The following are some of these techniques:
Noise Threshold
The purpose of the noise threshold is to eliminate the signal coming back from the noise spectrum (shown in Figure 1-3). If the estimate of average Doppler signal power is less than a minimum threshold level, the color pixel is not displayed. The exact value of the noise threshold is not controlled by the user but is a function of the gain setting [9].
Priority Setting
gray-scale echoes may be displayed as colored pixels and misinterpreted as blood in a color flow image. To suppress such signals from the image, the priority threshold, controlled by the priority instrument setting determines the maximum level of gray-scale intensity that would be displayed as color. If a pixel gray-scale value exceeds the priority level, it is likely to have come from a region containing solid tissue and therefore would not be assigned color.
1.4.3.3
Display Modes
The Doppler shift signals computed from the different sample volumes within a region of interest are used to produce two- or three-dimensional images of blood flow. There are two commonly used modes of display of color flow images:
Color Doppler Mode
A color Doppler image is a map of the mean Doppler frequency (corresponding to the mean flow velocity) computed from the phase shift or the delays between the echoes returning from the sample volume during subsequent pulses [12]. The mean frequency is computed for multiple sample volumes throughout the ROI and a color is assigned to each pixel depending on the speed and direction of flow. Blood flowing towards the transducer is typically mapped in blue color whereas blood flowing away from the transducer is assigned a red color. The pixel intensity displayed as the shade within the color scale represents the speed of the flow. An example of this type of display is illustrated in Figure 1-4(a).
would obscure the vascular signals coming from slow flow [15]. Color Doppler images are also angle dependant, by which in the worst case, flow perpendicular to the ultrasound beam would not be detected or displayed as there will be equal flow towards and away from the transducer resulting in zero mean velocity.
Power Doppler (PD) Mode
The power Doppler mode is an alternative mode to color Doppler mode that produces two- or three-dimensional color maps of the total power of the Doppler signal within each sample volume instead of the mean Doppler frequency [16]. An example of a power Doppler image is shown in Figure 1-4(b). The estimate of the Doppler signal power is computed using the area under the signal’s power spectrum and is related to the red blood cell density in the sample volume. Power Doppler mode has several advantages over color Doppler. First, power Doppler signal is independent of flow velocity and direction, since the area under the spectrum is not affected by the wrapping of signal frequencies when Nyquist sampling is not met (i.e., flow faster than twice the PRF is imaged) and thus is not subject to aliasing. In addition, power Doppler has an improved sensitivity to slow flow and a higher tolerance to noise since the power of signal from slow flow, when integrated with respect to frequency, is relatively higher than the noise power and, therefore, its signal can be maintained after applying the noise threshold. Since velocity information is not of interest in this mode, power Doppler is nearly angle independent, allowing it to detect and display even blood flowing perpendicular to the ultrasound beam. When comparing the color and power Doppler images of a kidney (Figure 1-4), it is clear that the power Doppler mode is able to depict the full cortical perfusion network, while color Doppler displays the large vessels only.
1.5
Power Doppler Imaging Applications
applications that use these depicted vascular networks to quantify blood flow in the area of interest.
Figure 1-4: Sample Doppler color flow images of human right kidney using (a) color Doppler display mode showing only large vessels and (b) power Doppler mode with higher sensitivity showing the full cortical perfusion network [Downloaded from Power Doppler Sonography, GE Healthcare, Medical Diagnostics: Medcyclopaedia.com according to the term of use attached in Appendix A].
1.5.1
Vascular Depiction Applications
1.5.1.1
Vessel Morphology Depiction Applications
power Doppler’s improved definition of vessel edges enhance the accuracy of luminal and vessel diameters measurements used in diagnosing high-grade stentosis in the renal artery [28] and the carotid artery [29-33].
1.5.1.2
Inflammation Evaluation Applications
The second application is using power Doppler to image and evaluate inflammation specifically in the musculoskeletal tissues [34, 35]. Due to its enhanced sensitivity, PD is valuable in depicting increased flow in vessels that are dilated owing to inflammatory response such as the intra-articular knee vasculature in rheumatoid arthritis patients [36-39]. In addition, PD can be used to distinguish inflammatory and infectious musculoskeletal fluid collections from those that are noninflammatory and may help guide the decision to perform diagnostic biopsy procedure [40].
1.5.1.3
Tumor Vasculature Depiction Applications
The combined effect of power Doppler’s sensitivity to slow flow and improved delineation of tortuous and irregular vessels makes it a promising technique to image intratumoral vessels [17]. Studies assessing vasculature of hepatocarcinoma [41, 42] and analyzing the lymph node involvement and vascular invasion with breast cancer [43] have found power Doppler to be a very effective tool. Moreover, other investigators used power Doppler to differentiate benign and malignant tumors in breast [44, 45], ovarian [46] and adnexal lesions [47].
1.5.2
Vascular Quantification Applications
et al. presented a standardized set of metrics that could give a mathematical expression of vascularization and flow [52]:
Eqn. 1-2a
Eqn. 1-2b
Eqn. 1-2c
As defined in [52], VI, also known as color pixel density (CPD), measures the proportion of color voxels in the cube, representing the amount of moving blood in the tissue, FI, the mean power signal of blood flow, represents the intensity of flow at the time of acquisition and VFI is a combination of vascularization and flow indices representing both blood flow and vascularization. The software developed by Pairleitner et al. was later implemented in GE ultrasound scanners under the name VOCALTM: volumetric calculations.
The use of these quantification indices and VOCALTM software, currently known as 3-D power Doppler angiography (3-D PDA), has produced an abundance of research communications in a variety of applications.
Quantifying tumor vascularity is the primary application for 3-D power Doppler angiography, especially as it offers unique ways for assessing women with gynecological cancers [53] such as ovarian [54, 55] and endometrial cancers [56, 57]and for diagnosis of malignant pelvic solid tumors [58]. Moreover, 3-D PDA was shown to serve as a useful tool in distinguishing benign and malignant breast [59, 60] and prostatic tumors [61].
These quantification indices are progressively being applied to studying the feto-placental unit. Attempts to correlate the VI, FI and VFI indices to regional perfusion in fetal brain [62, 63], liver [64] and lungs [65, 66] have been reported. The most promising field in applying 3-D PDA is the analysis of placental vascularity in different stages of normal pregnancy [67-71] as well as adverse pregnancy outcomes [72-75]. These indices
€
Vascularization index= color voxels
total voxels in VOI,
Flow index=sum of power in colored voxels
color voxels ,
Vascularization flow index =sum of power in colored voxels
have also shown promising results when assessing the endometrium for assisted reproductive techniques and in vitro fertilization treatments [47, 76, 77].
1.6
Challenges in Power Doppler Imaging
Despite this abundance of literature on the applications of power Doppler imaging, there exist a number of challenges and limitations that are consistently being highlighted in these studies.
1.6.1
Operator-Dependant Instrument Settings
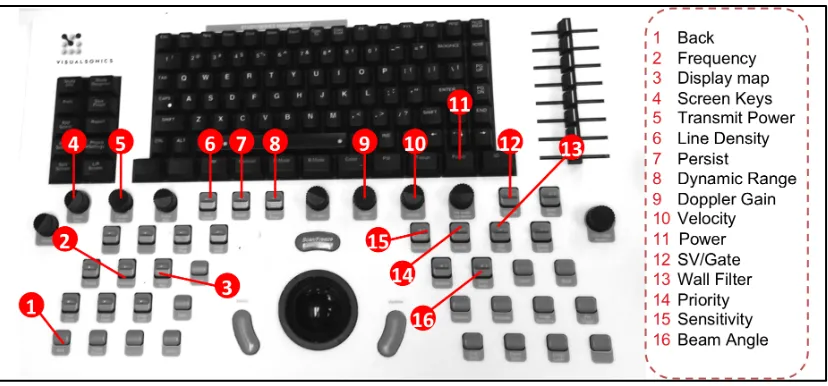
The first and most commonly reported challenge is the sensitivity of the acquired power Doppler signal to numerous operator-dependent instrument settings. An example of a commercial ultrasound scanner user panel shown in Figure 1-5 illustrates that 16 different instrument settings need to be setup prior to image acquisition in power Doppler mode, each of which has an effect on the amount of blood depicted in images. Some studies and opinion letters were published analyzing and discussing further the impact of these settings on power Doppler signal. In a letter to the Radiology editor, Cardinals et al. stated that machine settings such as PRF, filters, ensemble length, and transmit power can all contribute to false appearance of color from stationary structures in power mode [78]. Many studies were conducted to understand and evaluate how these settings influence flow information displayed by the power Doppler mode [79-84]. An increase in PRF and wall filter cut-off decreases flow areas significantly, whereas decreasing frame rate increases the flow area [79]. In accordance with these results, Gudmundsson et al. also reported that many instrument settings can influence power Doppler signal intensity and emphasized the need for optimum fixed presets of settings when attempting to measure flow from power Doppler images [80].
1.6.1.1
The wall filter cut-off setting
a source of a non-linearity between the two parameters [81]. Similarly, it was shown that the signal intensity of power Doppler images of flow is clearly affected by the clutter filter [82]. Browne et al. emphasized the importance of understanding the effect of instrument settings such as wall filter cut-off on the Doppler signal when interpreting the clinical significance of the Doppler information, particularly when evaluating serial examinations for changes in blood flow characteristics [84]. In a more recent study by Garcia et al., it was shown that the wall filter can induce severe power Doppler signal losses that could negatively influence assessment of vascular stenosis [85]. They recommended that clinicians should consider these signal losses when interpreting power Doppler images.
1.6.1.2
Operator-dependant settings and 3-D PDA
More specific studies and editorial notes on the effects of instrument settings on the quantification of the power Doppler signal using the three indices (VI, FI, and VFI) are also found in literature [86-90]. Due to the arbitrary nature of these indices and their dependence on the color pixel count, any factor that alter this count could affect the vascularity assessment. Instrument settings (gain, wall filter cut-off, pulse repetition frequency (PRF), and frame rate) play a major role in these alterations [86]. Therefore, the need for care with adjustments in instrument settings is important and, accordingly, more studies evaluating how these settings affect the quantification indices are required [87]. A study by Raine-Fenning et al. concluded that all three indices are affected significantly by variations in power Doppler instrument settings and recommended maintaining the settings in order to obtain meaningful comparisons within and between subjects [88]. It was also found that the degree of overestimation of moving blood volume in small tubes (vessels) depends on instrument settings and should be taken into account when quantifying small vessels in a clinical setting [90]. With the fast growing body of literature using 3-D PDA, W. P. Martins points out, in a note published in
PDA indices reference values for different applications and test if pathologic conditions are related to abnormal 3-D PDA indices.
Figure 1-5: An example of a commercial power Doppler system (Vevo2100, VisualSonics, Toronto, Canada) user panel having 16 user-dependent settings to be set prior to image acquisition.
1.6.2
Image Artifacts
The other major challenge for power Doppler vascular imaging is the presence of Doppler artifacts, which cause the misassignment of color to signal from sources other than blood flow [92]. A variety of Doppler artifacts have been documented in literature; however, we will be focusing on artifacts that specifically affect vascular imaging applications of power Doppler. These artifacts are: blooming, perivascular, flash, pseudoflow and jail-bar artifacts.
1.6.2.1
Blooming and Perivascular Artifacts
appear outside the vessel [93]. In practice, the blooming artifact is directly related to the combined effect of the gain and color rejection (i.e. wall filter cut-off and priority) settings due to the tradeoff between having enough gain to visualize flow in small vessels and having so much gain that it causes an exaggerated depiction of larger vessels [93, 94]. Excessive gain may also cause the overlap of signals from adjacent vessels, resulting in their appearance as a single vessel [94].
The perivascular artifact is essentially a blooming artifact that occurs in cases of turbulent flow, which causes tissue vibrations that result in a single hue of power around vessels and is a marker of stenotic vessel segments [95].
Blooming and perivascular artifacts have been reported to cause overestimation of vessel diameters using power Doppler [31, 96-99].
1.6.2.2
Flash and Pseudoflow Artifacts
Flash artifact is a sudden burst of random color that fills the ROI and is caused by tissue or transducer motion and is most commonly seen in hypo-echoic areas such as cysts or fluid collections [92]. Flash artifacts are related to the priority instrument setting, which suppresses color pixels if a strong gray-scale echo is detected. In the case of hypo-echoic areas, the absence of gray-scale echoes will cause color pixels to be displayed for nearly stationary regions [92]. Power Doppler is more susceptible to flash artifacts than other Doppler modes due to its increased sensitivity to motion [11].
Pseudoflow artifact is closely related to flash artifact in being dependant on motion, but it is specifically dependant on fluid (other than blood) motion [92]. The color or power Doppler signal will appear as long as the fluid motion continues, such as motion of fluid collection in the gastrointestinal or urinary systems.
The presence of flash and pseudoflow artifacts was reported to significantly hamper visualization and quantification of vasculature and necessitated the repetition of scans to ensure enough artifact-free images are acquired for further analysis [19, 100, 101]
1.6.2.3
Jail Bar / Vertical Lines Artifact
line. Interpolation of the weaker than expected scan lines causes a lack of color, which appears as the striping effect. Martins et al. have reported observing artifactual vertical lines when imaging a flow-free water tank [91]. They associated these artifactual lines to strong reflections from the base of the tank (a nearly perfect reflector) and validated their assumption by placing a 2 cm layer of bovine muscle tissue at the bottom of the tank, causing the vertical lines to disappear. The artifact causes the loss of signal from some lines and an overlay of color on other lines, which significantly affect the quality of the image and is specifically problematic when imaging vasculature in a thin tissue layer placed on a strong reflector.
Figure 1-7: Jail bar artifact in a power Doppler image. Vertical bars of color separated with blank lines are seen overlaying different structures in the image.
1.6.2.4
Doppler Artifacts and 3-D PDA
over- or underestimation of these indices would present a limitation to their use in clinical settings or even by researchers attempting to use 3-D PDA to study different subjects or study longitudinal variations within the same subject [91].
1.7
Attempts to Overcome Challenges
1.7.1
Optimizing Instrument Settings using Flow Phantoms
In an attempt to overcome some of the challenges of having operator-dependent instrument settings, some investigators performed in vitro studies using microvessel flow phantoms to better understand the effect of the different settings on images [91, 99, 103-105]. Understanding the individual and combined effects of these settings on the acquired images provided these investigators with the opportunity to calibrate these settings for specific applications or formulate guidelines on how to set them up to acquire good quality images. For example Kruse et al. presented an optimized set of instrument settings and tested its reliability to locate and measure blood flow in nail bed of human finger [103]. Camfferman et al. was able to calibrate the instrument settings to improve imaging of preterm brain vessels [99], whereas Sakano et al. presented a means to optimize the PRF setting to calibrate different types of ultrasound machines and enable direct comparison of finger joint images between ultrasound machine models [105]. In a similar study comparing different machines, Ten Cate et al. reported the different sets of machine settings needed to detect the lowest flow velocity in a microvessel flow phantom [104].
1.7.2
Developing Application-Based Instrument Settings Standard
instrument setting optimization for specific applications, such as diagnosis of liver lesions [106]. Similarly, Kruskal et al. presented a comprehensive guide to setting up Doppler flow instrument settings for a number of different applications in hepatic sonography [83]. A comparable guide for optimizing machine settings and avoiding artifacts in rheumatological Doppler imaging applications was presented by Torp-Pedersen et al. [107].
1.7.3
Optimizing Wall / Clutter Filter Processing
While all the above mentioned studies did not attempt to improve or change how the Doppler imaging system performed, other investigators worked on improving the signal processing methods in Doppler imaging systems to overcome its limitations. As highlighted previously, the wall filter cut-off setting has been reported frequently to affect the quality and accuracy of blood flow display and quantification in Doppler flow images; therefore, many investigators have worked on developing more optimized filter designs or more advanced filtering approaches. Some investigators explored and analyzed different classes of filters (finite impulse response (FIR), infinite impulse response (IIR), and regression filters) [108] or different IIR filter initialization techniques to improve clutter filter performance [109]. Thomas and Hall proposed a “DC removal technique” that involves shifting the undesired clutter signals to zero frequency then removing these signals by subtracting their average from each of them. This technique results in a narrow band high pass filter without reducing the number of samples available for velocity estimation [110]. Further advancement of the wall filter involved the use of adaptive clutter filtering techniques [111-116]. In adaptive clutter filtering techniques, an optimum filter is dynamically selected at individual or multiple sample volumes by adapting its stopband or filter coefficients to the local clutter spectral characteristics.
1.7.3.1
The Original WFSC Method
clutter filtering were constructed from flowphantom experiments using several single -vessel flow phantoms of 160, 200, 250, 300 and 360 µm diameters, with blood-mimicking fluid with flow velocity (4, 3, 2, 1 and 0.5 mm/s) imaged with different transducer frequencies (30 and 40 MHz). For the cases demonstrating high performance, the relationship between the amount of colored pixels in the ROI, represented by the color pixel density (CPD), and the wall filter cut-off frequency was represented by the
wall filter selection curve (WFSC) [119]. A consistently identified characteristic plateau was recognized at intermediate cut-off frequencies along this curve, which was hypothesized to enclose the optimum cut-off frequency for that specific image. A mathematical model based on ROC statistics was developed to study the behavior of the wall filter selection curve for ROIs enclosing multiple vessels and were compared to experimental data acquired with a 30-MHz transducer and a custom-designed multiple-vessel flow phantom with multiple-vessel sizes (200–300 um), blood flow velocities (1–10 mm/s), and different blood vessel orientations [120]. Monte Carlo simulations using the mathematical model helped analyze properties of the WFSC that yield accurate estimates of the optimum cut-off frequency for a specific image. These simulations showed that WFSCs for multiple-vessel regions include a plateau whose CPD corresponds to the total vascular volume fraction when the plateau is > 0.5mm/s in length and begins at a wall filter cutoff < 2mm/s. The WFSC method is proposed to automate the selection of the wall filter cut-off frequency setting without the need for any input from the user. Further development and evaluation of the WFSC method is presented later in this thesis.
To our knowledge, there are no other similar methods to the WFSC method presented in the scientific literature; however, there are some automated wall filter cut-off setting techniques proposed in the patent literature. A summarized review of the methods published in the patent literature can be found in Chapter 2 of this thesis.
1.7.4
Image Post-Processing Methods to Reduce Artifacts
including surface rendering, filtration, rotation and magnification to produce 3-D images suitable for a new 3-D view that allows the endoscopic view of flow such as arterial branches and curved vessels to be visualized [121]. Other investigators implemented 3-D vessel reconstruction algorithms to enhance the signal from small vessels and improve the continuity of big vessels, which may not be entirely perceived due to the signal loss from regions of low backscattered pressure within a vessel [122]. Another post-processing algorithm proposed by Lai et al. involved applying thresholding, morphological transformations such as dilations and erosions and 3-D skeletonization and reconstruction of vascular networks to help extract diagnostic features from breast cancer vasculature [45]. Further information and development of this method is provided later in Chapter 4 of this thesis. Echoscintigraphy is a novel image-processing algorithm developed by Schlosser et al. in 2003 that provided reduction of color blooming in power Doppler images [123]. It improves the detection of low-intensity color signals by applying special summation algorithms to multiple frames and resulted in more accurate vessel diameter estimations.
1.8
Hypothesis and Objectives
We hypothesize that a more efficient power Doppler signal processing method that involves the automation of the wall filter cut-off instrument setting and post-processing 3-D power Doppler images to reduce artifacts will improve the accuracy and robustness of vascular depiction and quantification using power Doppler imaging.
Driven by the research hypothesis, the overall goal of this thesis study is to develop, evaluate and validate a new power Doppler data processor that uses an improved version of the wall filter selection curve method and 3-D vascular network reconstruction algorithms to produce more accurate representations of imaged vascular networks for depiction and quantification purposes.