Western University Western University
Scholarship@Western
Scholarship@Western
Electronic Thesis and Dissertation Repository
10-17-2016 12:00 AM
Using a Real-Time Object Detection Application to Illustrate
Using a Real-Time Object Detection Application to Illustrate
Effectiveness of Offloading and Prefetching in Cloudlet
Effectiveness of Offloading and Prefetching in Cloudlet
Architecture
Architecture
XuTong ZhuThe University of Western Ontario
Supervisor Hanan Lutfiyya
The University of Western Ontario
Graduate Program in Computer Science
A thesis submitted in partial fulfillment of the requirements for the degree in Master of Science © XuTong Zhu 2016
Follow this and additional works at: https://ir.lib.uwo.ca/etd
Part of the OS and Networks Commons
Recommended Citation Recommended Citation
Zhu, XuTong, "Using a Real-Time Object Detection Application to Illustrate Effectiveness of Offloading and Prefetching in Cloudlet Architecture" (2016). Electronic Thesis and Dissertation Repository. 4176.
https://ir.lib.uwo.ca/etd/4176
This Dissertation/Thesis is brought to you for free and open access by Scholarship@Western. It has been accepted for inclusion in Electronic Thesis and Dissertation Repository by an authorized administrator of
Abstract
In this thesis, we designed and implemented two versions of a real-time object de-tection application: A stand alone version and a cloud version. Through applying the application to a cloudlet environment, we are able to perform experiments and use the results to illustrate the potential improvement that a cloudlet architecture can bring to mobile applications that require access to large amounts of cloud data or intensive com-putation. Potential improvements include data access speed, reduced CPU and memory usages as well as reduced battery consumption on mobile devices.
Keywords: cloud and cloudlet computing, data pre-fetching, partition and o✏oading
Contents
Certificate of Examination i
Abstract ii
List of Figures vi
List of Tables viii
List of Appendices ix
1 Introduction and Motivation 1
1.1 A solution to the increasing traffic incurred by mobiles - Cloudlet . . . . 2
1.2 Problem statement . . . 2
1.3 Thesis Organization . . . 3
2 Literature Review 5 2.1 Mobile Application Partitioning & O✏oading . . . 5
2.1.1 Identify remotely executable portions in application . . . 5
2.1.2 Profiling and Monitoring . . . 6
2.1.3 Partitioning . . . 6
2.2 Use of Cloudlet . . . 7
2.3 Di↵erent Ways Of Cloudlet Prefetching Data . . . 9
3 Cloud & Cloudlet & Mobile Data Pre-fetch Architecture 11 3.1 Example Application . . . 11
3.2 Architecture of a Stand Alone Application . . . 11
3.3 Architecture of a Cloud Version . . . 12
3.3.1 Client . . . 13
3.3.2 Server . . . 14
3.3.3 Full Program Cycle . . . 14
4 Experimental Environment 17
4.1 Application . . . 17
4.2 Object Recognition . . . 17
4.3 Video Streaming and Transcoding . . . 19
4.4 Application implementation . . . 19
4.4.1 Stand Alone Version implementation . . . 20
Programming languages and OS . . . 20
4.4.2 Cloud Version Implementation . . . 20
Programming languages and OS . . . 20
4.5 Testbed . . . 20
4.6 Testing Goal and Metrics . . . 21
5 Experiments 22 5.1 Experimental Setup . . . 22
5.2 Data location vs Data Retrieval Experiments . . . 23
5.2.1 Metric . . . 23
5.2.2 Test 1 . . . 24
5.2.3 Test 2 . . . 25
5.2.4 Test 3 . . . 26
5.2.5 Discussion . . . 26
5.2.6 Additional Comparisons . . . 28
5.3 Streaming cost incurred in Cloud Version Application . . . 28
5.3.1 Discussion . . . 31
5.4 Stand Alone Version and Cloud Version Performance Comparison Exper-iment . . . 32
5.4.1 Metrics . . . 32
5.5 Weaknesses . . . 37
6 Conclusion and Future Work 39 6.1 Conclusion . . . 39
6.2 Future Work . . . 39
Bibliography 40 A Application Preparations and Detailed Implementation 44 A.1 Preparations . . . 44
A.1.1 Generate pre-defined building classifiers for Computer Vision
func-tions . . . 44
A.1.2 Record down each building’s geographic location . . . 46
A.2 Application source code . . . 46
A.2.1 Stand Alone Version Components . . . 46
Prototype version 2 components . . . 50
Curriculum Vitae 55
List of Figures
1.1 Common Cloud . . . 3
1.2 Cloudlet . . . 3
3.1 process of stand alone version . . . 13
3.2 process of Client-Server version . . . 15
4.1 how does detection happen . . . 18
4.2 how does detection happen . . . 19
5.1 VERSION 1 - TEST 1 . . . 24
5.2 VERSION 1 - TEST 2 . . . 25
5.3 Accessing Circe from two di↵erent locations - Comparison 1 . . . 26
5.4 VERSION 1 - TEST 3 . . . 27
5.5 Accessing three servers - Comparison 1 . . . 29
5.6 Accessing three servers - Comparison 2 . . . 29
5.7 Accessing three servers - Comparison 3 . . . 29
5.8 Accessing three servers - Comparison 4 . . . 29
5.9 Mobile - Server Latency - MacbookPro . . . 30
5.10 Mobile - Server Latency - Circe . . . 30
5.11 MacBookPro - Mobile StandAlone - Single Building . . . 31
5.12 MacBookPro - Mobile StandAlone - Four Building . . . 31
5.13 Circe - Mobile StandAlone - Single Building . . . 31
5.14 Circe - Mobile StandAlone - Four Building . . . 31
5.15 Stand Alone Version Performance - Battery . . . 33
5.16 Stand Alone Version Performance - Battery - Sum . . . 33
5.17 Stand Alone Version Performance - FrameRate . . . 33
5.18 Stand Alone Version Performance - CPU . . . 34
5.19 Stand Alone Version Performance - RAM . . . 34
5.20 Stand Alone Version Performance - GPU . . . 35
5.21 Cloud Version Performance - Battery . . . 35
5.22 Cloud Version Performance - Battery - Sum . . . 35
5.23 Cloud Version Performance - FrameRate . . . 36
5.24 Cloud Version Performance - CPU . . . 36
5.25 Cloud Version Performance - RAM . . . 37
5.26 Cloud Version Performance - GPU . . . 37
List of Tables
List of Appendices
Appendix A Application Preparations and Detailed Implementation . . . 44
Chapter 1
Introduction and Motivation
Since the first release of the iPhone in 2007, the use of mobile devices (e.g., smartphones, tablets, smart watches) has increased dramatically. The recent Cisco Global Mobile Data Traffic Forecast shows that, in 2014, global mobile devices and connections grew almost half a billion (from 6.9 billion in 2013 to 7.4 billion in 2014) [1]. Cisco also noted that these mobile devices represent 88 percent of the mobile data traffic in 2014.
Despite the growth and the convenience they bring, mobile devices have limited com-puting power, e.g., battery power, CPU and memory. This limits the applications that can be run only on mobile devices. While mobile devices are evolving to become more powerful and able to support more complex applications, there are still applications that would have poor performance if the computing resources were limited to those found on the device. For example, weather forecasting requires access to many data sources, e.g. radiosonde observation and satellite data. Accessing this data requires that the application has many open network connections to receive the data. As shown by Lynch et al. [2], the application also requires the calculation of numerical prediction models. The access and computation requires substantial computing resources that are often not available on mobile devices. However, the leveraging of cloud computing resources al-lows for this application to be realized. The weather service hosted on the cloud handles communication with the data sources and numerical prediction modelling. The weather service can be accessed through an API by software on mobile devices. The mobile device software specifies a location and receives results from the cloud service (predicted weather conditions for di↵erent locations). This saves battery power and requires little compute power and storage of the mobile device. Another example is seen with social network applications (e.g., Twitter, Reddit, Facebook and Linkedin), where a huge amount of multimedia data (e.g., texts, images, audios and videos) are stored on cloud servers. Ap-plications on mobile devices can retrieve this data through an API. In this case, cloud
Chapter 1. Introduction and Motivation 2
servers can also perform computational services (e.g., data mining) based on the data generated through users’ behavior (e.g., referencing people the user may know based on existing friends’ links, suggesting pages, posts that the user may be interested in).
The use of cloud computing resources to provide services used by mobile applications has resulted in significantly increasing mobile traffic and this is expected to continue in the future. In the Ericsson Mobility Report 2015 [3], the expected smart phones subscriptions by 2020 as compared to 2014 will increase from 2.6 billion to 6.1 billion worldwide, mobile broadband from 2.9 billion to 7.7 billion and mobile PCs, tablets and routers will increase from 250 million to 400 million. Monthly mobile data traffic is expected to increase from 3.3 ExaBytes/month as of 2014 to 30.5 ExaBytes/month in 2020 [3]. We also note that during popular global events the data flow is even more significant than usual. For example, during the 2014 World Cup, there were 26.7 Terabytes of traffic from texting, talking and posting on social networks. During the championship final, generated mobile traffic was five times higher than the average peak hour traffic.
1.1
A solution to the increasing tra
ffi
c incurred by
mobiles - Cloudlet
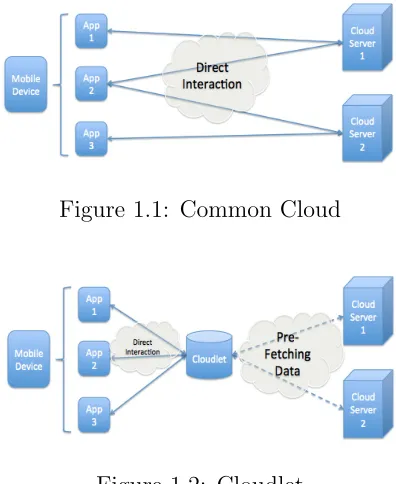
To deal with this growth, one concept that has been proposed is to use middleware in cloud network structures e.g. a cloudlet. A cloudlet has richer computing resources compared to mobile devices and can be located at places where a major population lives or places that are visited at a high frequency e.g., major residential area, large restaurants, co↵ee stores, malls, schools. As explained in Satyanarayanan et al. [4], the role of cloudlets is to provide computing power in between cloud servers at the network core and mobile devices at the network edge. Cloudlets access cloud servers at the network core while being easily reachable by mobile devices through either a LAN or WAN connection at a closer distance to the device than cloud servers. Figure 1.1 shows the current relationship between mobile devices and a cloud while Figure 1.2 shows possible role of a cloudlet that is assumed to be at the network edge.
1.2
Problem statement
Chapter 1. Introduction and Motivation 3
Figure 1.1: Common Cloud
Figure 1.2: Cloudlet
cloudlets [5] [6] [7]. Typically, the goal is to improve overall performance of the application or minimize energy usage on the mobile devices through the o✏oading; 2) Cloudlet Structures, which focus on facilitating coordination among mobile devices, cloudlets and cloud servers [8] [9] [10] [11] [12] [13] [14] [15] [16] [17] [18] [4]; 3) Data Pre-fetching, which studies how a cloudlet can e↵ectively pre-fetch data from cloud servers to better serve mobile devices’ needs, [19] [20] [21] [22] [23] [24] such as reduced network latency and energy consumption.
Despite the considerable research on cloudlets, little research has focused on how to improve the responsiveness of cloudlets to requests from mobile devices by pre-fetching data based on context.
In this thesis, we designed a live building detection application which involves complex computer vision computations on potentially a large base of location (context) based data that is to be processed and stored. We coded the application into two prototypes: one only uses the mobile device’s local resources, and the other o✏oads to cloudlets. We used these prototypes to evaluate the e↵ectiveness of prefetching of data based on context.
1.3
Thesis Organization
Chapter 1. Introduction and Motivation 4
Chapter 2
Literature Review
This chapter reviews related research in mobile application partitioning/o✏oading, mobile-cloud network architecture and mobile-cloudlet pre-fetching techniques.
2.1
Mobile Application Partitioning & O
✏
oading
In order to allow mobile applications to leverage cloud resources, decisions need to be made on how to partition and o✏oad applications. This section describes the represen-tative work in the area of partitioning and o✏oading.
2.1.1
Identify remotely executable portions in application
For applications that aim to leverage cloud/cloudlet resources, there needs to be a way to identify the remotely executable portion of the applications.
CloneCloud [6] [7] proposes a full VM (virtual machine) migration approach for the mobile device to o✏oad computational threads to cloud servers. It uses a static analyser to identify partitions of the application automatically under a set of constraints. For example, methods that access unique features of its local device, share native states or libraries should stay local. The static analyser runs automatically instead of developers manually identifying code that can be remotely executed. We will refer to this code as remotable.
MAUI [5] uses .NET CLR, which is a cross platform run-time environment by Mi-crosoft, that compiles and runs code from di↵erent coding sources. It enables cross platform, cross language compilation by compiling source code into CIL (common inter-mediate language) [25]. MAUI uses a CLR feature that allows application developers to
Chapter 2. Literature Review 6
manually tag methods in the application source code, which indicates that the method can be remotely executed.
Cuckoo [26] proposes that developers use the Android Activity/Service Classes to sep-arate an application’s interactive part and computational part. On an Android platform, Activity and Service are two di↵erent interfaces for di↵erent functions to run. The Activ-ity interface is the front desk interface which normally interacts with users whereas the Service interface runs in the background and is responsible for handling computationally heavy tasks. Cuckoo utilizes the two interfaces and considers methods in the Activity interface as local and methods in the Service interface as remoteable. For the service interfaces, it auto generates the remote version of the service interfaces which runs on the cloud server VM. However, the automation only generates interfaces for remoteable methods. The actual implementation of these methods on a cloud server varies and still needs developers to manually code them.
2.1.2
Profiling and Monitoring
CloneCloud [6] [7] profiles the cost of running each remotable portion of an application under di↵erent platforms based on energy consumption and CPU cycles using test runs. The test runs generate a profile tree which stores these costs and later, these are used as guidance to make partition decisions.
MAUI [5] takes a di↵erent approach. It continuously monitors program and network characteristics during runtime including the amount of state that needs to be transferred for each method o✏oad, runtime duration and number of CPU cycles required. The monitored information is used to provide a more accurate estimate of the cost of each method’s call to determine whether it should be o✏oaded. The profiler records each method’s performance from the point it starts its execution until the end of the execution. The performance record is then analysed and used as a suggestion for the method’s future invocation. For example, if the method performs poorly after being o✏oaded, then next time it may not be o✏oaded. Instead it would run locally.
2.1.3
Partitioning
Chapter 2. Literature Review 7
In dynamic partitioning on the otherhand, partitioning is performed during runtime. In Cuervo et al. [5] when the execution hits an o✏oadable method, a decision making formula will take input from the dynamic profiling (input such as energy consumption, residual energy, runtime duration, state transferring cost and connectivity) and makes a decision on whether the method should be run remotely. However, this way of profiling and partitioning incurs additional overhead because of the need to constantly monitor application behaviour.
2.2
Use of Cloudlet
There is a considerable body of research on cloud structures [8] [9] [10] [11] [12] [13] [14] [15] [16] [17] [18] [4].
In Rossetto et al. [18], cloudlets are proposed to be used mainly as a workflow manager to process and manage a mobile device’s request (submission, monitoring, and download of application results) to execute in the cloud. There are three modules: Controller, Engine and Collector uniquely created on a cloudlet for each submitted application from a mobile device. The controller is responsible for receiving requests, sorting these requests, commanding and controlling their order through the application identifier. The engine sends a resource request of the application to the resource selector which is responsible for gathering information related to the grid environment and for selecting resources based on resource characteristics, authorization, usage policies and requirements that application tasks require.
Satyanarayanan et al. [4] proposes that cloudlets be used in place of cloud servers to handle requests from mobile devices. They propose a Transient Cloudlet Customization which features pre-use customization and post-use cleanup. It uses VM encapsulation to separate the application software environment from the cloudlet infrastructure’s perma-nent host software environment. They propose two di↵erent approaches for delivering the mobile state to the cloudlet: 1) Full VM migration, in which an already executing VM is suspended, its processor, disk, and memory state are transferred, and finally VM execution is resumed on the cloudlet from the exact point of suspension; 2) Dynamic VM synthesis, where the mobile device delivers a small VM overlay to the cloudlet infrastruc-ture that already possesses the base VM operating system on which this overlay is able to execute.
com-Chapter 2. Literature Review 8
puting resources: processing realm for parallel processing over many machines, streaming realm for handling streaming requests and general realm for running other servers such as XMPP or Web server.
Guan et al. [8] [9] generalize cloudlet usage into two models: 1) A remote access service model where mobile devices are used as a remote access point to interact with a cloudlet; 2) A substitution service model where services are o✏oaded to cloudlets for execution. They also propose a system infrastructure between mobile devices and cloudlets. In the infrastructure, the mobile devices maintain five modules: The Wireless Network Module which is responsible for low-level communication with cloudlets and other mobiles; the Device Proxy Module which is responsible for cloudlet discovery, initializing and ter-minating communications; the Execution Module sends a small script to a cloudlet so that it can download application code from the cloud; the Personal Information Module which stores user information and authentication and the Cache Module which stores interface codes and service status. The cloudlet’s role in the infrastructure is to first pro-cess mobile device requests, and if nepro-cessary, suitable cloud services requests are invoked through the cloudlet to forward mobile requests to actual cloud servers. The cloudlet also applies VM technology and, in the infrastructure, promotes the idea of context-based ontology which uses vocabularies or short terms to describe each mobile, cloudlet and cloud server’s characteristics so that a context reasoner can be implemented on cloudlets, which acquire context information from other entities and determine the optimal service to be accessed by the authenticated user.
Bahl et al. [11] proposes a RESTful programming model which promotes stateless o✏oad, that is, cloudlets and cloud server provide common function services through http/https protocol to mobile devices which developers can take advantage of when pro-gramming applications. Such services include: (1)A Platform service that provides com-puting, storage, database, memcache services; (2)An Application service that provides commonly used applications functions: video streaming, location services, push notifica-tion, speech/image recognition and context-rich support service that gathers user infor-mation and provides recommendations (e.g., suggested videos, purchases), and context extraction for mobile devices.
Chapter 2. Literature Review 9
choosing which cloudlet or cloud server it requests its service from. It proposes to bundle client and service code together. The service code does not run on mobile devices, but can be installed onto a cloud by mobile devices. It also proposes the development of a toolkit called Interdroid which helps developers to develop applications with good communication with the cloud. For example, it provides an application on a cloud that helps with pulling information o↵ the web and pushing notifications to mobile devices.
Rajachandrasekar et al. [14] argues that mobile devices are not only limited to being service recipients, but can also be computing resource providers. They argue that even though mobile CPU power and storage is limited, the aggregate of resources from a large number of mobile devices is significant. Mobile devices are used as resources in two ways: 1) Mobile Grids on-site where mobile devices are controlled by a central server, where each mobile device reports its capabilities and availability and the central server schedules the tasks; 2) Mobile Ad-Hoc Grid where there is no central server but rather devices form in an ad-hoc fashion, a virtual backbone consisting of more powerful mobile nodes responsible for coordinating distributed tasks.
Taylor et al. [15] propose to build applications which uses mobile devices with sensors as terminals to capture user interactions, and cloudlets as workspaces to hold temporary computing sessions for mobile devices in order to support rendering, processing sensor input, object tracking as well as caching information about its surrounding area.
Satyanarayanant et al. [16] propose multiple VM encapsulations on cloudlets where each encapsulates a di↵erent cognitive engine e.g., di↵erent cognitive services, object recognition, movement detection. A Control VM is responsible for all interactions with mobile devices including combining and outputing results from di↵erent cognitive VM engines to a single User Guidance VM to integrate together.
Ha et al. [27] also applies VM encapsulations on cloudlets. They propose the move-ment of VM encapsulations of mobile devices between cloudlets to maintain low end-to-end latency between mobile devices and cloudlets while mobile devices physically move around in a covered area.
2.3
Di
↵
erent Ways Of Cloudlet Prefetching Data
Chapter 2. Literature Review 10
Khawaga et al. [20] argues that mobile devices could form an ad-hoc network which is a multi-hop heterogeneous self-configured temporary network with dynamic topologies and without centralized administration. Within which, mobile devices can perform coop-erative caching, that supports sharing and coordination of cached data among multiple mobile nodes. Each mobile device in this network also uses admission control to deter-mine whether received data items should be cached. The admission control is based on factors such as the needs of neighbouring nodes: 1) General approach: All incoming data are cached; 2) Functional: A cost function is used to decide whether caching the data or not (distance, access frequency). Additionally, when local cached space is full on a mobile node, there are two options for cache replacement: 1) Local replacement in which cached data is evicted based only on local access behaviour; and 2) Coordinated behaviour in which the collective access behaviour of all mobile nodes in the ad hoc network is used.
Pingoy et al. [21] uses cloudlets to boost mobile video streaming performance for efficient social video sharing between users through pre-fetching videos for users and managing pre-fetched videos based on the frequencies that they have been accessed.
Sarwar et al. [22] applies Case Based Reasoning together with Artificial Neural Net-work algorithm in order to increase the hit rate of pre-fetching data.
Chapter 3
Cloud & Cloudlet & Mobile Data
Pre-fetch Architecture
3.1
Example Application
This section describes an application that may benefit from the use of cloudlets prefetch-ing data based on location.
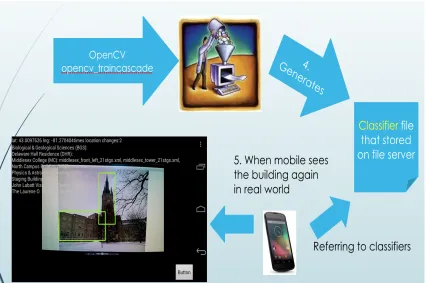
A computer vision application collects images of objects. These samples and labels (e.g., the building name) are provided to machine learning algorithms to generate classi-fiers. The classifiers are used to detect objects from future images/video clips [29]. As the detectable objects pool grows, more data is needed to be stored, which includes sample images as well as object classifiers.
In a cloud computing environment, a mobile application typically relies on the cloud to store all of the data (sample images, object classifiers) and then either allowing the cloud to run the detection algorithms through streaming the visual view of the detection subject (Google Goggle [30]) or downloading small portions of the classifier data pool to detect specific objects locally.
3.2
Architecture of a Stand Alone Application
There are four major functional units as follows: File manager, location service, detection unit and user interface (UI).
The file manager is responsible for finding and downloading files from a cloud server which stores all application related data. This includes an index of all buildings that have been sampled, classifier files of building candidates based on the location of the user, and
Chapter 3. Cloud & Cloudlet & Mobile Data Pre-fetch Architecture12
additional feed files such as images, videos and description links about buildings that are within the camera view.
The location service is responsible for periodically updating the location of the user. This is used to filter out buildings that are out of the mobile camera’s maximum distance.
For each camera frame captured, the detection unit executes the detection algorithms using the classifier of candidate buildings. These buildings are determined by location.
The User Interface (UI) is responsible for reading and rendering detection results. In additional it manages the presentation of extra feeds (e.g., image galleries, video links, floor maps) for identified buildings to the user.
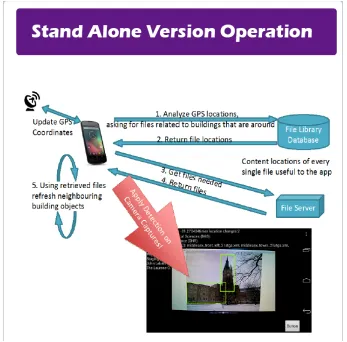
Program execution is graphically depicted in Figure 3.1. Execution starts from the file manager downloading the list of all buildings of a relatively large area (e.g., the list of all buildings within Western University) from a cloud server and the location service retrieving the user’s current GPS location. The GPS location is used together with a pre-set radius of 100 meters (which is typical for a mobile camera view range) by the location analysis function in the mobile application to filter the buildings list and generate a small pool of nearby building candidates. The file manager then downloads all classifier files that are related to these candidate buildings from the cloud server. Meanwhile, the detection software starts looping through each camera frame. The downloading of files is parallel to the detection. When there are no classifiers downloaded, the detection software detects nothing and a normal camera frame is rendered to the user. As classifiers are downloaded one after another, the detection software is able to detect more and more buildings in the camera frames. When the building is detected, the detection results are used by both the file manager and user interface. The file manager uses the result to download additional feed information about the building and the UI uses the result to display on the mobile screen.
3.3
Architecture of a Cloud Version
Chapter 3. Cloud & Cloudlet & Mobile Data Pre-fetch Architecture13
Figure 3.1: process of stand alone version
3.3.1
Client
The location unit is responsible for retrieving the user’s current location coordinates. The location coordinates are sent to the server. The file manager downloads the extra feeds of buildings when the detection results are returned from the server.
Chapter 3. Cloud & Cloudlet & Mobile Data Pre-fetch Architecture14
The stream sent is the original video stream with detected buildings marked out on each video frame. The reason why the live video stream is used over transmitting only a series of images between client and server is because the mobile camera captures on average 30 frames per second. Each frame can be considered as a single image which can be used for detection. Although the client and server can manage the transmission of 30 images per second, the 30 frames in a second can be highly compressed, and thus we use video streaming to packetize the video into packets and then transmit the packets between the client and server, which is a more efficient way of transmitting the data.
3.3.2
Server
The server part of the application detects the buildings, filters buildings based on location coordinates sent by the client, and a file manager for pre-fetching data based on the location of the cloudlet from the cloud. In addition, there are Outbound streaming, Inbound streaming and messenger units which are similar to those found in the clients. The server part also includes a transcoding unit which converts the video stream into formats that are used by each of the outbound stream, inbound stream and messenger.
3.3.3
Full Program Cycle
Chapter 3. Cloud & Cloudlet & Mobile Data Pre-fetch Architecture15
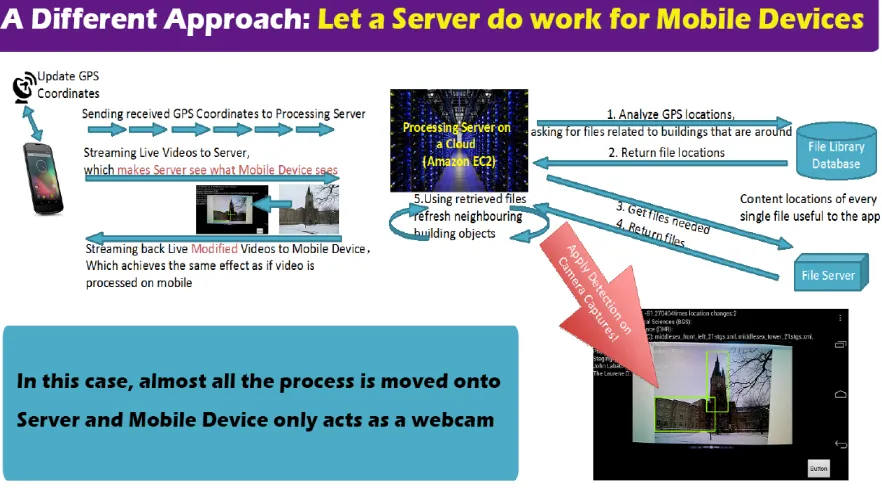
After going through detection, each video frame is then converted back to H264 format and streamed back by the server’s outbound streaming unit. Lastly, the client’s inbound streaming unit receives the video stream back which is displayed on the screen.
Figure 3.2: process of Client-Server version
This example is not unique and can be generalized into many di↵erent stand alone/cloud based application architectures. Applying cloudlet-based network architectures to appli-cations has several benefits. First, all application related data (in the case of the example, this includes: sample images and classifiers) can be pfetched onto cloudlets. This re-leases storage of mobile devices from storing data locally while still providing a relatively faster access of the data than having to access cloud servers directly. Secondly, since cloudlets possess computing power, the mobile requests is resolved at cloudlets instead of forwarding to cloud servers. This reduces workload on a cloud as well as reduces network traffic in the network core.
Chapter 3. Cloud & Cloudlet & Mobile Data Pre-fetch Architecture16
Chapter 4
Experimental Environment
This chapter describes the experimental environment.
4.1
Application
The application used in the experiments identifies buildings and landmarks. Once a building is detected the application will use coloured rectangles to mark out the detected buildings/landmarks on screen. In addition, it displays extra feeds (including images gallery, video clips and short descriptions of identified buildings on to the side of the screen).
There are two versions of the application. The stand-alone version runs on the mobile devices and only downloads data from the cloud. In the cloud/cloudlet version, the mobile device sends live video stream of its camera to the cloud/cloudlet server where the software for identifying building/landmarks take place. The cloud/cloudlet server also pre-fetches application related data to avoid time cost on downloading them during actual application runtime.
4.2
Object Recognition
The application requires object recognition algorithms for identifying a specific object in a digital image. In this work, we used object recognition algorithms based on supervised machine learning which uses training data with labels to learn a model of the data. The training data represents features that includes edges, gradients, histograms of oriented gradients (HOG), Haar wavelets and linear binary patterns [31]. Object recognition algorithms are implemented in OpenCV [32]. The preparation for the machine learning
Chapter 4. Experimental Environment 18
process includes:
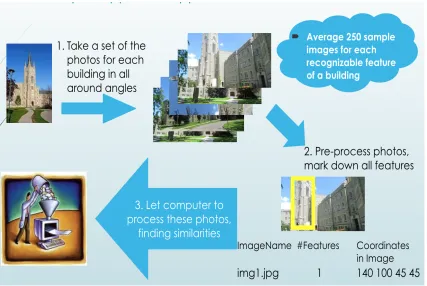
1. Collection of Samples: An average of 250 sample images were gathered for each target object representing a building/landmark. The reason why the number of sample images may vary from building to building is becuse di↵erent buildings have di↵erent features. Some have only one significant feature while others have multiple features. Each feature needs to be trained separately and therefore some buildigns end up having more sample images than others. These images are used as training data by the OpenCV machine learning algorithm: opencv traincascade, which supports both Haar wavelets and LBP (Local Binary Patterns) features [33].
2. Pre-Processing of the Samples: The sample images are pre-processed. For example, writing down target object position coordinates relative to each sample image, removing negative images, using image filters on images for contrast enhancement and image scaling to get more useful features of the target object.
3. Generation of Object Classifiers: The training data is provided to the machine learning algorithm: opencv traincascade. The classifiers generated this way represent the object features and will be applied later on to identify the object from other images or views.
Chapter 4. Experimental Environment 19
Figure 4.2: how does detection happen
4.3
Video Streaming and Transcoding
Video Streaming and transcoding technologies are applied in the cloud/cloudlet version prototype for the purpose of sending camera captured views from mobile devices to the cloud. It is also applied in the reverse process which mobile devices receive the detected & modified camera views from cloud. The H264 standard [34] is used when compressing camera views into packets and sent to the designated server.
4.4
Application implementation
Chapter 4. Experimental Environment 20
been generated). This concept is applied in both versions of the prototype.
4.4.1
Stand Alone Version implementation
Programming languages and OS
The stand alone version is programmed in an Android OS 5.1.1 Lollipop environment using Android Studio 2.0. The external library OpenCV-android-sdk 3.0 [32] is used for handling object detection.
4.4.2
Cloud Version Implementation
Programming languages and OS
The mobile side is programmed in an Android OS 5.1.1 Lollipop environment using Android Studio 2.0. The external libraries used include libstreaming [35] for handling outbound streaming from mobile devices and vlc-android-sdk [36] for handling inbound streaming to mobile devices.
The server side is programmed in both Linux(CentOS and Ubuntu) and a Mac OSX environment. The external libraries include OpenCV 3.0 for Macosx/Linux [32] for han-dling object detection, FFMPEG libraries [37] for hanhan-dling inbounding video streaming as well as video transcodings, Live555 [38] for handling outbound streaming from the server, and libcurl 7.41.0 [39] and rapidxml 1.13 [40] are used for handling file download-ing and file content parsdownload-ing.
Additionally, we uses Session Description Protocol (SDP) to pass along video stream-ing port and type of video codex. between mobile devices and servers.
4.5
Testbed
Chapter 4. Experimental Environment 21
4.6
Testing Goal and Metrics
Evaluation metrics include the following:
1. Latency
The latency measures the time needed for an application to download files or ac-cess data from cloud servers as well as transmitting to and receiving packets from cloud/cloudlet servers. The time is measured in milliseconds.
2. Battery usage
The battery usage measures energy consumption of an application’s run. In the experiment, we let each version of the application run a certain time period and measured the energy consumption in milliwatt-hour (mWh)/milliampere-hour (mAh).
3. Frame rate
The frame rate defines the smoothness of the visual display, measured by Frames Per Second (FPS), which indicates how many video frames are updated every second.
4. CPU, RAM and GPU usage
Chapter 5
Experiments
This chapter evaluates the two architectures presented in Chapter 2. The two di↵erent versions of the application enable us to perform a series of tests and comparisons around using cloud server/cloudlet.
5.1
Experimental Setup
The experimental setup is organized so that it is representative of an organization of servers that includes cloud server, cloudlet server, local server and a mobile device.
The first cloud server is provided by Amazon EC2 and is located in Ashburn, Virginia, USA. We use the name Amazon EC2 in the rest of this chapter. The specifications of this server are the following:
OS: Linux - Ubuntu 14.04
CPU: Intel(R) Xeon(R) CPU E5-2676 v3 @ 2.40GHz, 1Core RAM: 1.02GB Memory
The second cloud server is located at Western University in London Ontario. We use the name Circe in the rest of this chapter. The specifications of this server are the following:
OS: Linux version 2.6.32-279.19.1.el6.x86 64, CentOS release 6.3 CPU: Intel(R) Xeon(R) CPU E7- 4820 @ 2.00GHz, 64 Cores RAM: 793.97GB Memory
The local server is a laptop. We use the name Macbook pro in the rest of this chapter. The specifications are the following:
OS: Mac OS X Yosemite 10.10.5
CPU: Intel(R) Core(TM) i5-5257U CPU @ 2.70GHz, 1 Cores
Chapter 5. Experiments 23
RAM: 8 GB Memory
The mobile device specifications are the following:
LGE Nexus 4
OS: Android Version: 5.1.1
GPU: Qualcomm Adreno (TM) 320
CPU Cores: 4 — Min-Max Frequencies: 384Mhz - 1.51Ghz
5.2
Data location vs Data Retrieval Experiments
This first series of experiments measures file downloads from cloud servers. The servers are at di↵erent distances and the files vary in size. The time to download a file is measured in milliseconds. The time to download a file is based on the di↵erence of the timestamp taken before the request for a file download is made and the timestamp taken after the file download.
The stand alone version of the application is used in this test and all three servers are used. There are various types of files to be downloaded including: Utility file (the buildings index file size is 12 kilobytes), buildings’ classifiers (file sizes are between 16 kilobytes to 41 kilobytes) and images about each building. This includes thumbnail images (file sizes are between 5 to 6 kilobytes) and full size images (file sizes are between 220-250 kilobytes). In addition we tested the time it takes for a SQL query to complete between the client to the server MySQL database. The time associated with an SQL query is measured in a similar fashion to file downloads. A client uses the SQL query to specify a building which is used to query the cloud server’s database to find any video links, text informations, and the download paths for any files associated with the building.
5.2.1
Metric
Chapter 5. Experiments 24
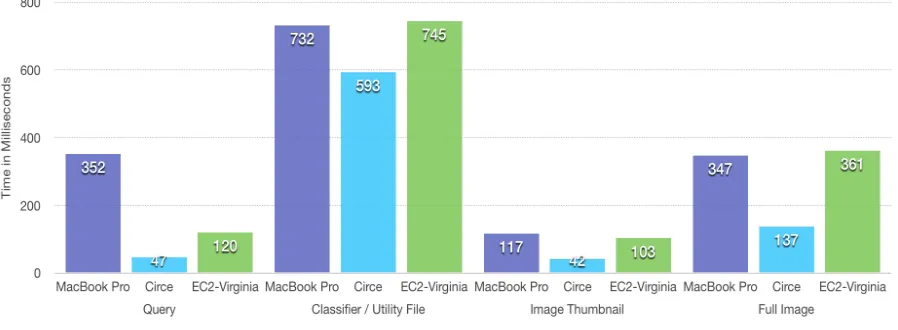
5.2.2
Test 1
The mobile device is physically located in Middlesex College, at The University of West-ern Ontario (UWO), in London, Ontario. The application is executed three times with each execution retrieving data (e.g., files and additional information as described in Chap-ter 5.2) from a di↵erent cloud server e.g., Amazon EC2, Circe and Macbook Pro. In each run, the application made on average 12 SQL queries including one query for finding the building list file’s download path and 4 to 7 queries for finding download paths for the classifiers of buildings and 4 to 8 queries for finding the download paths of additional images or text information about buildings, e.g., video links, website links or text de-scriptions. The application made 1 utility file download and on average 6 to 12 building classifier downloads, 25 to 36 thumbnail image downloads and 15 to 24 full size image downloads. The results in Figure 5.1 present the average time to complete a query, to download classifiers, utility files and images from three di↵erent servers. Data access is the fastest from the Circe server. This could be because the mobile device is physically located in Middlesex College and within the same subnet as Circe. We assumed that the Macbook Pro would have the fastest access time since there is a LAN connection to the mobile device. However, the results do not show this. This may be the result of subnet security at Western where it wasn’t possible for the mobile to reach the Macbook Pro through the same subnet used to reach Circe or Amazon EC2. As a result, we had to switch to a di↵erent router (Cisco Linksys E1200) to perform the LAN connection test. This might result in unusual performance when the mobile device accesses the Macbook Pro.
Chapter 5. Experiments 25
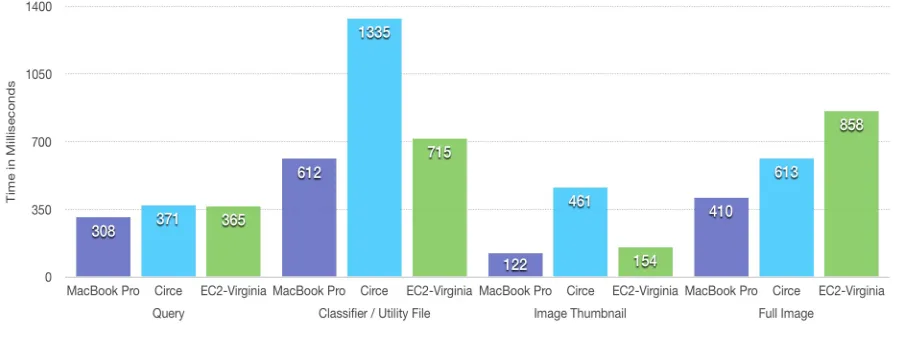
5.2.3
Test 2
The second test is similar to Test 1 except the mobile device is physically at a di↵erent place: 120 Cherryhill Place, London, Ontario. The distance from the mobile device to Circe increases. The results are presented in Figure 5.2 as accessing all three servers through the same home cable router. While the mobile device moves away from the sub-net of Circe, the latency of accessing Circe increases significantly. The time to download a file or to complete a query exceeded that of Amazon EC2 except for full images. This result was not what we expected since the Circe server is located at a closer distance compared to Amazon EC2 in the locations for Test 1 and Test 2. The time to access data from Amazon EC2 increased slightly compared to Test 1. The Macbook Pro main-tained the performance compared to Test 1, which is expected since there are no other network hops between the LAN connection of the Macbook Pro and the mobile device and therefore less variation in the time to make an SQL query or download files.
Figure 5.2: VERSION 1 - TEST 2
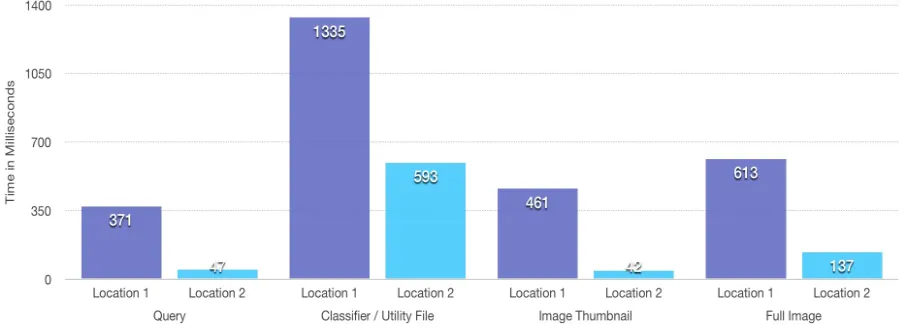
Figure 5.3 presents Circe’s download times from Test 1 and Test 2. It clearly shows Circe’s performance varies significantly as the mobile device moves from within the same subnet of Circe to outside of the subnet.
Location 1: 120 Cherryhill Place, London, Ontario (Three kilometres away from
where Circe located, which is outside the same subnet of Circe)
Location 2: Middlesex College, UWO, London, Ontario (Exactly where Circe
Chapter 5. Experiments 26
Figure 5.3: Accessing Circe from two di↵erent locations - Comparison 1
5.2.4
Test 3
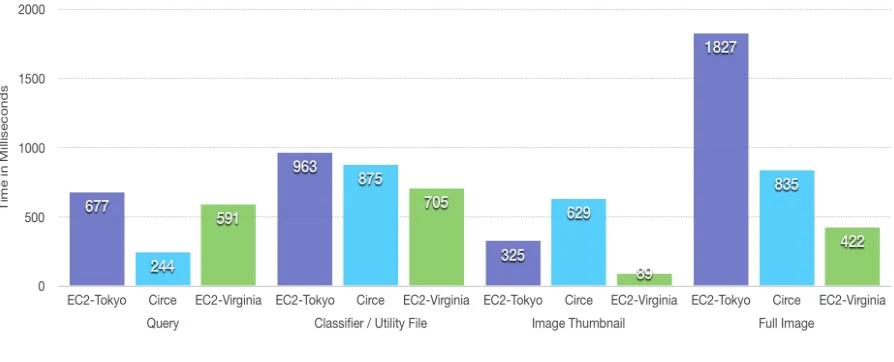
Although we expected the time to retrieve data from Circe would vary between the two locations, we were unsure why accessing data from Circe takes longer than Amazon EC2 except for full sized images. This third test performed uses the same setup as Test 1 and Test 2, except that the mobile device is physically located at a di↵erent place: 50 Capulet Lane, London, Ontario. The distance from the mobile device to Circe increases further and this time we used Circe, Amazon EC2 located in Virginia, USA and an additional Amazon EC2 server located in Tokyo, Japan. The results are presented in Figure 5.4. Circe outperforms both Amazon servers for queries this time, while the Amazon server in Virginia outperforms Circe again for both file downloads and image thumbnails which is consistent to the results seen in Test 2. However, if we look at the performance of the Amazon EC2 Tokyo, we can clearly see that longer physical distance between mobile devices and cloud does impact application performance as it was observed the Circe was faster for data access except for image thumbnail downloads.
5.2.5
Discussion
Combining Test 1, 2 and 3, we observe the following:
Chapter 5. Experiments 27
Figure 5.4: VERSION 1 - TEST 3
3. The classifiers / utility file download time of Circe varies significantly between Test 2 and 3 although the two locations (120 Cherryhill Place and 50 Capulet Lane) are fairly close to each other. Note, the WIFI connection uses the same router, same ISP and same Internet. However the available bandwidth on the connection between the home router and the ISP router may vary.
First of all, we can not eliminate network fluctuations during the experiments. There-fore, there are factors that could a↵ect the results. First, there are outliers where one or several queries or file downloads takes a significant amount of time compared to the average. Second, because some of the data are relatively small in size and their down-load times are measured in milliseconds, even a small network fluctuation could result in significant changes in download times. Therefore, to better understand the data, we should consider the following:
1. Amazon - Virginia out performs Circe and both outperform Amazon - Tokyo in most types of data accesses.
2. Circe performance varies based on if it is located in the same subnet as the mobile device.
Chapter 5. Experiments 28
5.2.6
Additional Comparisons
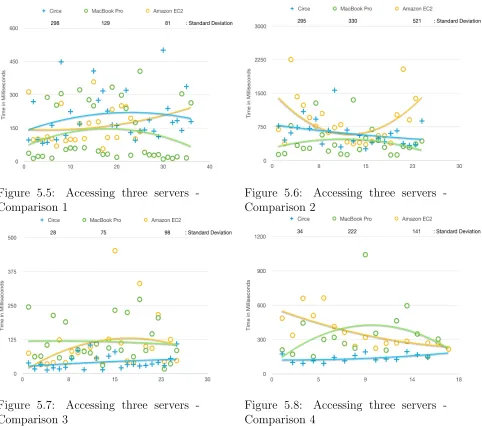
Tests 1 and 2 show the average time to download data. We present four additional com-parisons (Figure 5.5, 5.6, 5.7, and 5.8) which present download times when the mobile device is physically located at two di↵erent places and downloads data from the three di↵erent servers. Each dot in the graphs stands for the download time of a single image file (thumbnail image sizes are between 5 to 6 kilobytes and full size image sizes are be-tween 220-250 kilobytes), the y-axis stands for the exact download time in milliseconds and the x-axis means nothing expect simply laying out the results in a evenly distributed manner so that every file download result is shown without overlapping. The curved lines are polynomial regression of the dots generated by Mac Software Numbers. This is used to make it easier to make visual comparisons of download times from the three di↵erent servers.
Comparison 1: Figure 5.5 shows the time to download thumbnail images from each server while the mobile device is at 120 Cherryhill Place, London, Ontario.
Comparison 2: Figure 5.6 shows the time to download full images from each server while the mobile device is at 120 Cherryhill Place, London, Ontario.
Comparison 3: Figure 5.7 shows the time to download thumbnail images from each server while the mobile device is at Middlesex College, UWO, London, Ontario.
Comparison 4: Figure 5.8 shows the time to download full images from each server while the mobile device is at Middlesex College, UWO, London, Ontario.
5.3
Streaming cost incurred in Cloud Version
Appli-cation
Chapter 5. Experiments 29
Figure 5.5: Accessing three servers -Comparison 1
Figure 5.6: Accessing three servers -Comparison 2
Figure 5.7: Accessing three servers -Comparison 3
Figure 5.8: Accessing three servers -Comparison 4
our experiments related to the cloud version of the application.
Two servers are used for comparisons: The Circe server and the Macbook Pro server. The mobile device is at 50 Capulet Lane, London, Ontario. We measure the time be-tween sending the camera view of the video stream to the server and the receiving of the video stream from the server. Two timestamps are used. The first is before the stream-ToServer() function which is used to send the camera view. The second timestamp is placed before the setSurfaceSize() function which sets the video display size and starts rendering the modified video stream from the server. The di↵erence is referred to as latency. We use the Android function System.currentTimeMillis() for the timestamps.
Chapter 5. Experiments 30
is 5242 milliseconds with standard deviation of 230 milliseconds. Figure 5.10 assumes the server Circe. The average latency is 6680 milliseconds with standard deviation of 823 milliseconds.
Figure 5.9: Mobile Server Latency -MacbookPro
Figure 5.10: Mobile Server Latency -Circe
To compare this result with stand lone version, we uses the same two servers and from the same location to measure stand lone version’s time between downloading the initial building list and rendering the first detected camera view. Two timestamps are used. The first is before thefileManager.startFilePreparation(ACTION GET GENERAL FILE, ”build-ings”)function which is used to download the building list file. The second timestamp is placed after thePrepareFile() function which used to download all classifiers from server. We also use the Android function System.currentTimeMillis() for the timestamps.
In stand lone version, the nearby building intensity and each building’s di↵erent features decide how many building classifiers files need to be downloaded. The more classifiers that needed to be downloaded is expected to incur a longer latency before users are able to see detected results. To also experiment on this, we use the above setup to perform two tests. First includes only single building as nearby buildings and second includes four buildings as nearby buildings. The one building only requires 1 to 2 classifier files to be downloaded while the four buildings requires total of 6 classifier files to be downloaded.
Chapter 5. Experiments 31
deviation of 304 milliseconds. Figure 5.13 and Figure 5.14 shows the latencies of single and four nearby buildings when the server is Circe. The average latency incurred with single nearby building is at 3135 milliseconds with standard deviation of 437 millisec-onds. The average latency incurred with four nearby buildings is 8332 milliseconds with standard deviation of 1503 milliseconds.
Figure 5.11: MacBookPro - Mobile
StandAlone - Single Building
Figure 5.12: MacBookPro - Mobile
StandAlone - Four Building
Figure 5.13: Circe - Mobile StandAlone - Single Building
Figure 5.14: Circe - Mobile StandAlone - Four Building
5.3.1
Discussion
Chapter 5. Experiments 32
In the cloud version, the user of the device will receive a marked up video after 5000 to 6000 milliseconds. However, it prefetches classifier files so there is no download time during application execution.
Essentially the results suggest that the more buildings there are within camera view, the more classifiers that need to be downloaded to the mobile device. This would result in the stand alone version being slower whereas the cloud version would not be a↵ected by this change.
5.4
Stand Alone Version and Cloud Version
Perfor-mance Comparison Experiment
In this section we examine the performance di↵erence between the stand alone version and the cloud version. We look at the performance comparison from five di↵erent as-pects: Battery consumption, Frame rate, CPU Usage, RAM Usage and GPU Usage. The performance is measured by a third party software called GameBench [41].
5.4.1
Metrics
The total battery consumption is measured by milliwatt-hour (mWh)/ milliampere-hour (mAh). Both versions of the application are executed for 16 minutes (which is the minimum required duration for battery consumption observation by GameBench) and measures battery consumption. The second metric is the frame rate which is measured by frames per second (FPS) that indicates the number of frames rendered in a second. A higher frequency indicates smoother video display. The third metric is CPU usage, which is measured by the percentage of total CPU capacity needed for running the application. The fourth metric is RAM usage, which is measured in megabyte indicating how much RAM the application needs to reserve in order to run. The last metric is GPU usage, which is measured as the percentage of total GPU capacity needed for graphically rendering the application screen.
Stand Alone version performance:
Chapter 5. Experiments 33
Figure 5.15: Stand Alone Version Performance - Battery
The total battery consumption is 564.40 mWh
Figure 5.16: Stand Alone Version Performance - Battery - Sum
2. Frame rate: The stand alone version has an average frame rate of 21 fps and 99% FPS Stability where the FPS Stability measures how stable the frame rate keeps at the average frame rate through out the application run
Chapter 5. Experiments 34
3. CPU Usage: The stand alone version has an average CPU usage of 21%, a 66.09% peak CPU ssage and 384Khz - 1.51Ghz minimum and maximum CPU frequencies
Figure 5.18: Stand Alone Version Performance - CPU
4. RAM Usage: The stand alone version has an average memory usage of 54MB and 60MB peak memory usage
Figure 5.19: Stand Alone Version Performance - RAM
Chapter 5. Experiments 35
Figure 5.20: Stand Alone Version Performance - GPU
Cloud version performance:
1. Battery consumption:
Figure 5.21: Cloud Version Performance - Battery
The total battery consumption is 195.75mWh
Chapter 5. Experiments 36
2. Frame rate: The cloud version has an average frame rate of 30 fps and 97% FPS Stability
Figure 5.23: Cloud Version Performance - FrameRate
3. CPU Usage: The cloud version has an average CPU usage of 5.29%, 27.16% peak CPU usage and 384Khz - 1.51Ghz minimum and maximum CPU frequencies
Figure 5.24: Cloud Version Performance - CPU
Chapter 5. Experiments 37
Figure 5.25: Cloud Version Performance - RAM
5. GPU Usage: The cloud version has an average GPU usage of 2.11% and 5.47% peak GPU usage
Figure 5.26: Cloud Version Performance - GPU
There’s a clear improvement of performance from running everything locally to of-floading major tasks onto cloud server/cloudlet. These improvements include reduced CPU and memory usage for the mobile device and reduced battery consumption for the mobile device to keep the application running.
5.5
Weaknesses
Chapter 5. Experiments 38
Chapter 6
Conclusion and Future Work
6.1
Conclusion
In this thesis, we designed and implemented a live building detection mobile application in a stand alone version and a cloud version. Using the two versions of an applications as test programs, we set up a cloudlet architecture to experiment on the e↵ectiveness of cloudlets. Our work suggests that cloudlets can improve performance of mobile applications in two ways: First, o✏oading computationally expensive functions to cloudlets can significantly reduce the resource requirements on mobile devices which includes reduced battery usage, reduced CPU/GPU usage as well as reduced memory usage. Second, the cloudlet’s pre-fetch ability provides mobile devices with a faster and more stabilized data access without the need to store additional data on the local storage of mobile devices.
6.2
Future Work
Because of the nature of our prototype applications there potentially is a need for a large amount of data storage where the data are content and context based (In our application, we only had buildings data for Western campus only. This could certainly grow to a much larger scale such as a city, a country or even globally). Also worth noting is that the application is only in prototype stage. We can put more work into improving its performance. Additionally, this brings us to the future work of exploring a more generalized cloudlet architecture to adapt to a broad range of mobile applications and sophisticated context and content based cloudlet data pre-fetching which we hope would result in more data pre-fetching efficiency and accuracy.
Bibliography
[1] M Ribicre and P Charlton. Cisco visual networking index: Global mobile data traffic forecast update.” cisco, inc., 2014-2019.
[2] Peter Lynch. The origins of computer weather prediction and climate modeling.
Journal of Computational Physics, 227(7):3431–3444, 2008.
[3] A Ericsson. Ericsson mobility report, on the pulse of the networked society.Ericsson, Sweden, Tech. Rep. EAB-14, 61078, 2012.
[4] Mahadev Satyanarayanan, Paramvir Bahl, Ram´on Caceres, and Nigel Davies. The case for vm-based cloudlets in mobile computing. IEEE pervasive Computing, 8(4):14–23, 2009.
[5] Eduardo Cuervo, Aruna Balasubramanian, Dae-ki Cho, Alec Wolman, Stefan Saroiu, Ranveer Chandra, and Paramvir Bahl. Maui: making smartphones last longer with code o✏oad. In Proceedings of the 8th international conference on Mobile systems, applications, and services, pages 49–62. ACM, 2010.
[6] Byung-Gon Chun and Petros Maniatis. Augmented smartphone applications through clone cloud execution. In HotOS, volume 9, pages 8–11, 2009.
[7] Byung-Gon Chun, Sunghwan Ihm, Petros Maniatis, Mayur Naik, and Ashwin Patti. Clonecloud: elastic execution between mobile device and cloud. In Proceedings of the sixth conference on Computer systems, pages 301–314. ACM, 2011.
[8] Tao Guan, Ed Zaluska, and David De Roure. A grid service infrastructure for mobile devices. In2005 First International Conference on Semantics, Knowledge and Grid, pages 42–42. IEEE, 2005.
[9] Tao Guan, Ed Zaluska, and David De Roure. Extending pervasive devices with the semantic grid: A service infrastructure approach. In The Sixth IEEE
BIBLIOGRAPHY 41
tional Conference on Computer and Information Technology (CIT’06), pages 113– 113. IEEE, 2006.
[10] Dejan Koavchev, Yiwei Cao, and Ralf Klamma. Mobile multimedia cloud computing and the web. InMultimedia on the Web (MMWeb), 2011 Workshop on, pages 21–26. IEEE, 2011.
[11] Paramvir Bahl, Richard Y Han, Li Erran Li, and Mahadev Satyanarayanan. Advanc-ing the state of mobile cloud computAdvanc-ing. InProceedings of the third ACM workshop on Mobile cloud computing and services, pages 21–28. ACM, 2012.
[12] Debessay Fesehaye, Yunlong Gao, Klara Nahrstedt, and Guijun Wang. Impact of cloudlets on interactive mobile cloud applications. In Enterprise Distributed Ob-ject Computing Conference (EDOC), 2012 IEEE 16th International, pages 123–132. IEEE, 2012.
[13] Roelof Kemp, Nicholas Palmer, Thilo Kielmann, and Henri Bal. The smartphone and the cloud: Power to the user. InInternational Conference on Mobile Computing, Applications, and Services, pages 342–348. Springer, 2010.
[14] Raghunath Rajachandrasekar, Rupak Nagarajan, G Sridhar, and G Sumathi. Job submission to grid using mobile device interface. In Nature & Biologically Inspired Computing, 2009. NaBIC 2009. World Congress on, pages 170–174. IEEE, 2009.
[15] Cynthia Taylor and Joe Pasquale. Towards a proximal resource-based architecture to support augmented reality applications. In 2010 Cloud-Mobile Convergence for Virtual Reality Workshop (CMCVR 2010) Proceedings, pages 5–9. IEEE, 2010.
[16] Mahadev Satyanarayanan, Zhuo Chen, Kiryong Ha, Wenlu Hu, Wolfgang Richter, and Padmanabhan Pillai. Cloudlets: at the leading edge of mobile-cloud conver-gence. In Mobile Computing, Applications and Services (MobiCASE), 2014 6th International Conference on, pages 1–9. IEEE, 2014.
[17] Paolo Bellavista, Marcello Cinque, Domenico Cotroneo, and Luca Foschini. Self-adaptive hando↵ management for mobile streaming continuity. IEEE Transactions on Network and Service Management, 6(2):80–94, 2009.
BIBLIOGRAPHY 42
[19] Francisco Rodrigo Duro, Javier Garcia Blas, Daniel Higuero, Oscar Perez, and Jesus Carretero. Cosmic: A hierarchical cloudlet-based storage architecture for mobile clouds. Simulation Modelling Practice and Theory, 50:3–19, 2015.
[20] Sally E El Khawaga, Ahmed I Saleh, and Hesham A Ali. An administrative cluster-based cooperative caching (accc) strategy for mobile ad hoc networks. Journal of Network and Computer Applications, 69:54–76, 2016.
[21] Edward E Pingoy and Osvaldo Gervasi. An e↵ective and innovative streaming model for videos in mobile computing. 2013.
[22] Sohail Sarwar, Zia Ul-Qayyum, and Owais Ahmed Malik. A hybrid intelligent system to improve predictive accuracy for cache prefetching. Expert Systems with Applica-tions, 39(2):1626–1636, 2012.
[23] Emmanouil Koukoumidis, Dimitrios Lymberopoulos, Karin Strauss, Jie Liu, and Doug Burger. Pocket cloudlets. In ACM SIGPLAN Notices, volume 46, pages 171–184. ACM, 2011.
[24] Erik Nygren, Ramesh K Sitaraman, and Jennifer Sun. The akamai network: a plat-form for high-perplat-formance internet applications. ACM SIGOPS Operating Systems Review, 44(3):2–19, 2010.
[25] Je↵rey Richter. CLR via c#, volume 4. Microsoft Press Redmond, 2006.
[26] Roelof Kemp, Nicholas Palmer, Thilo Kielmann, and Henri Bal. Cuckoo: a compu-tation o✏oading framework for smartphones. InInternational Conference on Mobile Computing, Applications, and Services, pages 59–79. Springer, 2010.
[27] Kiryong Ha, Yoshihisa Abe, Zhuo Chen, Wenlu Hu, Brandon Amos, Padmanabhan Pillai, and Mahadev Satyanarayanan. Adaptive vm hando↵ across cloudlets. Tech-nical report, TechTech-nical Report CMU-CS-15-113, CMU School of Computer Science, 2015.
[28] Memcached. https://memcached.org/. Accessed: 2016-10-19.
[29] Jim R Parker. Algorithms for image processing and computer vision. John Wiley & Sons, 2010.
BIBLIOGRAPHY 43
[31] Mathworks object recognition. http://www.mathworks.com/discovery/object-recognition.html?requestedDomain=www.mathworks.com. Accessed: 2016-10-19.
[32] Opencv. http://opencv.org/. Accessed: 2016-10-19.
[33] Opencv. http://docs.opencv.org/2.4/doc/user guide/ug traincascade.html. Ac-cessed: 2016-10-19.
[34] Thomas Wiegand, Gary J Sullivan, Gisle Bjontegaard, and Ajay Luthra. Overview of the h. 264/avc video coding standard. IEEE Transactions on circuits and systems for video technology, 13(7):560–576, 2003.
[35] [email protected]. https://github.com/fyhertz/libstreaming. Accessed: 2016-10-19.
[36] Videolan. https://code.videolan.org/videolan/vlc-android.git. Accessed: 2016-10-19.
[37] Ffmpeg. https://↵mpeg.org/. Accessed: 2016-10-19.
[38] Live networks. http://www.live555.com/. Accessed: 2016-10-19.
[39] Curl. https://curl.haxx.se/. Accessed: 2016-10-19.
[40] Marcin Kalicinski. http://rapidxml.sourceforge.net/index.htm. Accessed: 2016-10-19.
Appendix A
Application Preparations and
Detailed Implementation
A.1
Preparations
A.1.1
Generate pre-defined building classifiers for Computer
Vision functions
1. Gather building source images: Taking one building as an example, it may have several distinguishable features, such as pointy roof, glass wall, colourful paint. Each pre-defined building classifier represents a single feature. Therefore, a building may have several related classifiers. To generate each classifier, firstly a video clip is taken to capture one building feature from di↵erent angles all around. Then, the video clip is chopped into images using the ↵mpeg function:
FPS Video Filter: Output one image every second, named out1.png, out2.png, out3.png, etc.
↵mpeg -i input.flv -vf fps=1 out%d.png
2. Mark-up source images: After obtaining an image group about a building feature, these images are then to be marked-up by recording the top-left pixel coordinate and the bottom right pixel coordinate that the building feature are bounded within a rectangle box. Additionally, we prepared a group of negative images(background images). These images do not contain the target building feature and is for the purpose of comparison in later classifier training algorithms. Finally, all these images are fed through the OpenCV cascade classifier training functions to generate classifier file named after the building’s feature.
Chapter A. Application Preparations and Detailed Implementation 45
Firstly create samples: opencv createsamples
-vec positive example/middlesex.vec -info middlesex img/info.txt
-bg negative example/bg bg.txt -num 162
-w 300 -h 300
-vec is the output samples’ destination folder after running opencv createsamples command
-info is path to a file that contains a list of each positive image’s file name and the corresponding coordinates of the feature position in the image
-bg is path to a file that contains a list of negative images -num is the total number of positive images
-w & -h are the width and height of the output samples of the feature in pixels After running opencv createsamples, it generates an output sample group bases on all the images that were fed to the algorithm. Next, runs the training command:
opencv trancascade
-data middlesex classifiers/
-vec positive example/middlesex.vec -bg negative example/bg bg.txt -numPos 20
-numNeg 2 -numStages 8 -w 300
-h 300
-data is the output classifier destination folder
-vec is the sample folder previously generated by opencv createsamples command -bg is path to a file that contains a list of negative images
-numPos & -numNeg are the number of positive and negative images that choose to be used in each stage of the training
MiddleSexCol-Chapter A. Application Preparations and Detailed Implementation 46
lage MainTower.xml. The same process repeats for other features of the same building as well as other buildings.
A.1.2
Record down each building’s geographic location
As previously stated in the application design, geographic locations of the application user is vital. In order to use a user’s geographic location, a pool of buildings’ geographic location is created and stored in a XML file format where each building’s name pairs with its geographic location. This is the building list file used in both version of application.
A.2
Application source code
A.2.1
Stand Alone Version Components
Constants.java: It pre-defines file types that is used in application(image, utility, clas-sifier, building info), types of messages that helps communication between separate func-tion groups, and database & file server address that applicafunc-tion connects to.
Camera Activity.java: The main activity of the application. This stand alone version can be grouped into 7 functional groups: Messenger, File Manager, GPS Locator,
Camera, Building Info,OpenCV Detectionand UI. Each will be stated separately for clearer presentation.
Messenger and its handler:
Messenger and handler in this app is designed to let di↵erent functional group com-municates with Main Activity(Main Thread), so that Main Activity can direct the next process based on what the return message contains. Upon Main Activity’s onCreate function, a main activity messenger is initialized. Together, it set-ups its handler to main activity message handle where it states how to handle di↵erent type of messages. There are a total of 6 di↵erent types of messages in the current version, and could easily expand more following the same loop design(more of future works to perfect the appli-cation):
MAIN ACTIVITY MESSAGE: The only purpose of this message is to let other func-tional groups know where to pass back return messages. It carries no message but the
replyTo attribute beingmain activity messenger.
func-Chapter A. Application Preparations and Detailed Implementation 47
tional group to notify Main Thread that a previously initialized remote file download task is complete. The application currently consists of 4 di↵erent types of files: UTIL-ITY FILE, CLASSIFIER FILE, BUILDING INFO and IMAGE FILE. A helper class
FileCompletionMessage is also created so that File Manager can send Main Thread the same file completion message but with di↵erent file type specified.
BULDING INFO ONCLICK: This message’s purpose is to notify Main Thread what is user’s interaction with UI. As buildings to be recognized by background algorithms, there will be extra information about these buildings showing to user. These informations are shown in a form of UI elements(such as image thumbnails, web links. etc..), where users can click or expand on them for details. This message is to tell Main Thread exactly which element user clicked on. Additionally, since current app has 4 types of di↵erent extra information about a building (referred as artifacts of building), a helper class ArtifactOnClickMessage.java is created to allow BULDING INFO ONCLICK to send the same message but with di↵erent artifacts as content.
UPDATE EXPANDABLELIST MESSAGE: This is the actual UI update message to tell Main Thread a list of buildings informations to ready for shown on UI.
GPSLOCATOR MESSAGE: This GPSLOCATOR MESSAGE serves for the GPS Locator service to communicate with Main Thread and let it know user’s latest GPS location.
REFRESH UI MESSAGE: This is only for debug purpose telling Main Thread to show which building classifier file is ready and loaded on use.
File Manager & functions
FileManager.java: Although this application is to run as stand alone, it is designed in the way that needs to find files from server if they are not present locally. As previously mentioned inFILEMANAGER MESSAGE, such files are categorized into mainly 3 types plus 1 type of string data that describes building artifacts.
UTILITY FILE: utility files are what essential for the application to start up. Cur-rently there’s only one file listed in this category, which is the building list file. It listed all the buildings that the application is able to recognize.
CLASSIFIER FILE: as previously explained in preparation, each classifier file corre-sponds to one feature of a building
IMAGE FILE: images about the building, which will be shown as extra informations about a building after algorithm successfully detects the building on scene